


After decades of convergence on redistributive issues, British political parties are now clearly polarizing again. Prior research on the relationship between these elite polarization dynamics and citizen ideology in Britain is dominated by party sorting mechanisms (Adams, Green and Milazzo Reference Adams, Green and Milazzo2012a; Adams, Green and Milazzo Reference Adams, Green and Milazzo2012b; Evans and Neundorf Reference Evans and Neundorf2018; Milazzo, Adams and Green Reference Milazzo, Adams and Green2012). In these accounts, citizen redistributive ideology has remained stable while partisanship has changed. This means that partisan polarization (the ideological difference between partisans of different parties) increases when elites polarize because ideological motivations become greater. This leads voters to change their partisanship, not their ideology, and to sort on ideological lines. When elites converge, the opposite happens: partisan depolarization occurs because ideological motivation declines.
Establishing whether party sorting explains British polarization is an important question. Finding ideological stability in Britain, probably the most extreme case of elite depolarization in recent decades, in conjunction with similar findings in the other extreme of polarization in the USA, would mean that party sorting mechanisms are general, and that ideological change is unlikely ever to be systematically associated with elite polarization (Adams, Green and Milazzo Reference Adams, Green and Milazzo2012a). Stability implies that ideology can act as a fundamental constraint on parties’ latitude for movement because it operates as an ‘unmoved mover’ in the political system (Evans and Neundorf Reference Evans and Neundorf2018). Party sorting findings also imply that top-down elite changes cause polarization dynamics, because there are no changes in citizen ideology to be a bottom-up cause (Evans and de Graaf Reference Evans and de Graaf2013; Evans and Tilley Reference Evans and Tilley2011, Reference Evans and Tilley2012, Reference Evans and Tilley2017). This gives polarization dynamics considerable normative importance; the values which parties activate (or deactivate) by polarizing are associated with social groups and so cause the inclusion or exclusion of these groups from the political system. In the British case, Evans and Tilley (Reference Evans and Tilley2011, Reference Evans and Tilley2012, Reference Evans and Tilley2017) argue based on party sorting assumptions that elite depolarization caused the decline of class voting and the political exclusion of the working class.
The broader polarization literature contains two main alternatives to party sorting, both of which stress the importance of ideological change: (1) elite cue accounts, where partisans follow the ideological movement of parties and (2) ideological polarization accounts, in which general changes in citizen ideology are associated with elite polarization. Despite the conclusions these studies have reached, previous research on Britain does not establish the party sorting case against both elite cue and ideological polarization alternatives. Time-series cross-sectional evidence of party sorting is based on a small number of observations over short time periods, drawn entirely from the period of elite depolarization; trends are not estimated precisely enough to rule out substantial ideological change. Apparently corroborating evidence, using panel data to study individual-level mechanisms, gives results that are equally consistent with ideological polarization and party sorting mechanisms, only directly testing elite cue expectations.
In this article we examine party sorting, elite cue and ideological polarization accounts of redistributive polarization dynamics in Britain. We obtain many more observations over a longer time period, covering both depolarization and repolarization periods, by using data from the British Social Attitudes Survey (BSAS), the British Household Panel Survey (BHPS) and the British Election Study (BES). We use this data to answer three questions to enable proper differentiation between the three accounts of polarization. First, we ask whether ideology is stable or trends with elite and partisan polarization. Secondly, we explore whether partisan polarization dynamics are primarily caused by partisanship or ideological change. Finally, we investigate whether any ideological polarization trends differ between partisans and (initially ideologically similar) non-partisans. We reject party sorting accounts, which require ideology to be stable and changes in party support to drive partisan polarization, because we find that ideology trends with elite polarization and that ideological change causes partisan polarization. We reject elite cue accounts, which argue that it is primarily partisans’ ideology that follows elite polarization, because we find virtually identical trends for initially ideological similar non-partisans too. We thus find support for an ideological polarization account in which changes in elite polarization are associated with general changes in citizen redistributive ideology.
These results are important for understanding polarization dynamics generally, and British politics specifically, not least because rejecting the party sorting case reverses many of the implications described above. We conclude by discussing the implications associated with an ideological polarization account.
Polarization, Partisanship and Ideology
Across Europe, elite depolarization took place over an extended period of time; there was a reduction in the ideological differences between parties, particularly on the traditional left–right dimension of redistributive politics (Fiorina Reference Fiorina2017; Huber and Inglehart Reference Huber and Inglehart1995; Kitschelt Reference Kitschelt1994). The ideological convergence of the Labour and Conservative parties in Britain is perhaps the most extreme example of this trend, as particularly the Labour Party, but also the Conservatives, shifted to the centre after the highly polarized general election of 1983 in efforts to become ‘electable’ (Bale Reference Bale2017; Hindmoor Reference Hindmoor2004). However, it is now clear that British political parties are polarizing again, and have been doing so since the financial crisis. Figure 1 illustrates this basic pattern of declining and then increasing elite polarization in Britain based on expert survey measures of the differences between Labour and Conservative left–right positions.

Figure 1. Elite polarization in Britain, 1984–2017
Note: figure displays difference Between Labour and Conservative general left–right positions in Chapel Hill Expert Surveys (Bakker et al. Reference Bakker2015; Polk et al. Reference Polk2017; Ray Reference Ray1999; Steenbergen and Marks Reference Steenbergen and Marks2007).
There is considerable evidence that changes in elite polarization are generally associated with shifts in partisan polarization – the ideological gap between partisans (Adams, de Vries and Leitner Reference Adams, de Vries and Leitner2012; Lachat Reference Lachat2008). The clear pattern of partisan depolarization in Britain, characterized by a substantial decline in ideological differences between Labour and Conservative partisans, has been presented as the ‘mirror image’ of the very well documented partisan polarization trend which has accompanied elite polarization in the USA since the 1970s (Adams, Green and Milazzo Reference Adams, Green and Milazzo2012b; Green Reference Green2007; Green Reference Green2015). Unpicking the mechanisms that drive these trends in partisan polarization and depolarization has become one of the most important ways of understanding the relationship between elite polarization dynamics and public opinion (Fiorina and Abrams Reference Fiorina and Abrams2008; Hetherington Reference Hetherington2009). In the large literature on these topics, much of which focuses on the US case, three mechanisms have been identified as causing changes in levels of partisan polarization: party sorting, ideological polarization and elite cues.
Party sorting mechanisms are widely found in accounts of partisan polarization and depolarization in both the US and other contexts (Baldassarri and Gelman Reference Baldassarri and Gelman2008; Fiorina Reference Fiorina2017; Fiorina, Abrams and Pope Reference Fiorina, Abrams and Pope2008; Green Reference Green2007; Lachat Reference Lachat2008; Levendusky Reference Levendusky2009). In short, the party sorting mechanism is that partisan polarization is caused by partisan identity changing while ideology remains constant (for both partisans and all other citizens). With party sorting mechanisms, partisan polarization and depolarization arise because elites, rather than voters, change their ideological positions. When party elites are polarized, even though citizen ideology remains constant, party ideological signals become clearer and more consequential. Thus ideology becomes a more important factor in party evaluation, causing partisanship to change and so become sorted along ideological lines.
The second account of partisan polarization dynamics, most clearly developed in the US literature, invokes general ideological polarization mechanisms (Abramowitz Reference Abramowitz2010; Abramowitz Reference Abramowitz2013; Abramowitz and Saunders Reference Abramowitz and Saunders1998; Abramowitz and Saunders Reference Abramowitz and Saunders2008; Campbell Reference Campbell2016). According to this view, partisan polarization is caused by changes in the ideology of all citizens (partisans and non-partisans alike), while partisan identity remains constant. This generalized ideological polarization involves an increase in the dispersion of attitudes with positions moving away from the centre and towards extreme values. Since changes are occurring in relatively abstract general principles or values, the dynamics will affect the relationship between attitudes – that is, ideological constraint (Converse Reference Converse1964). Because the changes are general, they will be found across all sub-groups in society, and will not be restricted to partisans. Ideological polarization accounts most frequently argue that elite and partisan polarization are linked because parties respond to changing voter polarization. In this bottom-up version, mass ideological change is usually thought to be driven by long-term social and economic trends, like changing class or racial population structures and extended periods of material security, and by responses to critical events like economic crises (Abramowitz Reference Abramowitz2010; Inglehart Reference Inglehart2018; Kitschelt Reference Kitschelt1994).
The third account of partisan polarization in the US literature stresses elite cue mechanisms, which also expect ideological change but assert that partisanship plays a much more fundamental role in causing this. In short, the elite cue mechanism is that partisan polarization is caused by the ideology of partisans changing, while partisan identity and the ideology of non-partisans remains more stable. These mechanisms build on the theory that partisanship is a very stable identity, with dynamics governed by psychological and social identity processes. Therefore as parties shift their policy offerings, voters are very likely to update their ideology to match the positions taken up by the politicians they trust (Goren Reference Goren2005; Green, Palmquist, and Schickler Reference Green, Palmquist and Schickler2004; Zaller Reference Zaller1992). Partisan polarization dynamics are thus driven by processes of ‘conflict extension’ as polarization moves from elites to partisans, who take cues from them (Layman and Carsey Reference Layman and Carsey2002; Layman et al. Reference Layman2010). When polarization and depolarization are driven by elite cue mechanisms we do expect there to be evidence of patterns of real ideological change, but we expect to find these ideological changes mainly among people who are receptive to the cue; that is, we expect partisans to change ideologically much more than (initially ideologically similar) non-partisans.
While it is possible that all three mechanisms could be contributing to the observed patterns of partisan polarization, in the USA the debate has revolved around the question of whether polarization is driven purely by party sorting. The central evidence supporting this position is that despite very clear patterns of partisan polarization taking place over decades, there is no evidence of ideological change in long-term cross-sectional data (Baldassarri and Gelman Reference Baldassarri and Gelman2008; DiMaggio, Evans and Bryson Reference DiMaggio, Evans and Bryson1996). In the US case considerable effort has gone into looking at a large number of observations relating to many issues over long-term periods because establishing the absence of systematic trends requires precise estimates and because it is difficult to detect ideological trends in cross-sectional data. Opponents of the party sorting account have contributed to these debates by providing evidence that they argue shows that partisan polarization arises in part through ideological change mechanisms, but have not claimed that party sorting dynamics are absent.
Scholars examining British politics in these terms have provided unanimous support for the ‘pure’ party sorting account – the view that partisan depolarization is driven entirely by partisanship change, in conditions of ideological stability. The party sorting account fits with the established view of how ideology operates in British politics, where – particularly on the redistributive dimension – it has long been argued that ideology is ‘stable and enduring over time at the individual as well as the aggregate level’ (Evans, Heath and Lalljee Reference Evans, Heath and Lalljee1996, 120; cf. Bartle Reference Bartle2000; Heath, Evans and Martin Reference Heath, Evans and Martin1994). More recent research on the post-Thatcher period of elite convergence in British politics, using both cross-sectional and panel data, has been more directly inspired by (and explicitly supportive of) US party sorting models. Cross-sectional research has concluded that elite depolarization causes important shifts in partisanship but not in ideology, because data from four waves of the BES shows clear partisan depolarization trends, but much more mixed and modest patterns of ideological change (Adams, Green and Milazzo Reference Adams, Green and Milazzo2012a; Adams, Green and Milazzo Reference Adams, Green and Milazzo2012b). Closely related research using panel data from the depolarization period to model individual-level dynamics from cross-lagged regressions also supports party sorting mechanisms (Evans and Neundorf Reference Evans and Neundorf2018; Milazzo, Adams and Green Reference Milazzo, Adams and Green2012). Elite cue ideological change mechanisms are rejected because partisanship has no effect on ideology, but ideology has an effect on partisanship. Ideology also has a stronger effect on partisanship when parties are more polarized (that is, earlier in the periods under study), which is taken as further evidence that partisan – rather than ideological – change is responsible for partisan depolarization. Evans and Neundorf (Reference Evans and Neundorf2018) also rejects ideological depolarization mechanisms, arguing that redistributive values should be seen as ‘stable aspects of voters political belief systems’ and endorsing the conclusion first reached by Adams, Green and Milazzo that there has been a ‘non-convergence of the British public's policy beliefs’ because they find very high levels of ideological stability.
Issues with the Existing Literature
Although there is currently a party sorting consensus that partisanship change accounts for partisan depolarization in post-Thatcher Britain, there are reasons to be concerned about both the time-series cross-sectional analysis and the panel evidence supporting this view.
The time-series cross-sectional argument for party sorting in Britain comes from finding clear and consistent partisan depolarization trends while ideology is stable or at most modestly depolarizing. The fact that two conclusions about ideological trends are left open is concerning because there is an important difference between the ideological stability case and the case in which ideology trends with partisan polarization (even if modestly). Party sorting conclusions only follow if ideology is stable. As we will see, apparently modest patterns of ideological change can cause dramatic partisan depolarization even when partisanship is stable.Footnote 1 These two possibilities are left open in the British case because trends are much less precisely measured than in the US case, primarily because British conclusions have been based on a data set with at most twenty-four data points, while for the American case the analysis involves hundreds or even thousands of data points (Baldassarri and Gelman Reference Baldassarri and Gelman2008; DiMaggio, Evans and Bryson Reference DiMaggio, Evans and Bryson1996).Footnote 2 In addition, cross-sectional research on Britain has only examined the period of depolarization and not the recent period of polarization. This is despite the fact that the shift in the direction of elite polarization in Britain since the financial crisis should help identify genuinely associated patterns because trends will all reverse at this point in time. By contrast, in the American case, where polarization has been increasing for over forty years, patterns cannot be distinguished from other linear time trends.
Apparently corroborating arguments using panel data to model individual-level dynamics are based on the parameters of cross-lagged panel models alone, even though these parameters are not suitable for adjudicating between ideological depolarization and party sorting mechanisms. Cross-lagged panel models do provide evidence about whether partisans’ ideological dynamics differ from those of (initially ideologically similar) non-partisans (as expected by the elite cue mechanism). However, as we show in Appendix A, the issue is that they provide ambiguous answers to other questions needed to rule out ideological depolarization – particularly on questions of ideological stability and whether partisanship change or ideological change is primarily responsible for causing partisan depolarization trends. This is because the model parameters describe transition matrices, and the effect of a transition matrix depends on the initial population it operates on. Thus, the same multi-nominal cross-lagged panel model parameters can describe radically different patterns of ideological change, from sharp ideological depolarization (in initially polarized conditions), through ideological stability (in an initially equilibrium condition) to ideological polarization (in initially depolarized conditions). For the same reason, the model parameters are ambiguous on the question of whether ideological or partisanship change is responsible for partisan polarization. The same patterns of cross-lag and stability coefficients could describe a situation in which changes in partisan polarization are primarily caused by either partisanship changes or ideological changes (depending on the initial conditions). We will demonstrate that it is possible to produce answers to the questions of whether ideology is stable, depolarizing or polarizing and whether ideological change or partisanship change is responsible for partisan depolarization by supplementing the model parameters with other information (particularly about initial population compositions). The existing panel analysis does not do this; instead, it makes inferences from the model parameters alone.
Approach and Data
The first concern we raised about previous conclusions is that they are based on a narrow evidence base, which generates a small number of observations on a small number of redistributive issues over a short period of time – only from the period of depolarization. We therefore use a broader evidence base, which provides more observations on more redistributive issues over a longer period of time relating to periods of both polarization and depolarization. Our second concern was that cross-lagged panel models provide ambiguous answers that are consistent not only with party sorting but also with ideological polarization accounts. In order to address this concern we answer a series of three questions that, when combined, decide between party sorting, elite cue and ideological polarization accounts using methods which provide determinate answers to these questions. Below we describe the data we use to increase the number of observations and then the questions and related expectations that are necessary to decide between the three accounts of depolarization. We describe the methods used to provide unambiguous answers in the subsequent sections dedicated to each question. At the end of each section we also directly compare our findings with the results of previous analysis.
Our approach to measuring ideological trends follows that of Baldassarri and Gelman (Reference Baldassarri and Gelman2008), who study polarization in general using as wide a range of political attitudes as possible. Hence we also study redistributive polarization and depolarization using as wide a range of redistributive attitudes as possible. We use data from the three long-running surveys that provide longitudinal evidence of the relationship between redistributive ideology and partisanship in Britain since the 1980s. Our primary evidence for establishing long-term trends comes from the BSAS, because this provides nationally representative information about party identification and redistributive attitudes for almost every year since 1983. The BSAS includes seventeen questions about redistributive attitudes that have been asked three times or more in both the period of elite depolarization from 1983–2007 and the period of repolarization from 2007 onward; five of these attitudes constitute a widely used and validated redistributive attitude scale (Evans, Heath and Lalljee Reference Evans, Heath and Lalljee1996). This data set contains 102,858 observations in thirty-two survey waves.
The theories we are investigating link aggregate trends over long periods of time to individual-level mechanisms, which we will investigate using panel data in the final parts of our analysis. To link to this and to address the potential concern that aggregate-level ideological trends are driven by changes in population composition (generational replacement) rather than individual-level ideological dynamics (Inglehart Reference Inglehart1997), we use the BHPS, which asked a six-item redistributive scale in seven waves between 1991 and 2007 (Heath, Evans and Martin Reference Heath, Evans and Martin1994). We analyse the 4,636 respondents from the BHPS who participated in all seven of these waves, so the composition of the sample in all waves is identical. By looking at long-term trends where the sample is held constant, we eliminate the possibility that those trends are driven by changes in population composition. This will show that the trends are linked to individual-level mechanisms.
In order to compare our findings with previous research, our analysis also includes the four redistributive questions from the four waves of the BES data (1987–2001) used by Adams, Green and Milazzo (Reference Adams, Green and Milazzo2012a) to support the party sorting argument. This data set is a composite of nationally representative and fixed composition data because it combines three waves of cross-sectional data with the final wave of a three-wave panel. It contains 11,260 observations over four survey waves.
Further details, including the wording of the twenty-seven redistributive questions asked in these three surveys, can be found in Appendix B. To facilitate interpretation, we recode all of these so that the scale runs from 0 (least pro-redistributive position) to 1 (most pro-redistributive position). While all of these questions concern redistributive values, there are potentially important differences between them.Footnote 3 Our multilevel modelling approach addresses this potential heterogeneity by estimating average trends and the variability in trends. The latter indicates whether average trends result from all issues trending together, or whether there is a large variation in trends across issues.
All three surveys also include a very similar measure of partisan identification, which asks respondents if they identify with a political party, and if not whether they are closer to one of the parties. Following standard practice, we treat those who identify with or feel closer to a party as party identifiers. We code Labour partisanship as 1, and Conservative partisanship as 0, treating all other values as missing.
The series of three questions we use to decide between the theories is as follows. First, we ask whether ideological trends are associated with partisan and elite polarization trends. Secondly, we explore whether partisan polarization is primarily caused by ideological or partisanship change. Finally, we investigate whether any ideological convergence patterns differ between partisans and (initially ideologically similar) non-partisans. The party sorting expectations are that: (1) ideology is stable, so we will not find that ideological changes are associated with elite and partisan polarization and (2) partisanship change, rather than ideological change, is the primary cause of partisan depolarization. The ideological depolarization and elite cue mechanisms share the expectation of ideological change, so we will observe that ideology does move with elite and partisan polarization. Elite cue mechanisms expect depolarization to be much greater among partisans, so we will find that ideological convergence is much more pronounced among partisans than among initially ideologically similar non-partisans. However, ideological polarization accounts expect ideological convergence among both partisans and non-partisans.
Was Ideological Polarization Associated with Elite and Partisan Polarization?
The question of whether ideological trends match partisan (and elite) polarization trends is well established, and we use well-established methods to study it. Our contribution comes from analysing the data described above with many more observations over a longer time period, where our data includes the data used in prior studies and expands it further.
We follow Baldassarri and Gelman (Reference Baldassarri and Gelman2008) and measure partisan polarization using the (Pearson) correlation coefficient between ideological attitudes and partisanship. With a binary measure of partisanship this provides a scaled measure of the ideological gap between the partisans. We use the same three measures of ideological polarization as Adams, Green and Milazzo (Reference Adams, Green and Milazzo2012a). The first two are measures of dispersal, attitude standard deviations and attitude extremism (the proportion of responses falling into either of the extreme categories on the scale). The final measure examines attitude constraint using the (Pearson) correlation coefficient between two attitudes making up an attitude pair. All attitudes are included in the partisan polarization and constraint analysis, but as in Munzert and Bauer (Reference Munzert and Bauer2013) we exclude short scales (three categories or less) from the analysis of dispersal.
Was Partisan Polarization Associated with Elite Polarization?
All three mechanisms expect that the ideological gap between partisans will be greater when parties are polarized, so if partisan polarization is not associated with elite polarization then none of the mechanisms can be functioning as expected. We begin our analysis by checking this common expectation that partisan polarization in Britain did decline during the period of elite depolarization and then increase during the period of elite polarization.
To test for trends in these coefficients, Baldassarri and Gelman (Reference Baldassarri and Gelman2008) introduced the use of varying intercept, varying slope multilevel models, using time in decades as a proxy for increasing polarization. The dependent variable is the survey wave correlation between attitude i and partisanship in year t, y it. Fomally:
 $$y_{it} = \alpha _i + \beta _it + \epsilon _{it}$$
The second-level unit is the attitude. Our primary interest is in the overall trend β – the model estimated mean of β i.Footnote 4 In the British case there was depolarization to 2007 and repolarization after this date, so we fit separate models to the data for the period up to 2007 and the period from 2007–16, with the primary expectation of downward trends to 2007 (negative β) and upward trends after 2007 (positive β). This gives our first hypothesis:
Hypothesis 1 Partisan polarization is associated with elite polarization.
In a next step we test this hypothesis. Figure 2, following Baldassarri and Gelman (Reference Baldassarri and Gelman2008), plots the data and trend lines, which are later summarized in regression form. The general purpose of these plots is to provide reassurance that the results are not artefacts of the model but are driven by important features of the data. However, in this first instance we also use this figure to provide a further explanation of the model parameters. The figure is split into twenty-seven facets, one for each of the attitudes we are studying. Within each facet we plot the data: each point in the figure represents a survey wave correlation between that attitude and a Labour–Conservative partisanship dummy variable. Some facets have more points than others because some questions were asked more often, for example the BHPS redistribution questions were only asked seven times during the period 1991–2007 and the BES redistribution questions were only asked four times from 1987 to 2001. Partially pooling the evidence, which is particularly consequential for attitudes for which there is little evidence, the model fits a regression line to the data for each attitude (separately for the periods of depolarization and repolarization). The median estimate of each of the twenty-seven regression lines is plotted on the figure. Fit lines with a median negative slope are red (black in print version), and fit lines with a median positive slope are blue (grey in print version).
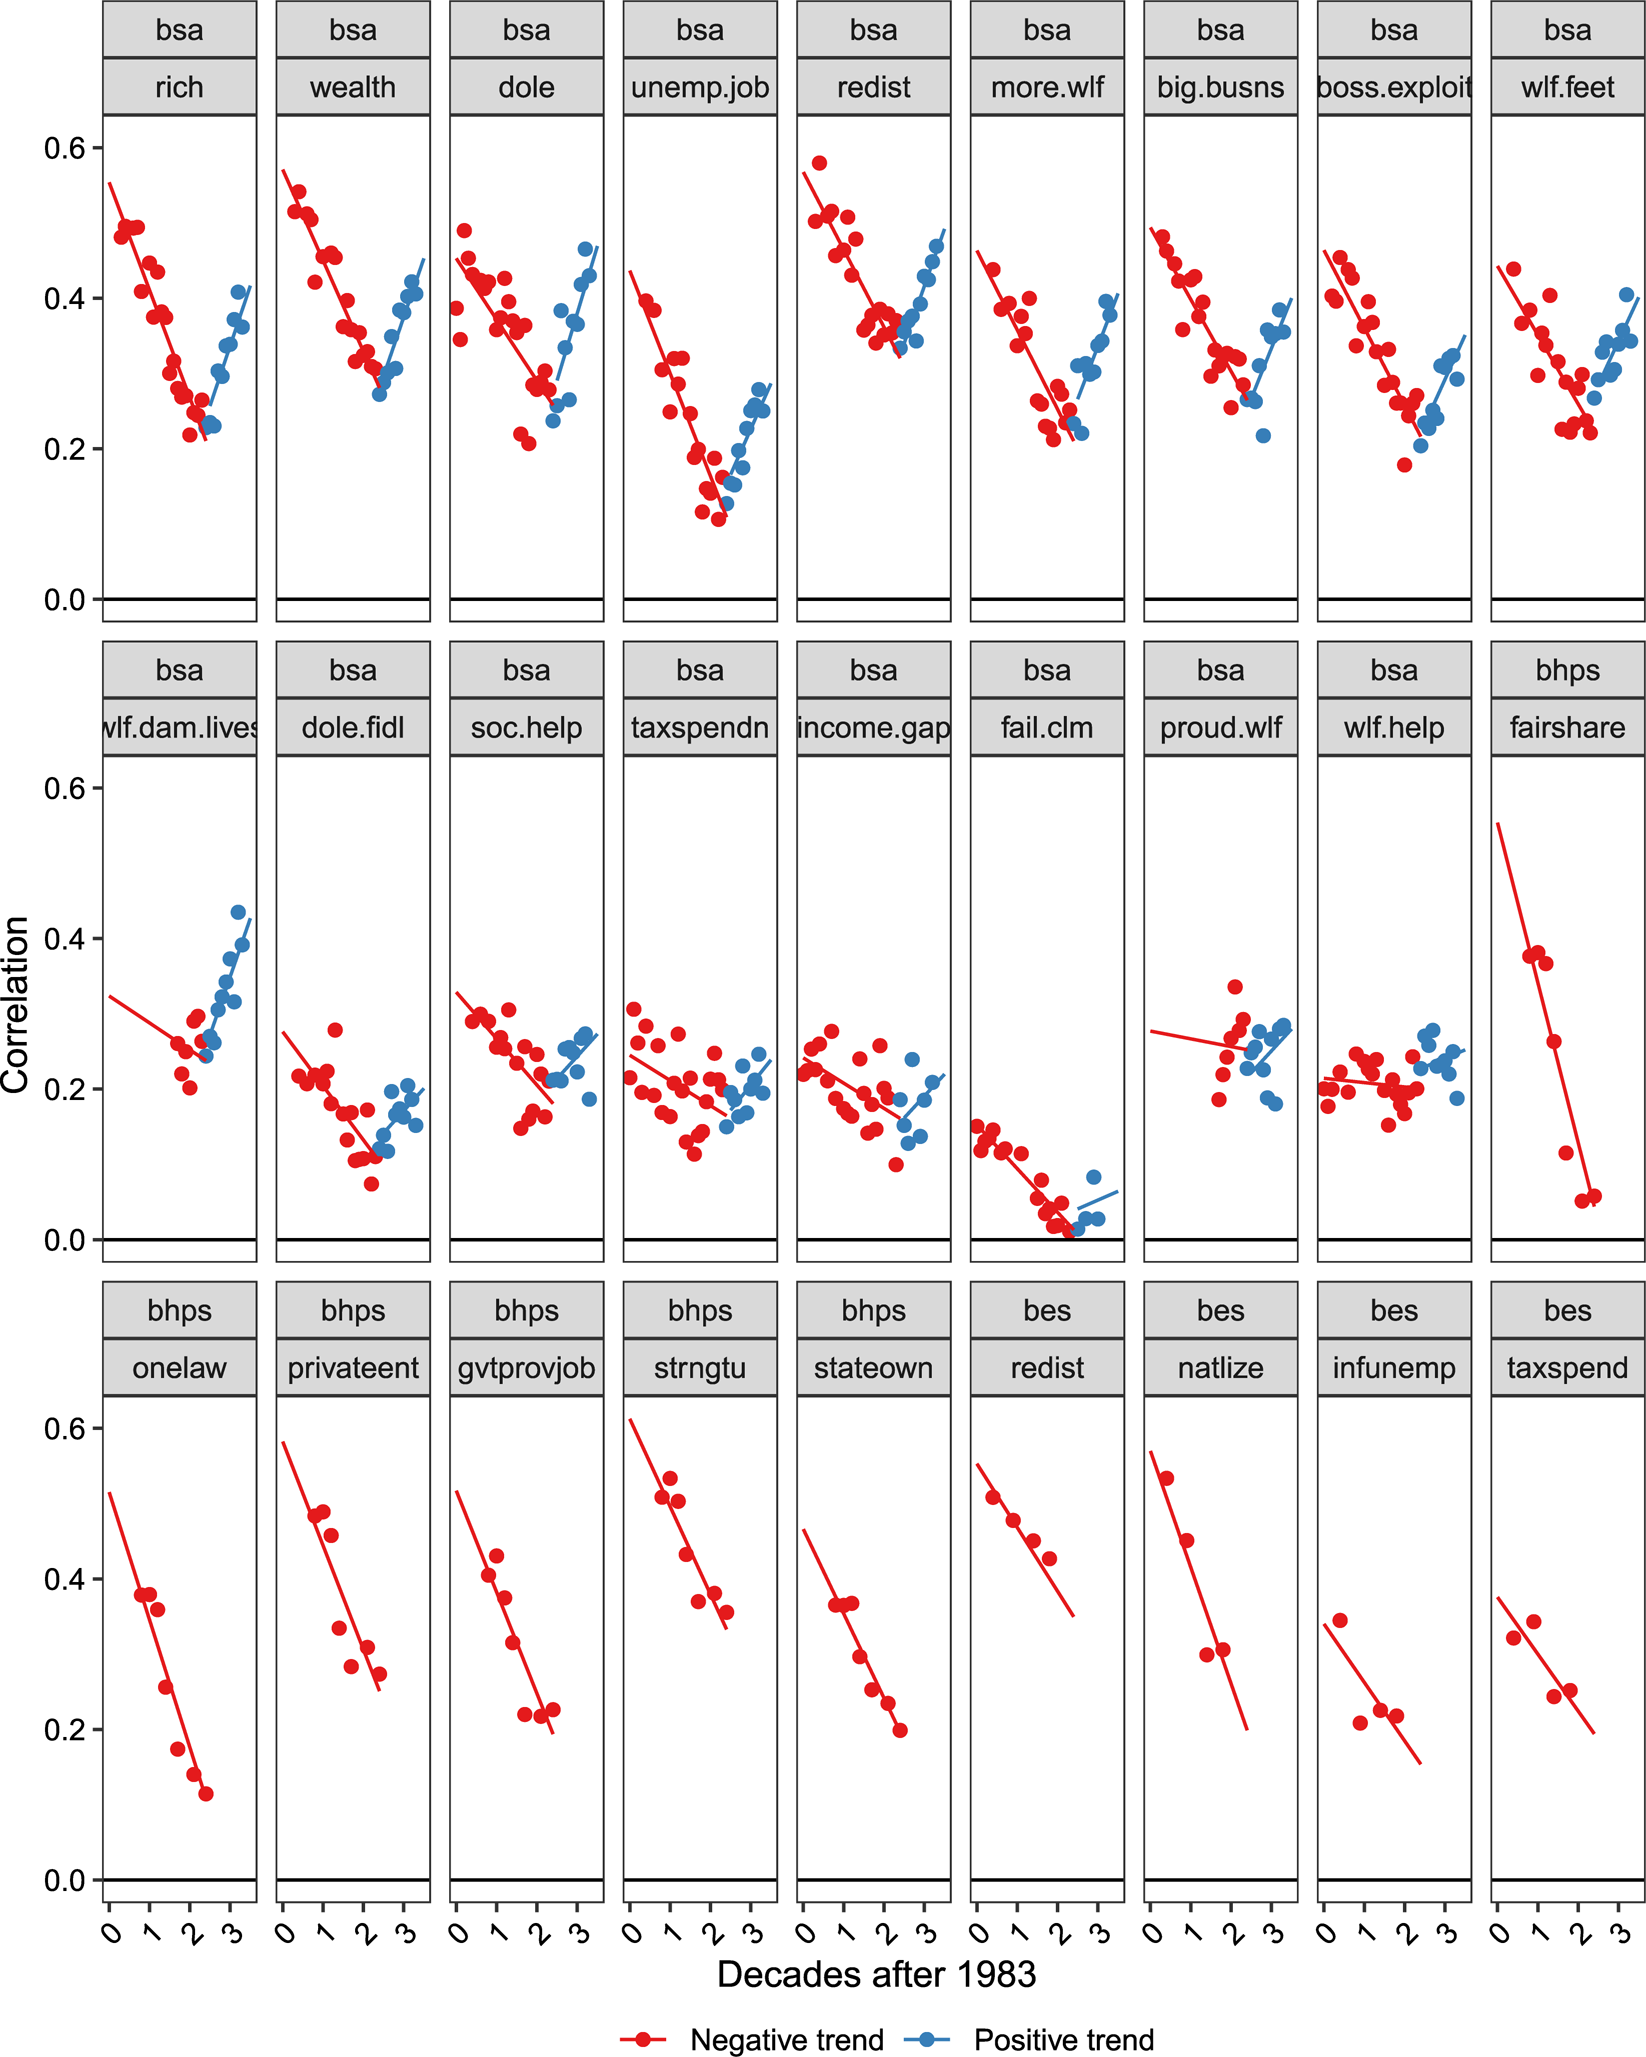
Figure 2. Trends in partisan depolarization and repolarization in the redistributive attitudes in the BSAS, BHPS and BES
Note: Appendix B displays the survey questions relating to each facet.
This evidence is summarized in Table 1, which breaks the results down by survey. The key coefficient of interest is the coefficient on time in decades, measured here in decades after 1983. The first model in the table provides a summary across all twenty-seven attitudes in all three surveys in the period 1983–2007. The intercept 0.43 (s.e.: 0.03) indicates the average correlation between redistributive attitudes and partisanship in 1983, when time was 0, and the s.d. on intercepts of 0.14 indicates that about two-thirds of the intercepts will fall between 0.57 (=0.43 + 0.14) and 0.29 (=0.43−0.14). Our central interest is in the coefficient on time in decades of −0.09 (s.e.: 0.01), which indicates that on average, the correlation between partisanship and redistributive attitudes declined by 0.09 per decade, or by 0.23 in the twenty-four-year period between 1983 and 2007. The s.d. of 0.05 on trends is informative about the distribution of trends around this average, with 95 per cent of trends modeled to fall in the range of −0.19 to + 0.01 (that is, within about two standard deviations of the mean). This significant negative trend is seen in the data overall, and also in the three surveys individually. In the period after 2007, when we only have BSAS data, there is a clear positive average trend of +0.10 (s.e.: 0.02) per decade (s.d.: 0.06). This indicates that not only is there a clear average trend of partisan polarization, but that polarization is expected to occur on the overwhelming majority of redistributive attitudes.
Table 1. Results of multi-level models with dependent variable as attitude partisanship (correlation of attitude with Labour (vs. Conservative) partisanship) in period 1983–2007 and 2007–2016

Note: models show results across all three surveys and in each survey independently.
Overall, we find a clear negative coefficient on time in the period of depolarization and a clear positive coefficient on time during the repolarization period. This is strong evidence in support of Hypothesis 1 that partisan polarization is associated with elite polarization.
Was Ideological Polarization Associated with Elite Polarization
The central difference between ideological polarization and elite cue theories on the one side and party sorting accounts on the other is that the former two mechanisms create expectations that elite and partisan polarization is accompanied by systematic ideological change, in the form of ideological polarization. However, patterns of ideological stability would provide key support to party sorting arguments. To examine whether party polarization is associated with real ideological change, we examine whether there were decreases in attitude extremism, attitude standard deviations, and attitude constraint during periods of elite and partisan depolarization and increases in these measures during periods of elite and partisan polarization. To analyse the three different aspects of ideological polarization, we fit separate models in which y it is, in turn, (1) the proportion of extreme attitudes in issue i at time t, (2) the standard deviation of issue i at time t and (3) the correlation between issue pair i at time t. In each case we fit separate models to the period of elite depolarization, where we have measures from all three surveys, and repolarization, where we only have data from the BSAS, with the expectation of significant negative coefficients on time for the period 1983–2007 and significant positive coefficients on time for 2007–16. This enables us to test our second hypothesis:
Hypothesis 2 Ideological polarization is associated with elite polarization.
The results of testing this hypothesis, summarized in Table 2, show a consistent pattern across all three measures of ideological change. For the period of depolarization we find significant negative trends in extreme values (−0.04, s.e.: 0.01), standard deviations (−0.01, s.e.: 0.00) and constraint (−0.03, s.e.: 0.00). For the period of repolarization we find significant positive trends in extreme values (0.04 s.e.: 0.01), standard deviations (0.01 s.e.: 0.00) and constraint (0.05 s.e.: 0.00).
Table 2. Results of multi-level models of ideological depolarization with dependent variable as proportion of extreme responses, standard deviation of responses, constraint between attitude pairs in period 1983–2007 and 2007–16

For the period of elite depolarization for which we have data from all three surveys, the trends are consistent across surveys. As we show in Appendix C, significant negative trends are found on all three measures of ideological change in the BSAS alone and the BHPS alone. The trends in the BES data alone are negative for all three measures, but only statistically significant for standard deviations.
Figure 3 shows the relationship between regression trends and the underlying data for the case of standard deviations. Due to space constraints we plot only this case. We display standard deviations not just because they are perhaps the most natural of the three measures of polarization, but also because the trends (and the directional shifts in 2007) are of the smallest magnitude, and so are the least likely to be graphically observable. We provide similar plots for extreme values and attitude constraint trends in Appendix C.

Figure 3. Trends in standard deviation of redistributive attitudes, 1983–2007 and 2007–2016
Overall, finding declining ideological polarization during the period of elite and partisan depolarization, and increasing ideological polarization during the period of elite and partisan polarization, is clear evidence that ideological polarization is associated with elite and partisan polarization. We note that this pattern cannot be explained solely by a changing population composition; for the period when both data sets are available, we find the same pattern in both the nationally representative BSAS and the BHPS looking at the same sample of individuals in each wave. We therefore conclude that there is substantial evidence of ideological change at the aggregate and individual levels, and that this real ideological change is associated with elite and partisan polarization.
Relationship to Previous Findings
How does this conclusion, that ideological polarization is associated with elite and partisan polarization, relate to existing conclusions based on panel data and time-series cross-sectional patterns?
Our findings of ideological depolarization in the BHPS directly contradict the conclusion of aggregate-level ideological stability drawn in Evans and Neundorf (Reference Evans and Neundorf2018) from panel data despite analysing the same data set. Table 3 reproduces the cross-lagged model parameters in their transition matrix form. Evans and Neundorf infer that there was no ideological convergence and that ideology was ‘very stable’ simply based on the large transition probabilities on the matrix diagonal. In the introduction we pointed out that the parameters of multi-nominal cross-lagged panel models alone do not generally determine whether ideology is stable or depolarizing, because they generally determine an equilibrium condition and move the population composition towards this point. The transition matrix in Table 3 has a very depolarized equilibrium (77 per cent centrist, 12 per cent leftist and 11 per cent rightist) and will cause ideological depolarization in any initial population that is more polarized than the equilibrium. Figure 4 shows the ideological trends caused by this matrix from the initial conditions that result in the seven-wave aggregate population composition reported in Evans and Neundorf (58 per cent centrist, 20 per cent leftist, 22 per cent rightist). There is a clear pattern of ideological depolarization from 1991 to 2007: centrism increases (from 49 to 65 per cent), leftism declines (from 25 to 16 per cent) and rightism declines (from 25 to 19 per cent). This shows, contrary to the explicit conclusion in Evans and Neundorf (Reference Evans and Neundorf2018), that multi-nominal cross-lagged panel analysis also implies a substantial trend of ideological depolarization between 1991 and 2007.

Figure 4. Projected growth in centrist ideological group and declines in size of left and right ideological groupings
Note: from model in Evans and Neundorf (Reference Evans and Neundorf2018).
Table 3. Estimated transition matrix of latent class model

Source: calculated from Evans and Neundorf (Reference Evans and Neundorf2018) Table 1.
Previous time-series cross-section research using BES data only from the period of elite depolarization supported party sorting mechanisms because ideology was stable or at most modestly depolarizing while there was a clear pattern of partisan depolarization (Adams, Green and Milazzo Reference Adams, Green and Milazzo2012a). Our results refine this picture by showing that during the period of elite depolarization, ideology was not stable but rather depolarized significantly. We extend this picture by examining a longer time period that includes the period of elite repolarization, and find clear and consistent patterns of partisan and ideological repolarization. The extension is significant, because the common reversal of direction in trends in the mid-2000s helps establish that the patterns we describe are connected, and reinforces the case first made by Adams, Green, and Milazzo (Reference Adams, Green and Milazzo2012a) that polarization and depolarization can be thought of as mirror images. The refinement is important because showing that there are patterns of systematic ideological change means that party sorting conclusions are not implied. In the presence of ideological change, partisan depolarization patterns could come from either partisanship or ideological change. Thus, further evidence is needed to decide whether partisanship changes or ideological changes cause partisan polarization.
Was Partisan Depolarization Caused by Ideological or Partisanship Change?
Given that we have identified a pattern of ideological change, we now explore whether ideological change or partisanship change was responsible for partisan depolarization. To do this we use the panel data, which is of exceptionally long duration with seven waves over sixteen years of partisan depolarization, from 1991 to 2007. To examine whether partisanship change or ideological change caused partisan depolarization, we exploit this unusual data to compare two ‘counterfactual’ partisan polarization trends to the observed pattern of partisan polarization.
The first counterfactual trend describes what would have happened to partisan polarization if people had changed only their partisanship, keeping their ideology stable. We label this ‘fixed ideology depolarization’. Fixed ideology depolarization describes the partisan depolarization trend that arises from partisanship change alone. If the party sorting mechanism of partisanship change is the main cause of partisan depolarization, then we would expect very little difference between the observed pattern of partisan depolarization and fixed ideology depolarization, while if ideological change is necessary to explain partisan depolarization then we would expect these differences to be large.
The second counterfactual trend describes what would have happened to partisan polarization if people had changed only their ideology, keeping their partisanship stable. We label this ‘fixed partisan depolarization’. Fixed partisan depolarization describes the partisan depolarization that arises from ideological change alone. If ideological change (through either elite cue or ideological depolarization mechanisms) is primarily responsible for partisan depolarization, then we would expect very little difference between the observed pattern of partisan depolarization and fixed partisan depolarization, while if partisanship change is necessary to explain partisan depolarization we would expect these differences to be large.
We construct the fixed ideology trend by measuring the ideological gap at a fixed point in time (the initial wave) between partisans in each wave (that is, we take the correlation between partisanship in each wave and ideology in the 1991 survey wave). Measuring ideology at a fixed point in time means there is no change in ideological positions, only in the composition of the partisan groups.
We construct the fixed partisanship trend by measuring the ideological gap in each wave between the group of partisans in the initial wave (that is, we take the correlation between partisanship in the 1991 wave and ideology in each wave). This fixes the composition of the group of individuals we examine, leaving only ideological change to cause trends.
We test these expectations using an extension of the multilevel model used in Hypothesis 1, where the coefficient on time measures the observed partisan depolarization trend, which becomes the baseline coefficient on time in this model. We use a data set containing the observed, fixed partisan and fixed ideology survey wave correlation coefficients; dummy variables indicate whether the partisanship or ideological measure is fixed in its 1991 state. Our primary interest is in the interaction between these dummy variables and time, which gives the difference between the observed depolarization trend and fixed ideology depolarization and fixed partisan depolarization, respectively. This gives two hypotheses:
Hypothesis 3a Ideological change is required to explain partisan depolarization: the observed trend of partisan depolarization is negative and substantially larger in magnitude than fixed ideology depolarization.
Hypothesis 3b Partisan change is required to explain partisan depolarization: the observed trend of partisan depolarization is negative and substantially larger in magnitude than fixed partisan depolarization.
The evidence supporting Hypothesis 3a and 3b is found in Figure 5 and summarized in regression Table 4. The figure plots observed partisan depolarization (grey) together with the fixed ideology (top panels in black) and fixed partisanship (bottom panels in black) depolarization trends. The basic pattern evident in this plot shows that ideological change is more important than partisanship change because the observed pattern more closely resembles fixed partisan depolarization (where only ideology changes) than fixed ideology depolarization (where only partisanship changes).

Figure 5. Partisan depolarization mechanisms in the BHPS 1991–2007 data
Note: observed patterns of partisan depolarization together with fixed ideology depolarization and fixed partisan depolarization. The grey data show the observed patterns in each survey wave. The black data show the position if either ideology (in the top row) or partisanship (in the bottom row) is held at its 1991 value.
Table 4. Results of multi-level models with dependent variable as correlation between redistributive attitude and partisanship in the BHPS 1991–2007

Note: the models show trends in the observed data, stable (1991) ideology, stable (1991) partisanship and with dummy variable indicating the condition.
When testing Hypothesis 3a, that ideological change is required to explain partisan depolarization, we expect a large positive interaction between the fixed ideology dummy variable and time. The difference between the fixed ideology trend and the observed depolarization trend, expressed by this coefficient (0.12; s.e.: 0.02), is positive, substantively large relative to the observed depolarization trend (−0.14; s.e.: 0.01) and statistically significant. Indeed, it indicates that without ideological change partisan, depolarization would have been about −0.02 per decade rather than −0.14, so about 85 per cent of the observed depolarization would not have occurred. This evidence leads us to accept Hypothesis 3a: the observed trend of partisan depolarization is much greater in magnitude than the fixed ideology depolarization trend; holding ideology constant makes a very large difference to the observed pattern of ideological convergence. Contrary to party sorting expectations, ideological change is required to explain the observed pattern of partisan depolarization.
In our test of Hypothesis 3b, that partisanship change is required to explain partisan depolarization, we expect a large positive interaction between the fixed partisanship dummy variable and time. In Table 4, the difference between the large observed depolarization trend and the fixed partisanship trend, expressed by the fixed partisanship interaction with time, is small and statistically not significant (0.03; s.e.: 0.02). This indicates that without partisanship change, the estimated depolarization trend would have been −0.11, which is close to (and indeed not significantly different from) the observed depolarization trend of −0.14. This evidence leads us to reject Hypothesis 3b: the observed trend of partisan depolarization is not much greater in magnitude than fixed partisanship depolarization; holding partisanship constant makes only a very small difference to the observed pattern of ideological convergence. Contrary to party sorting expectations, partisanship change is not required to explain partisan depolarization.
The finding that ideological change, rather than partisanship change, was the primary cause of partisan depolarization directly contradicts the claim in Evans and Neundorf (Reference Evans and Neundorf2018) that partisanship change was the main cause of partisan depolarization. As in the case of ideological depolarization, the issue is that no inferences about this matter can safely be made using the method in Evans and Neundorf (Reference Evans and Neundorf2018) of looking at model parameters alone; information about initial sample compositions is also required. In Appendix A.2 we show that once this additional information is examined, cross-lagged panel analysis also implies that ideological change – and not partisanship change – was primarily responsible for partisan depolarization.
Did Partisanship Cause Depolarization?
Finally, we examine the elite cue claim that partisanship causes ideological depolarization – that partisans change their ideology much more dramatically than initially ideologically similar non-partisans. We do this by comparing the ideological convergence of partisans to the ideological convergence of an initially ideologically similar group of non-partisans. In the initial wave of the survey we match non-partisans and partisans ideologically. We use matching methods to find a group of initially leftist non-partisans whose ideological distribution matches that of Labour partisans in 1991, and a group of initially rightist non-partisans whose ideological distribution matches that of Conservative partisans in 1991.Footnote 5 We have already seen in the discussion of Hypothesis 3b above that there is substantial convergence between partisans.Footnote 6 The elite cue expectation is that the magnitude of the ideological convergence among partisans will be much greater than the magnitude of convergence among the matched non-partisans.
We measure the ideological gap between the non-partisan groups, which we call matched non-partisan depolarization, with the correlation between a leftist dummy variable (with initially leftist non-partisans coded 1 and initially rightist non-partisans as 0) and each redistributive attitude in each survey wave. We compare fixed partisan depolarization to the matched non-partisan depolarization, using a data set that combines the survey wave correlation coefficient measuring fixed partisan depolarization with the survey wave correlation coefficient's matched non-partisan depolarization. A dummy variable indicates whether the coefficient relates to the partisans. Our primary interest is the interaction between the partisan dummy variable and time, which gives the difference between fixed partisan depolarization and matched non-partisan depolarization.
Hypothesis 4 Ideological depolarization is more pronounced among partisans than initially ideological similar non-partisans.
The evidence related to this question is shown in Figure 6 and summarized in Table 5. Figure 6a shows the mean position of the initially left- and right-wing non-partisans in each of the survey waves. It also shows the trajectory of the group of initially Labour and Conservative partisans. We include these mean plots to increase our confidence that the matching is working as expected. In particular, the small differences between the partisan and matched group means in 1991 provide visual confirmation of matching success.Footnote 7 Figure 6b plots the key evidence of interest, the convergence between partisans (dashed line) and matched non-partisans (solid line). The elite cue expectation is that the negative trend indicating partisan ideological convergence will not be shared by the matched non-partisans. In the regression table describing this data in Table 5, the central elite cue expectation is of a large negative interaction between the matched non-partisan dummy variable and time. Visually the plots suggest that the systematic pattern of convergence for both groups is about the same, and this is summarized statistically in the model, where the −0.01 (s.e.: 0.02) coefficient on the relevant interaction is small and statistically insignificant. We therefore reject Hypothesis 4, with the finding that ideological convergence took place among both partisans and non-partisans.

Figure 6. Ideological depolarization in the BHPS 1991–2007
Note: ideological trajectories of partisans and non-partisans matched on initial ideological position. Showing ideological trajectories of fixed groups of initial Labour and initial Conservative partisan and of fixed groups of non-partisans with initial ideology matching the ideology of the initial Labour and Conservative partisans.
Table 5. Results of multi-level models with dependent variable as correlation between redistributive attitude and fixed group partisanship and ideologist dummy variables in BHPS 1991–2007

The finding that the ideological trajectories of partisans and non-partisans are similar is in agreement with the claim in Evans and Neundorf (Reference Evans and Neundorf2018) that partisanship has little impact on ideology. However, they describe this pattern as similar ideological stability. In Appendix A.3 we show that their cross-lagged panel parameters, when combined with information about initial conditions, agrees with our description that the ideology of partisans and initially ideologically similar non-partisans converged substantially, with convergence at an approximately equal rate.
Discussion and Conclusion
Since the financial crisis, British political parties have been polarizing again after decades of convergence on redistributive ideology. Party sorting accounts, which stress ideological stability and argue that partisan polarization results from partisanship change, provide the basis for understanding how these elite polarization dynamics connect to public opinion. However, elite cue and ideological depolarization accounts, which are prominent in the broader polarization literature, have not been sufficiently examined in the British context. In this article we answered three questions that enabled us to choose between party sorting, elite cue and ideological polarization accounts of polarization dynamics: (1) whether ideology trends with elite and partisan polarization, (2) whether partisan polarization was caused by ideological or partisanship change and (3) whether any ideological trends were found predominantly in partisans. We found that ideological polarization was associated with elite and partisan polarization (accept Hypotheses 1 and 2), that ideological change was required (accept Hypothesis 3a) and partisanship change was not required (reject Hypothesis 3b) to explain the observed pattern of partisan depolarization, and that ideological convergence occurred among partisans and initially ideological similar non-partisans alike (reject Hypothesis 4). We rejected party sorting mechanisms because ideology was not stable and partisan depolarization did not primarily occur through changing partisanship. We also ruled out elite cue mechanisms, and thus the most prominent account of elite polarization causing ideological polarization, because we found virtually identical ideological convergence among partisans and initially ideologically similar non-partisans. We therefore endorsed an ideological polarization account of citizen ideological dynamics in Britain.
What are the implications of these findings for the study of polarization dynamics? We have presented evidence of a relationship between ideological change and elite polarization. Party sorting theorists use the absence of such a relationship to argue that elite polarization is caused by intra-elite dynamics and that parties cannot shape citizen ideology. We have also presented evidence that the relationship between elite and ideological polarization is not the result of partisans distinctively following parties to new ideological positions. This rules out the two most commonly found accounts of partisan polarization, party sorting and elite cue accounts, both of which are elite driven.
Although we reject the two most common elite-driven accounts of partisan polarization, we recognize that other elite-driven explanations remain possible. We have shown that if elite polarization does cause mass polarization, it does so through a mechanism that affects both partisans and non-partisans. This could arise because ideological cues are not coming from parties but from another elite group, perhaps from the news media or social movements. It is also possible that the ideological signals do originate with parties, which perhaps change the national conversation. This latter case would imply that parties cause general ideological changes, so we would need to replace the party sorting view that parties cannot affect citizen ideology with its opposite – that parties have a very extensive effect on ideology that runs across the whole population. Either way, as has been pointed out in the American context, an account in which ideological signals from elites substantially shift citizens’ ideology provides a challenge to the whole spatial modeling framework (Carsey and Layman Reference Carsey and Layman2006).
Another possibility is that elite polarization is driven from the bottom up by ideological polarization and that parties are responding to these changes. This bottom-up account is usually taken to be the implication of ideological polarization arguments in the USA (Abramowitz Reference Abramowitz2010; Abramowitz Reference Abramowitz2013). Although we have not tested the mechanisms, we consider what could have led to such bottom-up ideological change in Britain by indicating a possible process. The declining size and organization of the manual working class and the increasing size of the salariat would be expected to weaken the group identities traditionally thought to be the most generative of redistributive ideology (Evans and Tilley Reference Evans and Tilley2017; Kitschelt Reference Kitschelt1993). In addition, the extended period of economic growth from the early 1990s reduced the salience of many of the trade-offs relating to redistributive ideology (increased welfare spending did not automatically imply increased taxation), further contributing to ideological depolarization (Clarke Reference Clarke2009). These economic trends reversed with the 2007–08 financial crisis, which sharply increased the salience of redistributive ideological trade-offs and may have also reoriented group identity dynamics (Whiteley et al. Reference Whiteley2013).
Thus if redistributive ideology emerges as conventionally described, out of group identities and material interests, where material interests are a stronger determinant in conditions of economic adversity, then there are reasons to expect the depolarization and repolarization patterns we have described in this article. If a bottom-up account is accepted, it would provide an explanation for prominent aspects of recent elite polarization dynamics in Britain which can be hard to explain from a top-down perspective. In particular, given Labour MPs' views of Jeremy Corbyn, it is difficult to see the leftward shift associated with his election as leader as a strategic move by party elites, rather than as a bottom-up process. Further research is needed to decide between the bottom-up and top-down possibilities. However, either case requires a substantially new account of elite polarization dynamics in Britain.
Our findings also have implications for understanding the dynamics of redistributive ideology beyond the observation that they are related to elite polarization. We demonstrated that substantial ideological change has taken place at the individual level. This challenges the standard model of individual-level stability in redistributive ideology (after it has been formed when young through socialization). This implies that, and indeed we have presented a case where, substantial changes in the ideological structure of society can occur without the generational replacement that is usually the specified mechanism of aggregate-level ideological change (Inglehart Reference Inglehart1997). Our demonstration that ideological change caused partisan depolarization in the post-Thatcher years also leaves a number of substantive arguments about British political dynamics in need of reassessment, in particular party sorting assumptions to the contrary play a central role in recent accounts of the decline of class voting (Evans and Tilley Reference Evans and Tilley2011, Reference Evans and Tilley2012, Reference Evans and Tilley2017).
In comparative terms, our findings also challenge the claim that ideological change is unlikely ever to be found in any case of elite polarization, which was taken to the comparative implication of finding ideological stability in the extreme case of depolarizing Britain. We do not suggest that there are general expectations in the opposite direction – that party system change will always be associated with ideological change and that partisan polarization will always be caused by ideological change more than partisanship change. However, closely related patterns of ideological change have been found in Holland and Germany (Adams, de Vries and Leitner Reference Adams, de Vries and Leitner2012; Munzert and Bauer Reference Munzert and Bauer2013). Understanding these patterns of ideological change in a comparative perspective therefore seems an important direction for future research.
Acknowledgements
We would like to thank James Tilley, Nick Vivyan, Stephen Welch, the North East Research Development Workshop and three anonymous reviewers for their comments and suggestions.
Supplementary material
Data replication sets are available in Harvard Dataverse at: https://doi.org/10.7910/DVN/OVLKN9 and online appendices at: https://doi.org/10.1017/S0007123419000486.


