


Introduction
The cultivated apple, Malus × domestica, belongs to the Rosaceae family, and the genus Malus is reported to consist of 25 to 30 species. Early studies based on morphological characteristics suggested that several Malus species, including M. sylvestris Miller, M. prunifolia (Willd.) Borkh., and M. baccata (L.) Borkh., were involved in the origin and/or domestication of the cultivated apple (Brown, Reference Brown, Janick and Moore1975). As Asian M. × asiatica, M. baccata, M. micromalus, M. orientalis, M. prunifolia and M. sieversii and European M. sylvestris are the species taxonomically closest to M. × domestica, they are considered to have contributed to the domestic gene pool to differing extents (Robinson et al., Reference Robinson, Harris and Juniper2001). A survey of molecular differences at 23 genes across the genus Malus supported the proposal that the M. × domestica gene pool was formed mainly from M. sieversii (Velasco et al., Reference Velasco, Zharkikh, Affourtit, Dhingra, Cestaro, Kalyanaraman, Fontana, Bhatnagar, Troggio, Pruss, Salvi, Pindo, Baldi, Castelletti, Cavaiuolo, Coppola, Costa, Cova, Dal Ri, Goremykin, Komjanc, Longhi, Magnago, Malacarne, Malnoy, Micheletti, Moretto, Perazzolli, Si-Ammour, Vezzulli, Zini, Eldredge, Fitzgerald, Gutin, Lanchbury, Macalma, Mitchell, Reid, Wardell, Kodira, Chen, Desany, Niazi, Palmer, Koepke, Jiwan, Schaeffer, Krishnan, Wu, Chu, King, Vick, Tao, Mraz, Stormo, Stromo, Bogden, Ederle, Stella, Vecchietti, Kater, Masiero, Lasserre, Lespinasse, Allan, Bus, Chagné, Crowhurst, Gleave, Lavezzo, Fawcett, Proost, Rouzé, Sterck, Toppo, Lazzari, Hellens, Durel, Gutin, Bumgarner, Gardiner, Skolnick, Egholm, Van de Peer, Salamini and Viola2010). However, when Harrison and Harrison (Reference Harrison and Harrison2011) re-analysed some of the polymorphism data from the Velasco et al. (Reference Velasco, Zharkikh, Affourtit, Dhingra, Cestaro, Kalyanaraman, Fontana, Bhatnagar, Troggio, Pruss, Salvi, Pindo, Baldi, Castelletti, Cavaiuolo, Coppola, Costa, Cova, Dal Ri, Goremykin, Komjanc, Longhi, Magnago, Malacarne, Malnoy, Micheletti, Moretto, Perazzolli, Si-Ammour, Vezzulli, Zini, Eldredge, Fitzgerald, Gutin, Lanchbury, Macalma, Mitchell, Reid, Wardell, Kodira, Chen, Desany, Niazi, Palmer, Koepke, Jiwan, Schaeffer, Krishnan, Wu, Chu, King, Vick, Tao, Mraz, Stormo, Stromo, Bogden, Ederle, Stella, Vecchietti, Kater, Masiero, Lasserre, Lespinasse, Allan, Bus, Chagné, Crowhurst, Gleave, Lavezzo, Fawcett, Proost, Rouzé, Sterck, Toppo, Lazzari, Hellens, Durel, Gutin, Bumgarner, Gardiner, Skolnick, Egholm, Van de Peer, Salamini and Viola2010) study, they concluded that gene flow from M. sylvestris to M. × domestica could not be ruled out, in line with previous suggestions (Harris et al., Reference Harris, Robinson and Juniper2002; Coart et al., Reference Coart, Van Glabeke, De Loose, Larsen and Roldan-Ruiz2006). The modern cultivated apple gene pool mimics an admixed population whereby an individual cultivar might have different degrees of genetic heritage from different Malus species.
Malus germplasm has been characterized in several ways, including taxonomic, morphological, and agronomic characterization (Chapman, Reference Chapman, Stalker and Chapman1989; Hilu, Reference Hilu, Stalker and Chapman1989), biochemical analysis (Doebley, Reference Doebley, Soltis and Soltis1989; Røen et al., Reference Røen, Ekholm and Rumpunen2009) and DNA marker-based analysis (Clegg, Reference Clegg, Brown, Clegg, Kahler and Weir1990; Dunemann et al., Reference Dunemann, Kahnau and Schmidt1994; Hokanson et al., Reference Hokanson, Szewc-McFadden, Lamboy and McFerson1998; Coart et al., Reference Coart, Van Glabeke, De Loose, Larsen and Roldan-Ruiz2006; Gharghani et al., Reference Gharghani, Zamani, Talaie, Oraguzie, Fatahi, Hajnajari, Wiedow and Gardiner2009; Van Treuren et al., Reference Van Treuren, Kemp, Ernsting, Jongejans, Houtman and Visser2010). The relationship between molecular and quantitative measures of genetic diversity is not always straightforward (Frankham, Reference Frankham1999). For example, from a survey of 29 species, McKay and Latta (Reference McKay and Latta2002) reported that population differentiation based on molecular markers [i.e. F st (Cockerham and Weir, 1993)] is poorly correlated with quantitative variation at the trait level [i.e. Q st (Spitze, Reference Spitze1993)]. No formal comparisons of F st and Q st have ever been reported for Malus species.
A recent study (Cornille et al., Reference Cornille, Gladieux, Smulders, Roldan-Ruiz, Laurens, Le Cam, Nersesyan, Clavel, Olonova, Feugey, Gabrielyan, Zhang, Tenaillon and Giraud2012) using 26 evenly distributed simple sequence repeat (SSR) markers has presented a detailed analysis of population structure in apple germplasm, but it has been suggested that the use of a large number of single nucleotide polymorphisms (SNPs) will outperform that of SSR markers for population structure analysis (Liu et al., Reference Liu, Chen, Wang, Oh and Zhao2005; Helyar et al., Reference Helyar, Hemmer-Hansen, Bekkevold, Taylor, Ogden, Limborg, Cariani, Maes, Diopere, Carvalho and Nielsen2011). We present here an application of the International RosBREED SNP Consortium (IRSC) apple 8K SNP array (Chagné et al., Reference Chagné, Crowhurst, Troggio, Davey, Gilmore, Lawley, Vanderzande, Hellens, Kumar, Cestaro, Velasco, Main, Rees, Iezzoni, Mockler, Wilhelm, van de Weg, Gardiner, Bassil and Peace2012) to investigate population structure, linkage disequilibrium (LD) and genetic differentiation in an apple germplasm collection comprising M. × domestica and M. sieversii individuals. To our knowledge, this is the first attempt made to directly compare trait-level differentiation and marker-level divergence between Malus species. We also tested the marker ‘neutrality’, which is a desirable feature of markers for species (or population) divergence studies, of our SNP array by conducting a genome-wide association analysis for various important apple fruit quality traits.
Materials and methods
Plant material and phenotypes
In an attempt to expand the Malus gene pool, open-pollinated (OP) seeds of nearly 500 apple cultivars and some wild species were imported from around the world and planted in New Zealand during the early 1990s (Noiton et al., Reference Noiton, Hofstee, Alspach, Brewer and Howard1999; Kumar et al., Reference Kumar, Volz, Alspach and Bus2010). From about 35,000 OP seedlings, a core subset of 350 seedlings were identified (using data on trees, fruits and disease resistance traits) to represent the diversity found within the entire collection. Apart from a few exceptions, only one seedling from each maternal family was kept for long-term conservation. All the 350 seedlings were then clonally propagated on to ‘M.27’ rootstock and two copies (or clones) of each genotype were planted in a common-garden experiment in 2003 in a Plant and Food Research orchard (39°C; 39′S 176°53′E) at Hawke's Bay Research Centre, New Zealand. For the present study, 115 of these 350 individuals were used, representing 99 and 16 individuals of M. × domestica and M. sieversii, respectively. The geographical origin of these 115 individuals, along with the name of their maternal parent, is given in Table S1 (available online). OP seeds of M. sieversii accessions were mainly collected from Kazakhstan, but those of M. × domestica were from different geographical regions including France, the Netherlands, Russia, Scandinavia, the UK and the USA (Table S1, available online).
Fruit harvesting, which was carried out in the fruiting season (February–May) in 2011, began when fruits were judged to be mature, based on a change in skin background colour from green to yellow, and when the starch pattern index was between 3 and 4 (Brookfield et al., Reference Brookfield, Murphy, Harker and MacRae1997). Fruits were harvested and analysed separately from both trees propagated from each original genotype. Samples of six fruits from each seedling were stored for 42 d at 0.5°C and then for a further 1 d at 20°C before evaluation. Phenotypic information on eight traits describing visual and sensory fruit properties was obtained. Detailed protocols for the assessment of a range of traits have been reported previously (Kumar et al., Reference Kumar, Volz, Alspach and Bus2010). Briefly, crispness (CRISP), juiciness (JUICE), flavour intensity (FINT), over-colour amount (OCOL) and russet coverage (RUS) were scored on a scale of 0 (none) to 9 (highest). Fruit weight (WT) was measured as the average weight (g) of six fruits from each seedling. Bulked juice from the cortical flesh of the sample fruit was used to measure titratable acidity (TA) using an automatic acid titrator (Metrohm 716 DMS, Herisau, Switzerland) and the percentage of malic acid in fruit juice was recorded. Soluble solid concentration (SSC) for each fruit was measured using a digital refractometer (Atago PR-32, Tokyo, Japan).
Trait-level differentiation
Estimates of variance among individuals within a species and between the two species were obtained for each trait using the following model:
 $$\mathbf{ y } = \mathbf{ Xb } + \mathbf{ Zp } + \mathbf{ W }\mathbf{ g }/\mathbf{ p } + \mathbf{ e }, $$
where
y
is a vector of observations on each seedling,
b
is a vector of fixed effects (i.e. overall mean, row effect),
p
is a vector of random effect of species,
g
/
p
is a vector of random effect of genotypes within a species and
e
is a vector of random residual terms.
X
,
Z
and
W
are the known incidence matrices relating the observations in
y
to effects in
b
,
p
and
g
/
p
, respectively. The variances associated with the random effects
p
,
g
/
p
and
e
were
 $$\sigma _{ B }^{2} $$
,
$$\sigma _{ B }^{2} $$
,
 $$\sigma _{ W }^{2} $$
and,
$$\sigma _{ W }^{2} $$
and,
 $$\sigma _{ e }^{2} $$
respectively. Equation (1) was implemented in the ASReml software (Gilmour et al., Reference Gilmour, Cullis, Harding and Thompson2006). We calculated estimates of broad-sense heritability (H
2) and Q
st (following Spitze, Reference Spitze1993) for each trait from the following:
$$\sigma _{ e }^{2} $$
respectively. Equation (1) was implemented in the ASReml software (Gilmour et al., Reference Gilmour, Cullis, Harding and Thompson2006). We calculated estimates of broad-sense heritability (H
2) and Q
st (following Spitze, Reference Spitze1993) for each trait from the following:
 $$ H ^{2} = \frac { \sigma _{ B }^{2} + \sigma _{ W }^{2}}{ \sigma _{ B }^{2} + \sigma _{ W }^{2} + \sigma _{ e }^{2}} $$
 $$ Q _{ st } = \frac { \sigma _{ B }^{2}}{ \sigma _{ B }^{2} + 2 \sigma _{ W }^{2}} $$
The approximate standard errors of H 2 and Q st were obtained using the delta method as implemented in the ASReml software.
SNP genotyping and quality control
Seedlings were genotyped using the IRSC apple 8K array v1 (Chagné et al., Reference Chagné, Crowhurst, Troggio, Davey, Gilmore, Lawley, Vanderzande, Hellens, Kumar, Cestaro, Velasco, Main, Rees, Iezzoni, Mockler, Wilhelm, van de Weg, Gardiner, Bassil and Peace2012), based on the Infinium® II technique. Genomic DNA (gDNA) was extracted from each seedling using the NucleoSpin® Plant II kit (Macherey-Nagel GmbH and Co KG, Düren, Germany) and quantified using the Quant-iT™ PicoGreen® Assay Kit (Invitrogen, Eugene, USA). For this reaction, 200 ng of gDNA were used as a template, following the manufacturer's instructions. SNP genotypes were scored using the Genotyping Module (version 1.8.4) of the Illumina® GenomeStudio software (Illumina, Inc., San Diego, USA). The reliability of each genotype call was measured using the GenCall score set at a minimum of 0.15, which is a lower bound for calling genotypes relative to its associated cluster. SNPs were subsequently discarded using a sequence of criteria in the following order: GenCall score at the 50% rank (50% GC) < 0.40, cluster separation (ClusterSep) < 0.25, more than 5% missing calls, and segregation discrepancy. The BEAGLE 3.1 software (Browning and Browning, Reference Browning and Browning2007) was then used for imputing missing SNP genotypes.
Population structure and LD
Population structure was investigated using the Bayesian clustering method implemented in STRUCTURE (Pritchard et al., Reference Pritchard, Stephens and Donnelly2000), which uses Markov chain Monte Carlo (MCMC) simulations to infer the proportion of ancestry of genotypes in K distinct predefined clusters. Ten independent runs were carried out, and we used 50,000 MCMC iterations after a burn-in of 5000 steps.
We calculated pairwise LD between SNPs to evaluate the extent of LD in apple germplasm. The degree of LD was quantified with the parameter r 2 (Hill and Robertson, Reference Hill and Robertson1968) obtained with and without taking into account the population structure and cryptic relatedness following the method of Mangin et al. (Reference Mangin, Siberchicot, Nicolas, Doligez, This and Cierco-Ayrolles2012). Estimates of coefficients of relationships (i.e. cryptic relatedness) among all the seedlings were calculated using SNP data following the method of Van Raden (Reference Van Raden2008). Estimates of r 2, accounting for population structure and cryptic relatedness, were obtained using the R software LDcorSV (Mangin et al., Reference Mangin, Siberchicot, Nicolas, Doligez, This and Cierco-Ayrolles2012).
Molecular-level differentiation
For evaluating molecular-level differentiation between the two species, F st value at each locus, and also across all the loci, was calculated following the method of Weir and Cockerham (Reference Weir and Cockerham1984). The significance of F st values was assessed using Fisher's exact tests implemented in GENEPOP 4.2 (Rousset, Reference Rousset2008). The significance of the minor allele frequency (MAF) difference between the species was compared using the Mann–Whitney U test.
Marker–trait association analysis
A mixed linear model approach (Yu et al., Reference Yu, Pressoir, Briggs, Vroh-Bi, Yamasaki, Doebley, McMullen, Gaut, Nielsen, Holland, Kresovich and Buckler2006) that accounts for multiple degrees of relatedness (population structure and cryptic relationships) was used:
 $$\mathbf{ y } = \mathbf{ X\beta } + \mathbf{ Za } + \mathbf{ e }, $$
where
y
is a vector of observations on seedlings, β is an unknown vector containing fixed effects, including a genetic marker, population structure (
Q
), and the intercept, and
X
is the known design matrix related to β.
Z
is the known design matrix related to
a
, the unknown vector of random additive genetic effects with
a
~N(0,
G
σ2
a). The realized relationship coefficient matrix (
G
) was derived using all the available SNPs following the method of Van Raden (Reference Van Raden2008). The scalar σ2
a is the additive variance and
e
is a vector of independent random deviates with variance
 $$\sigma _{ e }^{2} $$
. Equation (4) was fitted using the GAPIT software (Lipka et al., Reference Lipka, Tian, Wang, Peiffer, Li, Bradbury, Gore, Buckler and Zhang2012). To avoid spurious associations that could arise from population structure, we included principal components (PCs) as covariates (i.e.
Q
matrix). In equation (4), each SNP was tested in turn using a t test (H
0: no additive association between the SNP and the trait) and P values were obtained. A genome-wide significance threshold of α = 0.05 (which equates to a marker-wise threshold p= 1 × 10−
5 as we tested 3521 SNPs) was used to identify significant marker–trait associations for all traits.
$$\sigma _{ e }^{2} $$
. Equation (4) was fitted using the GAPIT software (Lipka et al., Reference Lipka, Tian, Wang, Peiffer, Li, Bradbury, Gore, Buckler and Zhang2012). To avoid spurious associations that could arise from population structure, we included principal components (PCs) as covariates (i.e.
Q
matrix). In equation (4), each SNP was tested in turn using a t test (H
0: no additive association between the SNP and the trait) and P values were obtained. A genome-wide significance threshold of α = 0.05 (which equates to a marker-wise threshold p= 1 × 10−
5 as we tested 3521 SNPs) was used to identify significant marker–trait associations for all traits.
Results
Trait-level differentiation
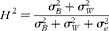
The percentage of total variance for a trait attributed to species differences varied from 13% for RUS to 51% for WT with an average of 33% (Table 1). Differences among individuals within a species accounted for a larger proportion of variation ranging from 36% for CRISP to 74% for RUS with an average of 53%. The degree of trait-level genetic differentiation (Q st) between the two species ranged widely from 0.08 for RUS to 0.40 for CRISP with an average of 0.21 (Table 1). Juiciness (JUICE) had the lowest (0.73) broad-sense heritability (H 2) and WT had the highest (0.95).
Table 1 Percentage of variance explained by different sources, quantitative trait-level differentiation (Q st) and broad-sense heritability (H 2) for different traitsa
CRISP, crispness; FINT, flavour intensity; JUICE, juiciness; OCOL, over-colour; RUS, russet; SSC, soluble solid concentration; TA, titratable acidity; WT, fruit weight.
a Approximate standard errors of Q st and H 2 estimates are given in parentheses.
SNP genotyping and molecular-level species differentiation
Following various SNP data quality filters, a set of 3521 SNPs with an average call rate of 98% was retained for further analyses. The MAF at these selected loci ranged from 0.01 to 0.50 with an average of 0.24. The retained SNPs were evenly spread across the apple genome; that is, the proportion (out of 3521) of SNPs on any given linkage group (LG) was generally similar to the relative size of that LG assuming the total genome size as 742 Mb. The accuracy of imputation using the BEAGLE software was high for a majority of SNPs; that is, the accuracy was >0.95 for 95% of the 3521 SNPs.
Of the 3521 SNPs, 3038 (86.3%) and 3518 (99.9%) SNPs were polymorphic in M. sieversii and M. × domestica, respectively. The median of the MAF was significantly lower in M. sieversii (0.13) than in M. × domestica (0.23). The observed and expected heterozygosity was 0.19 and 0.23, respectively, in M. sieversii and 0.35 and 0.35, respectively, in M. × domestica. The maximum expected heterozygosity that can be reached at a biallelic SNP is 0.5. The estimate of F IS value was higher in M. sieversii (0.19) than in M. × domestica (0.10), suggesting somewhat higher inbreeding in the former. Genetic differentiation between the two Malus species was determined by calculating pairwise F st at each SNP (Fig. 1). No differentiation (F st= 0) was observed for nearly 23% of the SNPs, but about 20% of the SNPs exhibited a high genetic differentiation (F st≥ 0.15). The average F st across all the SNPs was 0.12, which was highly significant (P< 0.001) as assessed by Fisher's exact test.

Fig. 1 Genome-wide distribution of F st values.
Population structure and LD
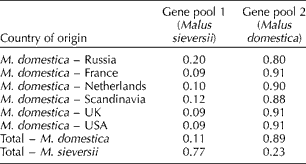
We used the ‘admixture model’ implemented in the STRUCTURE software to infer population structure and introgression (Fig. 2 and Table 2). A pairwise comparison assuming two clusters (i.e. K= 2) indicated that the average posterior probability of assignment of M. × domestica accessions to the M. sieversii gene pool was 11%, whereas the average probability for the reverse was 23% (Table 2). M. × domestica accessions from Russia displayed a relatively high degree of admixture (20%) with M. sieversii compared with other seed sources, for which the extent of admixture varied from 9 to 12% (Table 2).

Fig. 2 Model-based Bayesian clustering of 115 accessions of the two Malus species using the STRUCTURE software. Each accession's genome is represented by a single vertical line, which is partitioned into coloured segments in proportion to the estimated membership of a species. Results shown are for varying numbers of clusters (i.e. K= 2 or 3), so the y-axis indicates the posterior probability for assignment to different species or clusters. Black vertical lines separate individuals of different geographical origin or country of origin.
Table 2 Proportions of estimated membership (using ‘admixture’ model in STRUCTURE) to each of the two inferred gene pools for accessions of different origins
The ΔK statistic, designed to identify the most relevant number of clusters by determining the number of clusters beyond which there is no further increase in likelihood, was greatest for K= 3 (ΔK= 3897, Pr|ln L= − 386566). For K= 3, the mean estimated membership of M. × domestica individuals to the three gene pools, namely M. × domestica, M. sieversii and an unknown, was 0.68, 0.06 and 0.26%, respectively (Fig. 2). Assuming that M. × domestica individuals with membership probability ≥ 0.20 (an arbitrary threshold; Cornille et al., Reference Cornille, Gladieux, Smulders, Roldan-Ruiz, Laurens, Le Cam, Nersesyan, Clavel, Olonova, Feugey, Gabrielyan, Zhang, Tenaillon and Giraud2012) of a non-domestica gene pool displayed introgression, it was inferred from the results that 10 and 38% of the accessions displayed introgression from M. sieversii and an unknown gene pool, respectively. About 9% of the M. × domestica accessions displayed introgression from M. sieversii as well as from an unknown gene pool.
The pattern of LD decay was somewhat different for the two species. Compared with that in M. × domestica, LD in M. sieversii was lower at short distances, but higher at long distances (Fig. 3(a)). The results of the combined analysis revealed a moderate degree of LD at various distances between the markers; for example, the average r 2 for SNPs separated by 0.1 Mb, 0.5 Mb (approximately 1 cM in apple) and 1.0 Mb was 0.13, 0.08 and 0.06, respectively (Fig. 3(b)). LD was slightly lower after adjusting for population structure, but the pattern of LD decay was quite similar to that without accounting for structure.

Fig. 3 Patterns of linkage disequilibrium (LD: r 2) in two Malus species separately (a) and a combined LD pattern with and without making adjustment for population structure (b).
Genome-wide SNP–trait associations
The numbers of PCs, which constitute the Q matrix to account for population structure, varied between the traits: OCOL = 0; SSC = 1; CRISP = 2; WT and TA = 3; and FINT, JUICE, and RUS = 4. The profiles of P values, in terms of − log 10(p), for all the tested SNPs for each trait are shown in Fig. 4. Clustering of significant SNPs for OCOL (on LG9) and TA (on LG16) suggested the presence of large-effect quantitative trait locus (QTLs) at these positions. The largest-effect SNP (ss475879551), explaining 23% variation in OCOL, is located at a distance of 0.11 Mb from the MdMYB10 gene (MDP0000259616) known for its causal effect on Type 1 red flesh in apple fruits (Chagné et al., Reference Chagné, Carlisle, Blond, Volz, Whitworth, Oraguzie, Crowhurst, Allan, Espley, Hellens and Gardiner2007; Espley et al., Reference Espley, Hellens, Putterill, Stevenson, Kutty-Amma and Allan2007) and is also a key regulator of red skin colour (Lin-Wang et al., Reference Lin-Wang, Micheletti, Palmer, Volz, Lozano, Espley, Hellens, Chagne, Rowan, Troggio, Iglesias and Allan2011). The SNP (ss475881697) with the largest effect (i.e. explaining 8% variation) on TA resides within the leucoanthocyanidin reductase (LAR1) gene (MDP0000376284) and the next-best SNPs (ss475881686 and GDsnp01588) are located close to the Ma gene (Xu et al., Reference Xu, Wang and Brown2012; Khan et al., Reference Khan, Beekwilder, Schaart, Mumm, Soriano, Jacobsen and Schouten2013). The frequency of the minor allele at the largest-effect SNP for OCOL and TA was 0.36 and 0.17, respectively, suggesting that the observed marker–trait association is less likely to be biased by the MAF at these SNP loci.

Fig. 4 Manhattan plots of the − log10(p) values for various apple fruit traits (CRISP, crispness; SSC, soluble solid concentration; FINT, flavour intensity; JUICE, juiciness; OCOL, over-colour; RUS, russet; TA, titratable acidity; and WT, fruit weight) from a genome-wide scan against position on each of 17 linkage groups (represented by different colours). Grey horizontal line indicates the genome-wide significance threshold.
Discussion
Qst and Fst
Even though molecular marker-based methods have become cheaper and faster to assist rapid decision-making in conservation projects, an understanding of locally adaptive between-population and within-population genetic variation is likely to be of greater importance when choosing populations/genotypes for genetic conservation. Thus, Q st will be particularly relevant to conservation efforts where preserving extant adaptation to local environments is an important goal. Q st varies widely among traits, and the traits that experience the strongest local selection (or adaptation) pressures are expected to be the most divergent (McKay and Latta, Reference McKay and Latta2002). The traits considered in the present study could perhaps be of low relevance from a natural adaptation point of view, but these are certainly desirable for commercial breeding purposes. In this study, Q st was highest for CRISP, followed by WT and FINT, suggesting that these traits could have experienced strongest selection pressure among the studied traits.
The estimated F st value between M. sieversii and M. × domestica in the study was 0.12, which is similar to that reported in an earlier report using SNPs (F st= 0.14; Velasco et al., Reference Velasco, Zharkikh, Affourtit, Dhingra, Cestaro, Kalyanaraman, Fontana, Bhatnagar, Troggio, Pruss, Salvi, Pindo, Baldi, Castelletti, Cavaiuolo, Coppola, Costa, Cova, Dal Ri, Goremykin, Komjanc, Longhi, Magnago, Malacarne, Malnoy, Micheletti, Moretto, Perazzolli, Si-Ammour, Vezzulli, Zini, Eldredge, Fitzgerald, Gutin, Lanchbury, Macalma, Mitchell, Reid, Wardell, Kodira, Chen, Desany, Niazi, Palmer, Koepke, Jiwan, Schaeffer, Krishnan, Wu, Chu, King, Vick, Tao, Mraz, Stormo, Stromo, Bogden, Ederle, Stella, Vecchietti, Kater, Masiero, Lasserre, Lespinasse, Allan, Bus, Chagné, Crowhurst, Gleave, Lavezzo, Fawcett, Proost, Rouzé, Sterck, Toppo, Lazzari, Hellens, Durel, Gutin, Bumgarner, Gardiner, Skolnick, Egholm, Van de Peer, Salamini and Viola2010). There are not many SNP-based population genetics studies reported for Malus species. SSR-based studies have reported somewhat lower F st values (F st= 0.09, Coart et al., Reference Coart, Van Glabeke, De Loose, Larsen and Roldan-Ruiz2006; and F st= 0.06, Cornille et al., Reference Cornille, Gladieux, Smulders, Roldan-Ruiz, Laurens, Le Cam, Nersesyan, Clavel, Olonova, Feugey, Gabrielyan, Zhang, Tenaillon and Giraud2012) than SNP-based studies. Differing mutation rates and heterozygosity levels between SSRs and SNPs raise the question of how to compare diversity estimates derived from different marker systems. Nonetheless, studies comparing F st estimates using different marker systems seem to report generally comparable values (Allendorf and Seeb, Reference Allendorf and Seeb2000, and references therein). Ritland (Reference Ritland2000) recommended that F st and Q st comparisons be preferably carried out by employing less mutable loci than microsatellites. Mutation rates are in general considerably lower for SNPs than for microsatellites (Foll and Gaggiotti, Reference Foll and Gaggiotti2008), and also SNPs are increasingly preferred over other marker systems (e.g. microsatellites) for population genetics studies for various reasons, including the availability of high numbers of annotated markers, low scoring error rates, and the potential for high-throughput genotyping (Helyar et al., Reference Helyar, Hemmer-Hansen, Bekkevold, Taylor, Ogden, Limborg, Cariani, Maes, Diopere, Carvalho and Nielsen2011).
Differences in sampling intensity (16 and 99 individuals from M. sieversii and M. × domestica, respectively) could bias comparison between species, so further investigation is needed using larger sample sizes to evaluate SNP-based population differentiation and Q st and F st comparison in Malus species. However, it is important to note that the level of polymorphism affects the relationship between sample size and accuracy of parameter estimates (allele frequency, allelic richness, etc.). Estimation is less biased by differences in sample size for loci with low polymorphism than for those with high polymorphism. Thus, unequal sample size will probably bias estimates using SNP markers less than those using microsatellites (Leberg, Reference Leberg2002).
The statistical evidence for selection and local adaptation is provided by comparing the distribution of F st with that of Q st. Under pure neutrality, and if the traits are additive, Q st= F st for any trait, and departures from this neutral expectation are considered to be evidence for selection acting on the quantitative trait under study (Spitze, Reference Spitze1993; Whitlock, Reference Whitlock1999; Merilä and Crnokrak, Reference Merilä and Crnokrak2001; McKay and Latta, Reference McKay and Latta2002). Traits (e.g. CRISP, WT, FINT and TA) with Q st>F st indicated that directional selection favouring these phenotypes could have been involved in the domesticated apple (M. × domestica). For some traits (e.g. JUICE, SSC and OCOL) in the present study, Q st values were very similar to F st values, suggesting that the observed degree of differentiation between the two species could have been obtained by genetic drift alone. We observed Q st< F st for only one trait (RUS), which could perhaps suggest that the domestication of apple did not necessarily favour selection on RUS differently from the natural evolution of this trait in M. sieversii. Nonetheless, genes, markers and traits will each behave differently in the adaptive divergence of populations, and thus extrapolation from one type of variation to another must be done with caution (McKay and Latta, Reference McKay and Latta2002).
We obtained genetic variation within a species (
 $$\sigma _{ W }^{2} $$
) by clonally replicating each accession; hence, the estimates are partly confounded by non-additive genetic variances, which could result in conservative estimates of Q
st (Lynch and Walsh, Reference Lynch and Walsh1998; Merilä and Crnokrak, Reference Merilä and Crnokrak2001). Thus, our estimates of Q
st are likely to represent lower bounds and could be conservative with respect to finding evidence for species differentiation.
$$\sigma _{ W }^{2} $$
) by clonally replicating each accession; hence, the estimates are partly confounded by non-additive genetic variances, which could result in conservative estimates of Q
st (Lynch and Walsh, Reference Lynch and Walsh1998; Merilä and Crnokrak, Reference Merilä and Crnokrak2001). Thus, our estimates of Q
st are likely to represent lower bounds and could be conservative with respect to finding evidence for species differentiation.
Population structure
Our results revealed possible introgression of genetic material into M. sieversii from M. × domestica and vice versa. The average posterior probability of assignment of M. sieversii accessions to the M. × domestica gene pool was 23%, which is almost identical to that reported earlier by Cornille et al. (Reference Cornille, Gladieux, Smulders, Roldan-Ruiz, Laurens, Le Cam, Nersesyan, Clavel, Olonova, Feugey, Gabrielyan, Zhang, Tenaillon and Giraud2012). The percentage of admixed ancestry of the M. × domestica gene pool in the M. sieversii gene pool was 11%, which supports earlier reports (Coart et al., Reference Coart, Van Glabeke, De Loose, Larsen and Roldan-Ruiz2006; Velasco et al., Reference Velasco, Zharkikh, Affourtit, Dhingra, Cestaro, Kalyanaraman, Fontana, Bhatnagar, Troggio, Pruss, Salvi, Pindo, Baldi, Castelletti, Cavaiuolo, Coppola, Costa, Cova, Dal Ri, Goremykin, Komjanc, Longhi, Magnago, Malacarne, Malnoy, Micheletti, Moretto, Perazzolli, Si-Ammour, Vezzulli, Zini, Eldredge, Fitzgerald, Gutin, Lanchbury, Macalma, Mitchell, Reid, Wardell, Kodira, Chen, Desany, Niazi, Palmer, Koepke, Jiwan, Schaeffer, Krishnan, Wu, Chu, King, Vick, Tao, Mraz, Stormo, Stromo, Bogden, Ederle, Stella, Vecchietti, Kater, Masiero, Lasserre, Lespinasse, Allan, Bus, Chagné, Crowhurst, Gleave, Lavezzo, Fawcett, Proost, Rouzé, Sterck, Toppo, Lazzari, Hellens, Durel, Gutin, Bumgarner, Gardiner, Skolnick, Egholm, Van de Peer, Salamini and Viola2010; Cornille et al., Reference Cornille, Gladieux, Smulders, Roldan-Ruiz, Laurens, Le Cam, Nersesyan, Clavel, Olonova, Feugey, Gabrielyan, Zhang, Tenaillon and Giraud2012) of M. sieversii being one of the progenitor species. When three clusters (i.e. M. × domestica, M. sieversii and an ‘unknown’) were considered, the ‘unknown’ gene pool was found to contribute about 26% to the genome of the M. × domestica gene pool. We hypothesized this ‘unknown’ gene pool to be M. sylvestris, but it is difficult to say whether this estimated 26% introgression is indeed from M. sylvestris alone or from a mix of some other species, as M. sylvestris accessions were not included in the present study. A study carried out by Cornille et al. (Reference Cornille, Gladieux, Smulders, Roldan-Ruiz, Laurens, Le Cam, Nersesyan, Clavel, Olonova, Feugey, Gabrielyan, Zhang, Tenaillon and Giraud2012), which included all the three species (M. × domestica, M. sieversii and M. sylvestris), reported that the contribution of M. sylvestris to the M. × domestica gene pool was about 16%, which lends support to our hypothesis.
The SNP-derived average pairwise coefficient of relationship (0.55) among the M. sieversii accessions was higher than that among the M. × domestica accessions (0.21). The estimated F IS value, which is a measure of inbreeding, was also higher for M. sieversii than for M. × domestica. M. × domestica individuals used in this study were derived from OP seeds collected from germplasm repositories. OP seedlings from wider crossing, especially when accessions of different Malus species are planted in proximity, could result in higher genetic variation than those from a population comprising named cultivars (Kumar et al., Reference Kumar, Volz, Alspach and Bus2010). Each of the 16 M. sieversii accessions represented a different maternal family, whereas there were a couple of accessions (out of 99) of M. × domestica derived from the same maternal family. A likely involvement of common pollen parents (especially in insect-pollinated species) or reciprocal pollination could result in higher observed relatedness than expected. In addition to the smaller sample size (16 vs. 99), another reason for the observed relatively low molecular variation in M. sieversii accessions could be the ascertainment bias (Helyar et al., Reference Helyar, Hemmer-Hansen, Bekkevold, Taylor, Ogden, Limborg, Cariani, Maes, Diopere, Carvalho and Nielsen2011), because the panel of 27 accessions used for designing the 8K SNP array involved only one M. sieversii accession. Our results indicated that the median MAF was lower in M. sieversii than in M. × domestica, suggesting some ascertainment bias. Still, the likelihood of transferability of M. × domestica SNPs to M. sieversii has been reported to be high (Micheletti et al., Reference Micheletti, Troggio, Zharkikh, Costa, Malnoy, Velasco and Salvi2011). Interestingly, there were three SNPs, namely ss475883988 (LG6), MDP0000215722 (LG8) and ss475883982 (LG12), found to be polymorphic only in M. sieversii, suggesting that alleles at these loci are perhaps fixed in M. × domestica accessions.
OP seeds of M. sieversii were collected from their natural habitat in Kazakhstan. The reported introgression (Coart et al., Reference Coart, Van Glabeke, De Loose, Larsen and Roldan-Ruiz2006; Larsen et al., Reference Larsen, Asmussen, Coart, Olrik and Kjaer2006; Cornille et al., Reference Cornille, Gladieux, Smulders, Roldan-Ruiz, Laurens, Le Cam, Nersesyan, Clavel, Olonova, Feugey, Gabrielyan, Zhang, Tenaillon and Giraud2012) from the domesticated apple to its wild progenitors (M. sieversii and M. sylvestris), which is supported by the results of this study, suggests that for gene conservation purposes, it is desirable to utilize molecular and phenotypic data to identify hybrids and/or misclassified individuals (Gross et al., Reference Gross, Henk, Forsline, Richards and Volk2012).
LD and marker–trait association
A high degree of LD is a desirable feature for reliable marker–trait associations in genome-wide association studies (GWAS) and also for higher accuracy of genomic selection. However, an assumption of no LD between markers is common to various methods of estimating population genetics parameters (e.g. F st). Although the STRUCTURE analysis assumes that SNP loci are independent within the study population, this assumption would not have been grossly violated because the pattern of LD in the present study indicated enough independence across the genome (Fig. 3(a) and (b)). Relatively higher long-distance LD in M. sieversii than in M. domestica could be due to high genetic relatedness among the M. sieversii accessions as discussed earlier. LD structure could vary among different types of plant populations within a species (reviewed by Myles et al., Reference Myles, Peiffer, Brown, Ersoz, Zhang, Costich and Buckler2009). For a given distance between markers, the extent of LD in our germplasm accessions (Fig. 3) was far less (about one-third) than that reported in advanced-generation crosses (Kumar et al., Reference Kumar, Chagné, Bink, Volz, Whitworth and Charmaine2012, Reference Kumar, Garrick, Bink, Whitworth, Chagné and Volz2013).
Inclusion of SNPs that are tightly linked to genes (or regions under selection) could violate the assumption of marker neutrality, hence resulting in misleading inferences about population differentiation and genetic structure (Nielsen et al., Reference Nielsen, Hansen and Meldrup2006). However, a recent review (Kirk and Freeland, Reference Kirk and Freeland2011) has advocated the use of non-neutral SNPs or causative markers, which could be associated with phenotype, for better understanding of adaptive evolution and population differentiation. A couple of highly significant SNP–trait associations were identified for OCOL and TA in the present study, but the most significant SNPs are probably not the causative ones due to low-to-moderate LD. Moreover, the estimated F st value at two of the most significant SNPs (ss475879551 on LG9 and ss475881697 on LG16) was 0.12 and 0.09, respectively, so these SNPs were not outliers as per the observed F st distribution (Fig. 1). A lack of strong marker–trait associations for most of the studied traits indicated that the SNP array used in this study comprised mainly neutral markers, so our inferences on admixture and population structure of Malus accessions would not be biased. The population structure and admixed proportions of M. sieversii and M. × domestica accessions in the present study are quite comparable to those obtained using neutral as well as independent SSR markers (Cornille et al., Reference Cornille, Gladieux, Smulders, Roldan-Ruiz, Laurens, Le Cam, Nersesyan, Clavel, Olonova, Feugey, Gabrielyan, Zhang, Tenaillon and Giraud2012), suggesting that including a small number of SNPs in LD analysis is not likely to bias the estimates of population differentiation (e.g. Kaeuffer et al., Reference Kaeuffer, Reale, Coltman and Pontier2007). The M. sieversii gene pool has shown significant resistance to apple scab and fire blight (Luby et al., Reference Luby, Alspach, Bus and Oraguzie2002; Forsline and Aldwinckle, Reference Forsline and Aldwinckle2004) and may well hold genes that allow M. sieversii to adapt to cold and dry regions (Yan et al., Reference Yan, Long, Song and Chen2008). Finding marker–trait associations (that can be used in cultivar breeding programmes) in largely unrelated individuals such as germplasm collections will require higher SNP density, compared with that used in this study, due to faster LD decay in such populations.
Conclusions
Trait-level differentiation (Q st) for three of the eight studied traits (crispness, flavour intensity and fruit weight) was more than twice the molecular-level differentiation (F st), suggesting a differential selection and/or adaptation divergence for these traits in M. × domestica. These differences between Q st and F st suggest that both marker-level and trait-level information should be considered to construct ‘core’ populations for gene conservation purposes. The observed percentage of admixed ancestry (11%) of the M. × domestica gene pool in the M. sieversii gene pool further supports the hypothesis that the latter is one of the progenitors of the domesticated apple.
Supplementary material
To view supplementary material for this article, please visit http://dx.doi.org/10.1017/S1479262114000136
Acknowledgements
This study was partly funded by the New Zealand Ministry of Business, Innovation and Employment (MBIE) through a Core Funding programme. The authors sincerely thank their French colleagues (Francois Laurens and Amandine Cornille) and Plant and Food Research (PFR) colleagues (Richard Volz and Claudia Wiedow) for helpful suggestions and feedback.


