Introduction
Despite characterising land sector corruption around the world as pervasive, Transparency International (TI) writes that “[p]olitical [land] corruption can be extremely hard to document and effectively prosecute” (2011, 4). Political corruption in the land sector aims for public control of a country’s land resources for private gain. Opportunities for this kind of corruption emerge from the privatisation or leasing of state-owned land, zoning limits and construction permits, the expropriation of private land for government-related projects, and the negotiation of large-scale land acquisitions by investors. The difference between political land corruption and other forms of land corruption, like administrative land corruption, which operates at low administrative levels, is that while individuals at all levels can be involved in land corruption, its roots lie with elites in the public and private sector (TI 2011).
Broader weaknesses in governance that affect the transparency, accountability and independence of institutions enable political corruption in the land sector. Illegal actions by elected politicians or private persons can go unpunished because elites have “captured” key national institutions (TI 2011). It is also possible that institutions governing the land sector are established deliberately to create opportunities for corruption, as in the “toll booth” theory of corruption (Djankov et al. 2002). Finding which channel matters more, and gauging the true extent of political corruption in the land sector, has evaded researchers due to the unavailability of data.
In this article, we provide new evidence on political land corruption. Our context is Malta, the European Union’s smallest member state, one of the world’s most densely populated countries, and home to de jure highly restrictive zoning laws. Maltese zoning laws classify most of the country as an “outside development zone” (ODZ) in which a limited range of development – mainly, but not always agricultural – is permitted. ODZ policy provides two testable implications for the study of political land corruption.
First, ODZ policy makes a valuable investment out of ODZ land. As this policy lowers the initial price of ODZ land, it raises its potential return. The return is realised if the de jure independent regulator, the Malta Environment and Planning Authority (MEPA), grants a permit for its development. This brings us to the first testable hypothesis (Hypothesis 1):
H1: The speculative demand for ODZ permits increases in times of appreciating non-ODZ land values.
Actors, observing appreciating non-ODZ land values, turn to ODZ land for the best potential return. While actors run the risk of MEPA not granting a development permit, the policy has depressed the land’s initial price considerably, changing the risk-reward proposition. Consistent with Hypothesis 1, we show that the number of ODZ permit applications filed is positively correlated with the expected return to housing – for which ODZ development permission is de jure highly unlikely.
This brings us to the second testable hypothesis (Hypothesis 2):
H2: The leniency of the ODZ permit process also increases in times of appreciating non-ODZ land values.
Recognising the value of ODZ permits to the private sector, particularly during episodes of land price appreciation, political actors see an opportunity for corruption. Maltese general elections are usually won on close margins by either of the two main political parties, each having their client groups as in many other Mediterranean societies (Christopoulos Reference Christopoulos1998; Mitchell Reference Mitchell2002). Election campaigns are intense and fiercely fought. The absence of political party financing laws allows for undeclared donations to political parties, which contributes to the public perception that large-scale land development permits are granted or promised in exchange for party financing [European Commission (EC) 2014, 8]. We provide evidence that is consistent with this hypothesis. First, the acceptance ratio of ODZ permits rises dramatically during elections, as do the instances of MEPA’s Board granting permits against the recommendations of its own case officers (the “reversal ratio”). Second, the reversal ratio is significantly correlated with expected returns to housing. Altogether, these findings imply that MEPA is not as independent from the government as it needs to be, within a culture of clientelism and political patronage, to objectively make land use policy.
Underlying our analysis is a unique data set on every ODZ application ever filed. The data set itself is an important contribution to the debate on development planning in Malta, which is heated but evidence-scarce.Footnote 1 Most commentators are limited to occasional parliamentary questions or audit reports.Footnote 2 Our first freedom of information request for the data was rejected, and the second ignored.Footnote 3 Instead we “scraped” the data off MEPA’s website – that is, we wrote specific software to extract MEPA website information – allowing us to conduct the first empirical analysis of this policy since its implementation in 1993.Footnote 4 The data set is large in scale and scope, and provides ample opportunity for further work. We see this article as contributing to the literature on the data-intensive analysis of the public sector and public policy (Gorodnichenko and Peter Reference Lederman, Loayza and Soares2007; Caruana-Galizia and Caruana-Galizia Reference Caruana-Galizia and Caruana-Galizia2016) as well as the literature on “forensic economics”, in which researchers aim to understand “behavior that agents would prefer to conceal” (Zitzewitz Reference Zitzewitz2012, 731).
The findings we tease out of this data set can link two important facts for Malta – a high number of ODZ permit applications and a high approval ratio, both of which are correlated with the electoral cycle – and have wider implications for the institutional design of environment and planning authorities.
As with most environment and planning authorities, MEPA has monopoly over the supply of a resource that cannot be easily substitutedFootnote 5 – developable land – and which cannot be provided by the black market, as it is highly visible. If such a planning authority is independent from government, this situation can raise the “shadow” price (application fee plus bribe) of development permits, creating incentives for bribe taking within the authority. If it is not independent from government, the authority can act as an instrument for the government to extract rents from the private sector. In most cases, this takes the form of bribes going directly to the central government via the authority. In the case we examine here, which is relatively neglected in the literature, the transaction appears to be one of permits for political support. These two situations are akin to Aidt’s (Reference Aidt2003, 633) distinction between “corruption with a benevolent principal”, where a benevolent government delegates decision-making power to a nonbenevolent agent, and “corruption with a nonbenevolent principal”, where government officials intentionally introduce inefficient policies to extract rents. Our empirical evidence, running from 1993 to March 2016, fits a modified version of Aidt’s (Reference Aidt2003) second type of corruption, which we elaborate on in the conclusion, and fits with the long-running political science literature on the importance of political institutions in determining corruption (Alt and Lassen Reference Alt and Lassen2003; Lederman et al. 2005). We conclude this article with the policy implications of this institutional set up in a culture of clientelism. These policy implications have grown more pressing.
Shortly after concluding this research, the Maltese government in April 2016 brought into effect a law that split MEPA into two de jure autonomous and independent authorities. The Planning Authority is responsible for development planning, whereas the Environment and Resources Authority is responsible for environmental protection. Both were planned to be independent from government, and each other, checking one another’s activities. However, the government appoints the Environment and Resources Authority’s chairperson and director. Furthermore, the Authority is only able to claim two out of seven of the Planning Authority’s executive council. The Council, made up of government appointees, is the body that decides on land use policy, whereas development permits are decided by the planning board. Through relegating environmental protection, and through the increased power and presence of government appointees, the April 2016 reforms have broadened the scope for political corruption in the land sector, just as new major real estate deals were being negotiated.Footnote 6
Background
At 315 km2, Malta is the European Union’s smallest member state, and has the sixth highest population density in the world, at 1,323 persons/km2 (World Bank 2015). Most Maltese land – some 79.3% – is officially classified as ODZ [Malta Ministry for Sustainability, Development, the Environment and Climate Change (MSDECC) 2013, 346].
The ODZ boundaries, the roots of which lay in a 1990 official policy document, were designed to “channel urban development activity into existing and planned development areas … resulting in higher density development than at present” [Malta Ministry for Development of Infrastructure (MDI) 1990, 13].Footnote 7 The idea was to “to preserve and enhance the environmental quality of the countryside” (Malta MDI 1990, 41). As such, the policy document only allows for a limited range of development within the ODZ: “farmhouses and other genuine agricultural buildings, reservoirs, picnic area toilets and car parks, and control buildings and walls/fences at archaeological and ecological sites” (Malta MDI 1990, 41). Important changes were made to the ODZ boundaries since their establishment. In 2005, the total ODZ area was reduced by around 92,500 million m2 and reduced by another 2.3 million m2 in 2006 (Television Malta 2015). There have been no changes to the ODZ boundaries since 2006, but the original policy was modified in MEPA reports issued in 1995 (allowances for tourism-related development and minor extensions of rural buildings), in 2000 (restricts private swimming pools) and in 2008 (conversion or updating of existing agricultural properties) (MEPA 1995, 2000, 2008a). The latest update to ODZ policy was in 2014. It made allowances for upscale agricultural and agrotourism developments, like boutique wineries, and a wider variety of rural-building conversions (MEPA 2014).
Throughout the years, the spirit behind ODZ policy has always been to prevent the destruction of Malta’s biodiversity by urban sprawl, but interpretations of its letter and the extent to which it was enforced have varied over time. Reports issued by MEPA in 2005 and 2008 argued that the conservation of the ODZ area is under threat through both illegal and irregular activities (MEPA 2008b [2005]). Consequently, in 2010 MEPA adopted a zero-tolerance approach to irregularities within the ODZ. It established the Enforcement Directorate to pursue this approach. The Directorate is charged with ensuring that the “organisation’s decision-making process is being faithfully translated into practice, as well as the ability to take remedial action against defaulters in an effective and exemplary manner” (MEPA 2009). The ODZ Unit within MEPA’s Enforcement Directorate expends most of its resources on assessing the integrity of planning applications, as well as verifying and acting on complaints related to developments in the ODZ (Malta National Audit Office 2013, 17). While irregularities persist in spite of this improved capacity for enforcement, it is more the official issuance of ODZ permits that is a cause for concern. Land development and ODZ boundaries are highly visible, which limits irregular activity, and makes an official stamp necessary.
The 2014 EU Anti-Corruption Report noted how in Malta the “granting of planning permits, particularly to developers for large-scale projects has given rise to contention and controversy” (EC 2014, 8). The 2013 Eurobarometer survey showed that 53% of Maltese respondents think corruption is widespread among officials issuing building permits (MEPA officials), which is the highest percentage recorded for Malta’s public institutions (quoted in EC 2014, 8).
The absence of political party financing laws allows donations to political parties to go undeclared, encouraging the perception that large-scale permits are not granted objectively (EC 2014, 8). Findings by MEPA’s own auditor in relation to certain high-profile MEPA decisions on ODZ permits support the public’s perception.Footnote 8
It is important to note that rather “than outright bribery of MEPA officials, corruption allegations tend to consist of other irregularities in the decision-making process” (EC 2014, 8). In fact, there is only one known case where a MEPA official allegedly solicited a bribe – in exchange for issuing a compliance certificate (EC 2014, 8). This single case of alleged bribery does not imply MEPA is free from corruption, that official reports and public perception are wrong, but implies that corruption there takes a form similar to Aidt’s (Reference Aidt2003) “corruption with a nonbenevolent principal”. In this type of corruption, governments create de facto nonindependent authorities like MEPA as rent-collection instruments. This is consistent with a media investigation, confirmed by MEPA’s former auditor, which revealed MEPA’s Development Control Commission processed an unusually large number of cases in the last week before the 2008 general election (three times larger than the same period the year before), and that in 49 of the 430 cases the Commission granted a permit against the case officers’ recommendations (EC 2014, 8).
Evidence abounds that this activity has continued past the 2013 general election, which saw a change of the party in government. An incumbent party can issue permits before an election, whereas a competing party can promise to issue permits after an election. Although the post-2013 government claims to have maintained the integrity of the ODZ, our data show a surge in the ratio of approved to granted ODZ permits after the election, when it normally drops if the incumbent party wins.Footnote 9 It is to these quantitative patterns of ODZ activity that we now turn.
Data
MEPA maintains a public website that allows people to view development applications for a given local council by selecting its name from a list. Each application is listed in a table on a results page along with a unique alphanumerical “case number” that functions as an identifier, a category name which specifies whether the development is outside or inside development zones, and a link to view more data on the application. This function allowed us to see prima facie evidence that many ODZ applications were being granted. With our academic interest piqued by this phenomenon we set out to collect the data that would allow us to investigate an initial hypothesis.
Our first freedom of information request was submitted on 13 April 2015, and was formally acknowledged on the same day. It was rejected a week later (on 20 April) on the grounds that the data were unavailable in the requested format. A second freedom of information request was submitted a day after the rejection of the first, on 21 April. A MEPA employee informally acknowledged receiving the request by email but no formal acknowledgement was received. A follow-up email was sent on 17 May 2015, but this was ignored.
The pages listing applications on the MEPA website are delivered as Hypertext Markup Language (HTML) documents. This format differs from others like PDF or Microsoft Word documents in that it is a structured data format, with a separation of content and style. This means that the data points contained within the document are – in theory, though not always in practice – encapsulated by logical, easily identifiable tags that make it straightforward for the important data to be extracted and loaded into a database by a computer program. Even though it is possible for a person to manually copy each of the applications into a spreadsheet or database, this process would take many years and would have to be repeated when new applications are published, as the listings are not sorted in any logical way. Instead, we opted to perform Web scraping, which is the process of rapidly and automatically extracting information from Web pages.
Our scraper consists of a JavaScript application that is capable of being run on any low-end desktop computer, with two possible commands: download and ETL.Footnote 10 The first command mimics a human who is viewing each of the circa 151,000 applications on the MEPA site in rapid succession, while saving the HTML content of every application’s details page to the computer’s own disk, resulting in around 4.1 gigabytes of data being stored at the time of writing. The second command stands for extract, transform and load – a database engineering paradigm that represents the three steps involved in turning source data into a target database. When this command is run, the application iterates over each of the downloaded HTML files, parses the document using an open-source software library called jsdom, extracts each of the data points into a structure in memory, transforms the data into a standard format – by removing extraneous spaces and normalising dates, for example – and loads it into a MySQL database. From there, the data are channelled into a statistics package, where it can be worked with.
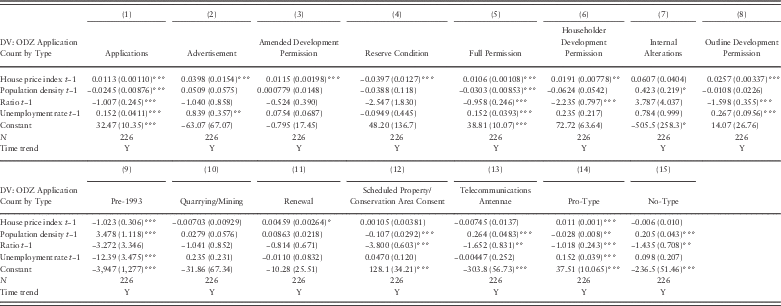
Table 1 gives an overview of the data with which we have worked. Column 1 sums the number of ODZ applications filed by year. Considering these are applications for developments in the ODZ, the sum of all applications is large: 17,729 or an annual mean of 739 per year. For the first four years of the policy’s operation, the number of applications was low, ranging from two to seven. Starting in 1997, the number jumps into the hundreds, reaching 1,056 a year later. Applications climb steadily to a peak of 1,447 in 2003 – an election year, and the year before Malta joined the European Union. Applications decline steadily, reaching a second peak of 1,407 in 2007, a year before the next general election, in 2008. After this, the number of applications declines back into the hundreds, reaching 472 in 2015, our last full year.
Table 1 Summary statistics of outside development zone (ODZ) applications
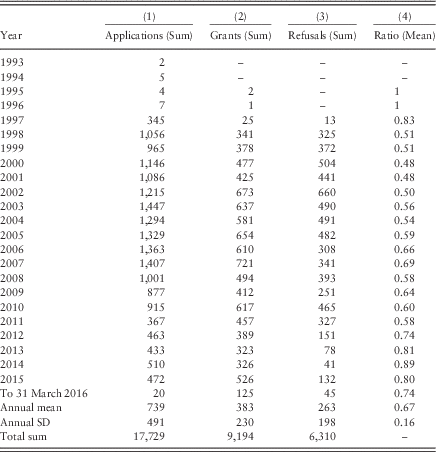
Note: Applications is the total number of ODZ applications filed in the year. Grants is the total number of granted ODZ permits in the year. Refusals is the total number of refused permits in the year. Ratio is the ratio of grants to grants+refusals. Not all applications are decided in the same year that they are filed.
The number of granted permits (column 2) follows the same trend as the number of applications. It rises to a first peak just before the 2003 election year, and levels off until the 2008 election year, and then remains level until the end of the period. Interestingly, the number of refused permits (column 3) also follows the same trend, but diverges from the number of granted permits most strongly in pre-election years. That is, the ratio of granted to granted plus refused permits – the “grant ratio” (column 4) – is highest during election periods. The mean ratio, at 0.60, implies that 60% of all ODZ permit applications are granted permits. In other words, most applications for the development of land in the ODZ are successful. It is worth pointing some other features of the data.
First, the sum of granted and refused permits does not match total applications as not all applications were decided in the year in which they were filed, and because other decisions are available to MEPA. An application can, for example, be “dismissed” if it does not even comply with the agency’s application requirements. In practice, however, permits for most applications are either granted (53% of sample) or refused (35.9% of sample).Footnote 11 Applicants are also able to appeal against the MEPA’s initial decision. Of the 1,930 appeals in our sample, 53.5% were “Dismissed (Original decision stands)” and 19.4% were “Upheld (Original decision overturned)”. The residual appeals were either withdrawn (12.2%),Footnote 12 the applicant abstained (5.2%) or were simply invalid.
Second, applications vary in the type and intensity of development they call for. For example, an application for construction of an entirely new house and an application for the renovation of an existing structure both receive a count of one in our data set. The data set provides qualitative descriptions of the proposed development, meaning that it is technically possible to sift through these descriptions and manually code them according to how substantial the development is. While this is beyond possibility at the moment, but something we hope to work on in the future, the data set provides us with an alternative. Applications are classified by “types”, which can be seen in Table 2.
Table 2 Outside development zone application types
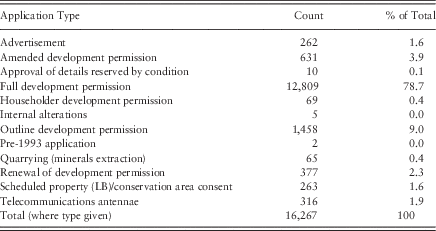
Note: Applications where “application type” is given do not sum to total applications, as “application type” is not always given.
LB = listed building.
Table 2 shows that the lion’s share of applications was filed for “Full development permission” (78.7%). These would be applications ranging from those “To demolish the existing office block and to erect a new office block annexed to the existing factory” (case: PA/05327/97) or smaller projects like those “To erect a greenhouse” (PA/02970/05). The second largest share goes to “Outline development permission” (9%) applications. This category is for projects that are the same as the first type, but acts as pre-application consultation where prospective developers, before buying the land or preparing a more detailed application, can find out whether the application is permissible in principle. The remaining types of applications are self-explanatory. They cover applications for putting up billboards and the like (“Advertisements”, 1.6%), changes to existing permits (“Amended development permission”, 3.9%), renewals of permits (“Renewal of development permission”, 2.3%) and for erecting antennae and satellite dishes (“Telecommunications antennae”, 1.9%). In short, while the application types provided are somewhat coarse, they at least show that most applications are intensive work rather than simple alterations.
Hypothesis 1: the demand for ODZ permits is correlated with the expected return to housing
The consensus explanation for the number of ODZ applications, and for the calls to make ODZ policy more lenient, is based on land scarcity. For example, in 2015 the president of the Malta Developers Association, then also a fund-raiser for the party in government, argued in favour of the private “American University” campus being built on ODZ land: “I understand that the government had to resort to ODZ land as there are no such large expanses of land in established development zones. ODZ land is also cheaper” (Times of Malta Reference Oxley, Brown, Nadin, Qu, Tummers and Fernandez-Maldonado2015). The first part of his argument – that there are no suitable spaces in the non-ODZ – is the land scarcity explanation. The second part of his quote – that “ODZ land is also cheaper” – provides an alternative explanation for the demand for ODZ permits. In this section, we quantitatively test both explanations – land scarcity or the potential return to ODZ land.
ODZ land is cheaper than non-ODZ land because its development potential is limited. A low initial price means ODZ land’s potential return – conditional on a permit – is high. Developers speculatively acquire land regardless of its land use constraints, and then push for permission to develop that land.Footnote 13 In practice, much of “the demand for new agricultural constructions and high-impact reclamation works [in ODZ land is] only intended for subsequent requests for conversion to non-agricultural uses” (Malta MSDECC 2013, 68).
Our measure of land scarcity is population density. Data are from the United Nations Population Information Network (2015) and are in the form of an annual time series that runs from 1993 to 2016. As we are working with a monthly time series in this exercise, we used linear interpolation to estimate monthly values between our annual data points. We expect a positive correlation between population density and ODZ applications.
To measure the potential return of ODZ land, we draw on the real estate literature and express expectations of the return on a house price index in terms of a myopic, adaptive and rational investor (Mourouzi-Sivitanidou Reference Mourouzi-Sivitanidou2011, 48). Myopic, where P is price and
 $\hat{P}_{{t{\plus}1}} {\equals}P_{t} $
, assumes that current demand/price levels (whichever is relevant from the developer’s or investor’s view) will continue into the future in the same way. Adaptive, where
$\hat{P}_{{t{\plus}1}} {\equals}P_{t} $
, assumes that current demand/price levels (whichever is relevant from the developer’s or investor’s view) will continue into the future in the same way. Adaptive, where
 $\hat{P}_{{t{\plus}1}} {\equals}P_{t} {\plus}d$
, is when developers and investors base their expectations on an adjustment, d, to current prices that is based on past mistakes. Rational,
$\hat{P}_{{t{\plus}1}} {\equals}P_{t} {\plus}d$
, is when developers and investors base their expectations on an adjustment, d, to current prices that is based on past mistakes. Rational,
 $\hat{P}_{{t{\plus}1}} {\equals}P_{{t{\plus}1}} ,$
is when developers and investors assemble all relevant information and correctly predict how prices respond to exogenous shocks once they occur. While we test all three forms of expectations, the myopic form is our baseline as it is the most commonly used in the literature (Mourouzi-Sivitanidou 2011). We expect a positive correlation between house price expectations and ODZ applications.
$\hat{P}_{{t{\plus}1}} {\equals}P_{{t{\plus}1}} ,$
is when developers and investors assemble all relevant information and correctly predict how prices respond to exogenous shocks once they occur. While we test all three forms of expectations, the myopic form is our baseline as it is the most commonly used in the literature (Mourouzi-Sivitanidou 2011). We expect a positive correlation between house price expectations and ODZ applications.
The national house price index is from Falzon and Lanzon (2013, 117). It is an annual time series that runs from 1980 to 2010, and is based on average asking prices for all houses. The Central Bank of Malta (2016a) provides a quarterly house price index, also based on average asking prices, for the 2000 to March 2016 period. To develop a monthly time series for 1993 to 2016, we first rebased the Falzon and Lanzon (2013) index to match the Central Bank of Malta (2016a) 2000-fourth-quarter base, where we treated the Falzon and Lanzon (2013) index values as fourth-quarter/end-of-year values. We then linear-interpolated all missing monthly values between the gaps of the Falzon and Lanzon (2013) index, and of the Central Bank of Malta (2016a) index, and used the growth rate of the latter index to extend the Falzon and Lanzon (2013) index into 2016. As a check on this exercise, we also run panel regressions on an annual regional house price index that is free of interpolations and extrapolations.
To strip out the influence of the business cycle of the permit application process, we also control for the monthly unemployment rate. Monthly data for 1993–2002 are from the Central Bank of Malta (2014). For the 2003–2016 period, we had to use another data set, Central Bank of Malta (2016b). This latter data set contains only quarterly data for 2003–2012. Here we linear-interpolated monthly values. The same data set provides monthly data for the 2013 to February 2016 period. To complete the series up to March 2016, we used monthly data from Eurostat (Reference Evers, Spierenburg and Wels2016). We expect the correlation between the unemployment rate and ODZ applications to be negative, since high unemployment implies a depressed economic environment.
In this national monthly time series exercise, we estimate variations of the following specification:
 $$\eqalignno{ Applications_{t} \,{\equals}\, & \alpha {\plus}\beta _{1} \,Applications_{{t{\minus}1}} {\plus}\beta _{2} HP_{{t{\minus}1}} {\plus}\beta _{3} PD_{{t{\minus}1}} \cr & {\plus}\beta _{4} \,Ratio_{{t{\minus}1}} {\plus}\beta _{5} \,U_{{t{\minus}1}} {\plus}\beta _{6} \,T{\plus}{\varepsilon}_{t} $$
where the dependent variable is the count of ODZ permit applications made in month t and the first independent variable is its one-month lag to control for time-dependent trends in application counts. HP is the house price index,Footnote 14 here expressed in our baseline myopic expectation (t−1); PD the population density;Footnote 15 U the unemployment rate;Footnote 16 Ratio the ratio of granted to refused-plus-granted ODZ applications, to control for the leniency of ODZ application procedures; T a monthly time trend; and α and ɛ are a constant and error term with standard properties. We estimate (1) and its variants using Poisson regressions, which are designed for count data. Before implementing model (1), we tested for seasonality in application behaviour. We found no evidence of seasonality in the ODZ applications series.Footnote 17
Again, our expectation is that both variables of interest – HP and PD – have a significant positive effect on Applications, but that HP’s effect is consistently as or more important. Our expectation on U is that it has a negative and significant effect on ODZ applications. The coefficient on Ratio can equally be positive – reflecting a belief in the continuation of leniency – as well as negative – reflecting a belief in the correction of previous leniency. That is, it falls after high periods (elections) and rises from low periods (election run-ups).
Table 3 displays the results of specification (1). Column 1 contains the results on the effects of myopic expectations of house prices on ODZ applications. Column 1 uses a one-month lag of house prices, which enters with a positive and highly significant coefficient. The coefficient implies that a one percentage-point increase in the house price index leads to an exp(0.00645) times increase in the count of applications one month later. For example, using the mean count of applications of 65.4, the effect implies an exp(0.00645)=1.01 times 65.4 increase in the number of applications, 66.1. Is this a large effect? As these are monthly observations, an average 1 percentage-point increase in house prices every month for a year would, all else equal, push up the mean monthly count by 8% (=exp[0.00645]^12−1), to 71.Footnote 18 The coefficient on population density is insignificant. This is surprising, as population density should create structural demand for land. One reason for this result is that after controlling for house prices the channel through which land scarcity is expressed is the housing market, and thus population density loses a meaningful interpretation. The coefficient on Ratio is negative and significant. Rather than capture the perceived leniency of the application process, this coefficient expresses the cyclical nature of the application variable – that it falls after high periods (elections) and rises from low periods (election run-ups). The coefficient on the unemployment rate is positive and highly significant. An interpretation of this result is that high unemployment is associated with initially cheap house prices, and thus greater incentives to apply for development permits – another house-price-expectations channel. Indeed, the correlation between house prices and the unemployment rate is −0.14, significant at 5%.
Table 3 Outside development zone (ODZ) applications and house prices – Poisson estimates
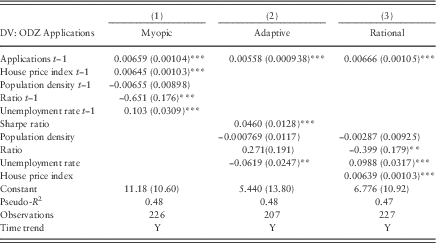
Note: Robust standard errors in parentheses.
DV=dependent variable.
***p<0.01, **p<0.05.
Column 2 contains the results for the adaptive expectations of house prices specification. We measure adaptive expectations using the Sharpe ratio (Sharpe 1966). In this case, the ratio takes the form of the year-on-year return of the house price index less the yield on a 10-year Maltese government bond (the risk-free rate), divided by the standard deviation on the year-on-year house price index return for all preceding periods. The European Central Bank (2016) provides monthly 10-year bond yields from 2001 to 2016. The Central Bank of Malta (2015) provides monthly 10-year bond yields starting from 1999; therefore this estimation necessarily excludes earlier years. The Sharpe ratio has a significant and positive effect on the count of applications. Every unit increase in the ratio implies a multiplicative effect of exp(0.046)=1.05 on the application count, which takes the mean of 65.4 up to 68.5. Population density is again insignificant, as is Ratio, whereas unemployment is now negative and significant.
Finally, column 3 contains the results for the rational expectations of the return on the house price index. It is positive and significant, implying a exp(0.178)=1.01 multiplicative effect on the application count. This is the same sized effect as that in column 1, the myopic expectation model. The remainder of the coefficients also follow the same pattern of direction and significance as column 1.
In summary of Table 3, the coefficient on the expected return to housing is the only consistently positive and significant result, apart from the lagged Applications term. This result on house price expectations holds whether the variable is expressed in myopic, adaptive or rational terms. Its significance level is always 1%, and the size of its effect is meaningful. In Appendix 1, we show that this result is robust to splitting the application data by application type, to panel model estimation using district-level data, to quarterly rather than monthly aggregation, and to various lag structures and smoothing procedures.Footnote 19 Altogether, the evidence in Table 3 and Appendix 1 shows that the demand for ODZ permits is in large part speculative, and incentivised by rising non-ODZ house prices. The results are consistent with the first half of the narrative that ODZ zoning forces a low initial price on ODZ land, setting up the potential of a high expected return if a permit is granted. Next we have to explain why so many ODZ permits are granted.
Hypothesis 2: the leniency of the ODZ permit process also increases in times of appreciating non-ODZ land values.
We expect more applications to be granted permission during times of appreciating non-ODZ land values because that is when political actors see an opportunity for corruption – the demand for permits rises due to land price appreciation, and the supply of permits responds to this increased level of demand. What is the “price” of an ODZ permit, that is, what does would a supplier get in return for a permit?
One potential answer is votes. The absolute numbers of granted permits, seen in Table 1, rise from the low to higher hundreds around elections. Conservatively assuming that each application equals one vote (in reality it is more likely that a number of people would be behind or dependent on each application – family members and employees, for example), it is easy to see how this might matter. The difference in the absolute number of votes between the two main parties was 7,633 in 1996; 12,817 in 1998; 12,080 in 2003; 1,580 in 2008; and an exceptional 35,107 in 2013 [University of Malta (UOM) 2015]. In respective order, the peak annual number of granted permits – 739 in 2007 – is equivalent to 10, 6, 6, 47 and 2% of these vote differences.
A more likely answer is political party financing. Malta does not have political party financing laws that require donors or parties to declare donations. As the 2014 E Anti-Corruption report noted, this feeds the public’s perception that large-scale permits (for supermarkets and hotels, for example) are not granted on objective grounds (EC 2014, 8). One well-known case occurred before the 2008 election, when permits for two large supermarkets in ODZ areas were issued to one of Malta’s largest developers.Footnote 20 Another important case emerged after the 2013 election, when the newly elected government granted state-owned ODZ land to a foreign investor on which to build a large private university campus. A government source claimed that the project would not be profitable if it were not built on ODZ land.Footnote 21 Even more recently, in 2015 the Maltese media reported that one of the country’s largest developers, who is also the president of the Malta Developers Association, is a volunteer for the party in government and that “he has helped out in fund-raising activities” for the party (Dalli Reference Dalli2014).
In either case – party financing or votes – we should expect the ratio of approved to total applications [Ratio, as in model (1)] to be related to the electoral cycle, in the same way that fiscal expenditure has been shown to increase in the run up to elections to in effect buy political support (Rogoff Reference Sharpe1990). In Figure 1, we plot the ratio as a monthly time series. Election dates are marked with vertical grey lines in the plot area. As in Table 1, the ratio is initially at 1 as not many applications were filed during the start of the period and the ones that were filed were successful. The number of applications picks up by the early general election of 1998, which saw a change of the party in government, and also saw a rise in the ratio in the immediate post-election months. The next general election was in 2003, when the ratio spiked at around 0.75, its highest post-1996 level. The ratio then varies between 0.6 and 0.8 until the months running up to the 2008 general election, when it spikes at around 0.9. The party in government won this election. The ratio drops immediately after the election, fluctuating again between 0.6 and 0.8 until the 2013 general election, when it spikes above 0.9, its highest post-1996 level up to that date. This last election saw a change of the party in government and, for the first time in the series, the ratio actually resumed its pre-election rising trend, reaching 1 in the first months of 2015. The pattern outlined in Figure 1 is consistent with incumbents approving ODZ permits in the months running up to general elections (an immediate exchange) whereas competing parties approve ODZ permits in the months immediately succeeding elections (a promise of exchange). Applicants choose the latter option when the chances of the competing party winning an election are higher than those of the incumbent party winning. This is borne out by the election results. The fast rising ratio after 2013 followed the largest vote swing since 1947, and polls showed a poorly performing incumbent party for months leading up to the electionFootnote 22 – despite a rising grant ratio.
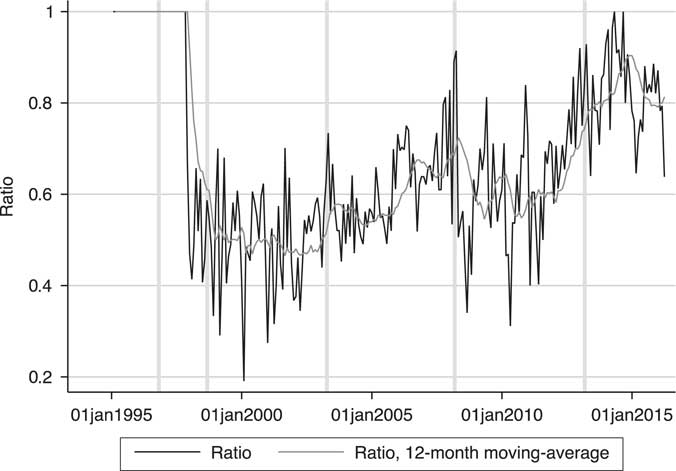
Figure 1 Ratio, 1993–2016. Note: Ratio is the ratio of granted to total number of decided outside development zone applications. This series is monthly. Grey vertical bars mark general elections. Series ends in March 2016.
The implication running through this explanation is that MEPA is not independent from government. MEPA’s Board, which has the final say on ODZ applications, is appointed by the government but is meant to function independently. That the board’s approval decisions match the electoral cycle suggests government interference.
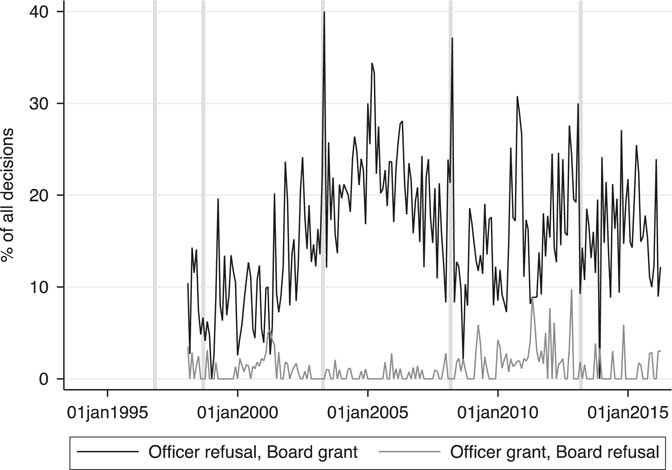
Figure 2 provides evidence consistent with this explanation. The black line represents instances where MEPA case officers recommended refusal of a permit, but the MEPA Board granted it, expressed as a ratio to the total number of decisions made in that month. The grey line represents the reverse: case officers recommending granting a permit, but the Board refusing it. Case officers are the MEPA officials who visit sites and assess ODZ applications. On the basis of their research into each ODZ application, they can recommend that the Board refuses or grants permission, or defers it until more information is acquired. The Board may or may not accept case officers’ recommendations, but we should a priori expect these decisions to be randomly distributed over time. What Figure 2 shows, however, is a similar electoral cycle to that in Figure 1: the ratio rises before general elections, peaks during election months and tends to decline after, again excepting the post-2013 election period. The two highest ratios are in the month of the 2003 general election, when the ratio hit 40%, and in the 2008 general elections, when it rose above 35%. It is remarkable that during these periods, the Board can conflict with case officers on 35–40% of all decisions, compared to a mean across the series of 15%. The 2008 election period, for example, saw the MEPA Board issue permits to one of Malta’s largest developers for the construction of two large supermarkets in ODZ areas. MEPA’s auditor found “gross irregularity” in the unanimous approval of the project, which was reached despite the Planning Directorate recommending refusing the application.Footnote 23 All but one of the Board members resigned following the auditor’s report. The auditor also found that the Board processed an unusually large number of cases in the week before the 2008 election (EC 2014). In contrast, Figure 2’s grey line, representing instances where case officers recommended granting a permit, but the Board refused it, shows no relationship with the electoral cycle. These instances are also much rarer. This contrast between the two series supports the argument that rather than outright bribery of MEPA officials, the issue with MEPA is political corruption – political interference in MEPA’s decision-making process (EC 2014). MEPA, this evidence suggests, is a de facto nonindependent authority that functions as a rent-collection instrument (Aidt Reference Aidt2003).

Figure 2 Malta Environment and Planning Authority (MEPA) case officer recommendations versus MEPA Board decisions, 1993–2016. Note: The black line is a daily series of instances where MEPA’s case officers recommended refusing an outside development zone (ODZ) permit, but MEPA’s Board granted it. The grey line is a daily series of instances where MEPA’s case officers recommended granting a permit, but MEPA’s Board refused it. Both series are expressed as percentages of total ODZ application decisions. Series end in March 2016.
Figures 1 and 2 support the hypothesised exchange of ODZ permits for votes or party financing. Figure 2 is the strongest piece of evidence we have in this regard. It shows both that approvals rise and fall with the electoral cycle as well as the de facto nonindependence of MEPA from the government. In what follows, we test Hypothesis 2 using the ratio from Figure 2, the “reversal ratio”, and the same specification as model (1).Footnote 24 We expect this ratio to be significantly correlated with land value appreciation – periods during which the value of an ODZ permits also appreciates, incentivising a supply response.
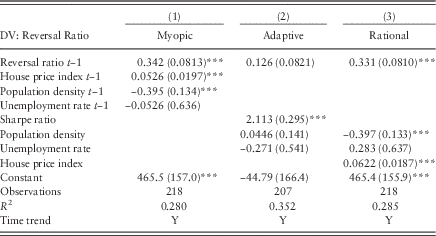
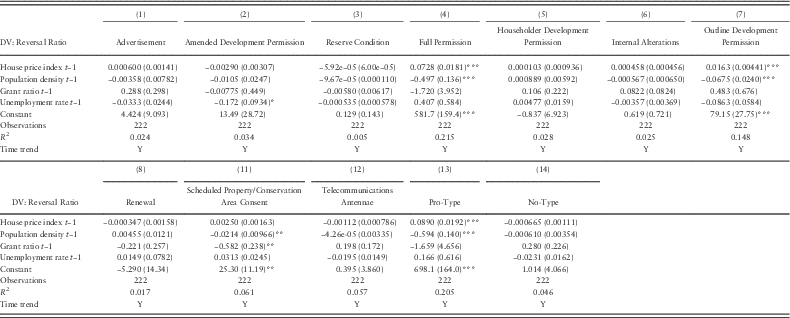
Table 4 contains the results of the effect of house prices on the reversal ratio. It follows the same specifications as Table 3, going from myopic, to adaptive, and rational house price expectations. We estimated the specification using OLS, as the dependent variable is no longer count data. Expectations of house prices have a large, positive and significant effect on the reversal ratio. In the myopic and rational formulations, every percentage-point increase in the house price index is associated with a 0.05–0.06 increase in the reversal ratio; whereas in the adaptive formulation every unit increase in the Sharpe ratio is associated with a 2.1-unit increase in the ratio. Unemployment’s effect is insignificant across all formulations, implying that the Board’s decisions are unaffected by the broader economic environment, while the effect of population density is negative in the myopic and rational formulations while insignificant in the adaptive formulation, implying that if land scarcity does have an effect its through making the Board less lenient or more cautious in its process.
Table 4 Reversal ratio and house prices – ordinary least squares estimates

Note: Robust standard errors in parentheses.
DV=dependent variable.
***p<0.01.
However, the support for this population density effect is weak. Besides being insignificant in the adaptive specification here, the effect of population density is rendered insignificant when we estimate the rational specification in auto-regressive form and converting all variables into quarterly moving averages, as in Table A7 in Appendix 2. Based on these results, it is more likely that the population density variable is capturing a linear time trend in Table 4 (the variable itself was estimated using a linear trend).
The results in Table 4, as in Table 3, show that the coefficients on the expected return to housing, whether expressed in myopic, rational or adaptive terms, are the only consistently positive and significant result. Its significance level is always 1%, and the size of its effect is meaningful. In Appendix 2, we again show that this result is robust to splitting the application data by application type, to panel model estimation using district-level data, to quarterly rather than monthly aggregation, and to various lag structures.Footnote 25
These results are consistent with the second half of the narrative that MEPA is de facto not independent from the government and acts as its rent-collection instrument. Along with the appearance of an ODZ permit electoral cycle, seen in Figures 1 and 2, this evidence suggests that ODZ permits are used to buy political support. Although we necessarily approached this question indirectly, and therefore the result is subject to measurement error, it fits with the concerns in the 2014 EU Anti-Corruption Report that development permits are not granted objectively in line with professional practice, but rather for political aims (EC 2014). It also fits with the concern voiced in the press that the MEPA planning application process is politically guided.Footnote 26
Conclusion
Evidence on political corruption in the land sector is scarce. In this article, we provided three pieces of evidence that support the hypothesis that MEPA acted as a government rent-collection instrument. The ratio of granted to total permit applications for the development of land “ODZ” rose dramatically during election periods. The same is true for the number of instances where MEPA’s Board granted permits despite its case officers recommending refusal.
Demand for ODZ permits likely came through land speculation. We showed evidence that the higher the expected return to housing, which should be difficult to impossible to develop on ODZ land, the larger the number of applications for ODZ permits. Although we are unable to observe precisely what the rents are, the patterns in the data and qualitative evidence suggest that permits were granted in exchange for political party support.
The situation presented here is similar to what Aidt (Reference Aidt2003) categorises as “corruption with a nonbenevolent principal”, and there is evidence of it many other countries (Gardiner and Lyman 1978; Evers et al. 2005; Dodson et al. Reference Dodson, Coiacetto and Ellway2006; Cai et al. Reference Cai, Henderson and Zhang2013). This describes situations where governments create de jure independent authorities that de facto act as a means for the government, or for senior public officials, to collect rents. In other words, policies are adopted and implemented not to eliminate market failures but to create corruption opportunities.
This suggests that regulators like MEPA need more political independence, but the case is always not so clear. In fact, in most established democracies land use applications and processes are decided by a ministry or department that is within the political chain of delegation, thereby under political and electoral control (Oxley et al. Reference Rogoff2009). More electoral control, in these cases, allows the electorate to punish corrupt practices within land use policy.
Why, then, has Malta departed from the institutional choices made in established democracies? MEPA was established as an independent authority to prevent it from acting as a government rent-collection instrument. It is Malta’s culture of clientelism and political patronage (Mitchell Reference Mourouzi-Sivitanidou2002), with each one of the two major political parties having their own client groups, that was used to justify MEPA’s independence and that simultaneously made the authority susceptible to governments using it for rent collection. MEPA’s partial independence – partial, given its government-appointed board – its monopoly over land use policy and Malta’s cultural context made it well placed to collect rents for governments. This modifies Aidt’s (Reference Aidt2003) view that institutions like MEPA are established deliberately as rent-collection instruments. No matter how well intentioned the establishment of an independent authority is, if it is not fully independent within a culture of clientelism and political patronage, like Malta’s, then it will fail to objectively make policy and follow professional practice. The policy implication suggested by this article, however, remains the same: MEPA needs more political independence. Bringing it under full government control as in established democracies would dismantle all remaining checks on land use policy.
If, as in Malta, a country’s broader institutional environment makes more political independence for planning authorities unlikely, an alternative is to address what makes rent-collection possible. The exchange of permits for political party support can be made less of a threat by making donations to political parties and politicians public. If this too were unlikely to be implemented, making data on permit applications easily available to anyone would better enable the press and researchers to scrutinise the permit process. This article marks one step in that direction for Malta, but it was not easily made: our first freedom of information request for the ODZ data was denied, the second ignored. The press has played an important role in exposing corruption in the land sector, but gets by with occasional reports or special investigations. The problem is endemic and requires a more systematic approach, as demonstrated in this article.
It is unfortunate that the April 2016 division of MEPA into an Environment and Resources Authority and a Planning Authority sees Malta moving in the opposite direction of more independence. The senior officials in these organisations are government appointees, and the Environment and Resources Authority has little real influence over decisions made by the Planning Authority, which decides on ODZ permits. One of its first major decisions was to grant a permit for a 38-storey tower, despite concerns about traffic flow and noise pollution raised by the case officer, and concerns raised by the Environment and Resources Authority about the visual and geological impact of the project, warning of “potential collapse of excavation” (Debono Reference Djankov, La Porta, Lopez-de-Silanes and Shleifer2016). The Gasan Group, a conglomerate that previously came under fire for its intimate links to senior government officials, leads the project.Footnote 27
Acknowledgements
The authors would like to thank the three anonymous reviewers and editor for their comments on the original manuscript.
Appendix 1: ODZ permit applications and expected return to housing
Although the results in Table 3 are consistent with the speculative demand hypothesis, potential problems remain. The first is that not all ODZ permit applications are alike: some may be for smaller projects and others for large-scale developments. The second is that the demand for ODZ permits is not speculative, but is driven by fundamental causes. As population density is ambiguously correlated with the application count in Table 3, it is possible that fundamental demand is already priced into the house price index. A third concern is that the lag structure of model (1) is incorrectly specified: that Applications may be determined by variation in t−1, t−2 and t−3. It may also be that that monthly aggregation prioritises noise over signal. A final concern is that using interpolations and extrapolations to assemble our data set produces misleading results.
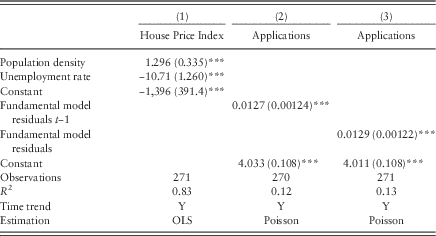
To address the first concern, we split the sample by application types as in Table 2 and ran the baseline myopic house price expectation specification as in column 1 of Table 3. The results of this exercise are in Table A1. Column 1 contains the baseline estimation for the sake of comparison. Except for applications filed under the type “Scheduled property/Conservation area consent”, which concerns properties of historic significance, “Internal alterations”, “Quarrying/mining” and “Telecommunications”, expectations of house prices have significant effect on all types of application counts. The direction of the effect is not always positive. The coefficient for “Quarrying (Minerals extraction)” is negative and significant. Quarries are land-intensive and are developed during times of low land prices. There were only 65 applications under this type. Similarly, the coefficient on “Telecommunications” (316 applications) is negative and significant, as antennae and other similar public infrastructure are ideally built when land prices are low. There were only five applications filed under “Internal alterations”. Two other coefficients are negative – “Approval of details reserved by condition” and “Pre-1993 Applications” – but too few applications, 10 and 2, respectively, were filed under these types to draw any inferences. The “Full permission” coefficient is close to the aggregate coefficient as this type makes up most of the sample. We estimate a similar sized coefficient for “Amended development permission” (631 applications), “Householder development permission” (69 applications), a larger one for “Outline development permission” (1,458 applications) and smaller for “Renewal of development permission” (377 applications). The coefficient for the “Advertisements” (262 applications) subsample is larger, reflecting a large response of commercial activity to rising house prices. In short, while this is not the ideal disaggregation of ODZ permit application types, it does at least back up the baseline finding that the demand for permits rises when house prices are rising. This is also supported by the negative coefficient found for the “Quarrying (Minerals extraction)” and “Telecommunications” subsamples, where development tends to be unrelated to speculative investment in housing. Finally, to minimise the noise within individual types, columns 14 and 15 group application types according to whether they are likely (14) or unlikely (15) to be affected by house price expectations. The latter includes applications filed under the following: telecommunications, quarrying and mining, and internal alterations. The former includes all other types. The coefficient on the house price index in t−1 is positive and highly significant in column 14 and negative and insignificant in column 15.
Table A1 Outside development zone (ODZ) application types and house price expectations – Poisson estimations
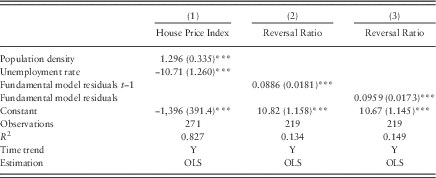
To decompose variation in the house price index into a fundamental and speculative component, we first regressed the index on two fundamental determinants – population density (measuring the availability of land) and the unemployment rate (the ability to buy land) – a time trend, and a constant. We then backed out the residuals from this regression, assuming the residual component is speculative, as it is not explained by fundamental drivers (those used to estimate the residuals). We then used those residuals to explain the application count. The results of this exercise are in Table A2. The ordinary least squares (OLS) estimates in column 1 show that the fundamental specification explains 83% of the variation in the house price index, with both population density and the unemployment rate being highly significant and entering with the correct signs. Moving to the Poisson estimation of the application count in columns 2 and 3, where we express the residual-speculative component in baseline myopic terms (t−1) and rational terms (t), respectively, we find support for the speculative demand channel: a positive and highly significant coefficient on the residuals. The pseudo-R 2 values in columns 2 and 3 imply that the speculative demand channel can explain between 12 and 13% of the variation in the application count.
Table A2 Fundamental and speculative drivers of house prices

To check whether the specification of model (1) prioritises noise over signal, and whether the lag structure affects the main result, we in Table A3 run four checks. In column 1, we logged all the variables and implemented the rational specification. This log specification explains 84% of the variation in the application count, but the log house price index is the only significant variable. Its estimate implies a 0.4% increase in the application count for every 1% increase in the house price index. In column 2, we used quarterly moving averages to smooth all the variables and again implemented the rational specification. Here we explain 95% of the variation in the application count. The pattern of results is the same as in column 3 of Table 3, apart from the insignificance of Ratio here. Quarterly smoothing filters out the monthly cyclical link between Ratio and the application count. In column 3, we implement the rational specification again, but using an auto-regressive approach. We include three lags of the application variable, all of which are significant. Even after controlling for these lags, the house price index’s effect on the application count remains positive and highly significant. In column 4, we convert our data to quarterly observations. This both smooths the variables and, if we exclude population density which is recorded annually, gives us a data set that is free of interpolations. The estimate on the house price index is positive, significant and a similar size to the coefficient in column 3 of Table 3.
Table A3 Outside development zone (ODZ) applications and house prices

Finally, to assemble a data set without any interpolations and extrapolations, we exploited the regional dimension of our data sets. Falzon and Lanzon (2013, 135) provide house price indices for Malta’s 13 electoral districts up to 2010. The district boundaries were drawn to equalise voter population levels, each one containing an average of 25,617 voters, with a coefficient of variation at 0.035, in 2013 (UOM 2015). The ODZ permit application data contain a local council field – a subdivision of electoral districts. We matched local councils to their electoral districts, using the current boundaries, and recalculated all our main variables by district: the application count, house price changes and the Sharpe ratio. Population density is unavailable at this level before 2005. An additional benefit of this set up is that we look at variation within districts over time, and thus controls for time-invariant district characteristics that may affect the application count. Starting with column 1 of Table A4, the results of this panel regression exercise show that the myopic specification holds up well. The coefficient on the house price index in t−1 is smaller in magnitude, but remains positive and highly significant. The same is true for the Sharpe ratio in column 2 (adaptive expectations), and the contemporaneous house price index in column 3 (rational expectations). One reason why the coefficients are smaller on the district level is that the property market is not so regionally segregated, and therefore house price rises in one district spill over into a neighbouring or vice-versa. Given the small size of Malta and its districts, this is a likely occurrence and would dampen the direct district-level link between the house price index and the application count.
Table A4 District-level outside development zone (ODZ) application and house prices – Poisson estimations

Appendix 2: ODZ permit approvals and expected return to housing
Here we subject the estimates in Table 4 to the same robustness checks we used in Appendix 1 on the estimates in Table 3.
Table A5 shows that splitting the reversal ratio by application type, following the same classification as Table A1, yields results that are consistent with Hypothesis 2. The strongest effect of house price expectations on the reversal ratio happens under types that are more susceptible to the land price appreciation channel: full development permission and outline development permission. We do not find any other significant effects across the other types, but this is the outcome of a high number of zero values. When we re-aggregate types according to whether they are likely (13) or unlikely (14) to be affected by house price expectations, as in Table A1, we find a large positive and significant house price expectation effect on the former and a negative and insignificant effect on the former.
Table A5 Reversal ratio and house prices – ordinary least squares estimations
In Table A6, we run the same fundamental-speculative demand channel test. The results in column 1 are necessarily the same as those in column 1 of Table A2. Column 2 shows that the myopic formulation of house price expectations has a positive and significant effect on the reversal ratio, and explains 13% of the variation in the reversal ratio. Column 2, the rational formulation, shows a similarly sized and significant effect on the reversal ratio, and explains 15% of the variation in the reversal ratio. These results imply that the speculative demand channel plays a quantitatively important role not just in driving ODZ application counts but also in driving the reversal ratio – a measure of government interference in the planning process.
Table A6 Fundamental and speculative drivers of house prices – reversal ratio
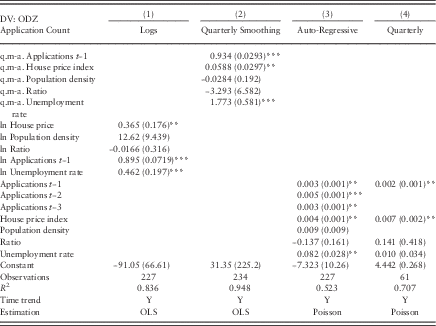
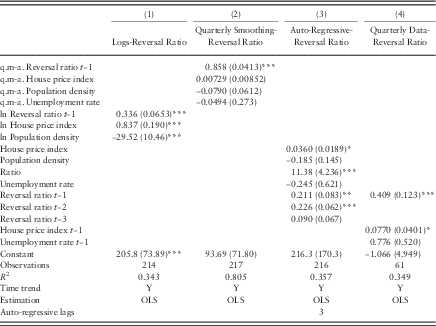
In column 1 of Table A7 we show that the house price expectation channel’s effect on the reversal ratio is robust to log transforming the variables. The coefficient on the house price index implies a 0.8% change in the reversal ratio for every 1% change in the house price index. The coefficient is highly significant. Column 2, where we apply a quarterly moving-average to all variables, is the only specification where we do not find a significant effect on the house price index. This insignificance means that quarterly smoothing filters out the cyclical link between the reversal ratio and house price expectations, implying that the link operates at frequencies lower than a quarter or that oversmoothing misses important turning points in the time series. In column 3, we apply three lags of the reversal ratio to the rational specification. The t−1 and t−2 terms are significant, but the house price index retains a positive and significant effect on the reversal ratio. Finally, in column 4, we convert our data to quarterly observations. The estimate on the house price index is positive, but significant at a lower level.
Table A7 Reversal ratio and house prices
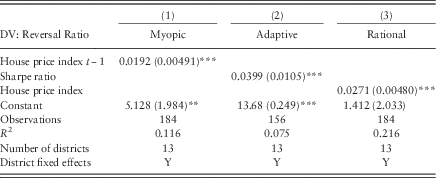
Finally, as in Table A4, we created the same panel (electoral district by year) data set with the reversal ratio data, and estimated the effect of house price expectations on the reversal ratio at this level, controlling for district fixed effects. Starting with column 1 of Table A8, the results of this panel regression exercise show that the myopic specification holds up well. The coefficient on the house price index in t−1 remains positive and highly significant. The same is true for the Sharpe ratio in column 2 (adaptive expectations), and the contemporaneous house price index in column 3 (rational expectations). The coefficients imply a 0.2–0.4-unit increase on the reversal ratio for every percentage-point increase in the house price index or unit increase in the Sharpe ratio.
Table A8 District-level reversal ratio and house prices – ordinary least squares estimations