INTRODUCTION
Embedded performance validity tests (embedded PVTs) are a useful complement to stand-alone PVTs. They allow for a shorter evaluation while simultaneously providing information about performance validity and enable ongoing monitoring of test taking effort throughout the course of a testing session (Boone, Reference Boone2013). By virtue of relying on established neuropsychological tests of core cognitive domains (e.g., attention, memory, processing speed) that also measure performance validity, clinicians can meet the multiple (and sometimes competing) demands of providing a comprehensive assessment of the patient’s neurocognitive functioning, performing an objective evaluation of test taking effort, and keeping the test battery length within reason.
PVT cutoffs are optimized for specificity (true negative rate) to protect individuals from being falsely deemed invalid responders. Keeping false positive errors under 10% is a standard guideline for calibrating new instruments (Boone, Reference Boone2013). Therefore, high specificity (around .90) is a fundamental requirement, and sensitivity (true positive rate) is the test parameter that varies across instruments.
California Verbal Learning Test, 2nd Edition, Forced Choice Recognition Trial
The most common ways to develop embedded PVTs include identifying a new indicator (e.g., reliable digit span; Greiffenstein, Baker, & Gola, Reference Greiffenstein, Baker and Gola1994), a certain cutoff on an existing subtest (e.g., digit span age-corrected scaled score; Spencer et al., Reference Spencer, Axelrod, Drag, Waldron-Perrine, Pangilinan and Bieliauskas2013), or a logistical regression using a combination of scores (Wolfe et al., Reference Wolfe, Millis, Hanks, Fichtenberg, Larrabee and Sweet2010). In contrast, the authors of the California Verbal Learning Test – 2nd Edition (CVLT-II; Delis, Kramer, Kaplan, & Ober; Reference Delis, Kramer, Kaplan and Ober2000) introduced a novel task (Forced Choice Recognition [FCR]), which is administered following a second delay, 10 min after the standard clinical instrument is completed. Adding a delay before FCR may create the perception of increased difficulty and, thus, elicit a lower performance in those prone to poor test taking effort (Tombaugh, 1996; Green, Reference Green2003).
Although Delis et al. refrained from endorsing a specific cutoff, they report a study by Connor, Drake, Bondi, and Delis (Reference Connor, Drake, Bondi and Delis1997) that used an early version of the FCR task and produced an impressive combination of sensitivity (.80) and specificity (.97) using a cutoff score of ≤13. They also use the base rate of failure (BR Fail ) argument to calibrate FCR: >90% of healthy participants in the normative sample (N=1087) obtained a perfect score, most of the remaining 5 to 8% scored 15, and none scored ≤13. Delis et al. suggested that since only a small percentage of the normative sample scored ≤14, the profiles of such individuals should be viewed with caution as they may be invalid. Of note, participants in the normative sample were not administered stand-alone PVTs, so the clinical meaning of lower than expected FCR scores is unclear. Although those with very poor overall performances on the CVLT-II were excluded because of presumed dementia or other impairment, the specific exclusion criteria are not provided in the manual. In addition, the percentage of healthy controls that score ≤14 is of less relevance for clinical practice than is the percentage of clinical groups that score ≤14.
Given the limited rationale for choosing ≤14 as the default FCR cutoff, and the variability of reference PVTs and the clinical populations used in cross-validation studies, there is a clear need for a systematic review of the BR Fail across diagnostic categories and concordance rates with established PVTs. This study was designed to review the clinical literature on FCR and critically examine the cumulative evidence of its classification accuracy. A summary of the evidence base on FCR’s signal detection profile relative to other PVTs would allow for an empirically based evaluation and clinical interpretation of FCR scores in clinical settings.
METHODS
Search Strategy
Three electronic databases (PubMed, PsycINFO and Scopus) were searched for peer-reviewed original empirical papers on FCR. A combination of six search terms (“CVLT forced choice”, “California Verbal Learning Test forced choice”, “California Verbal Learning Test effort”, “California Verbal Learning Test traumatic brain injury assessment”, “California Verbal Learning Test neuropsychology disease treatment” and “CVLT recognition long-term memory performance”) was used to achieve a balance between breadth (i.e., include the largest number of papers possible) and depth (i.e., keep the search focused on papers most likely to contain the relevant information). The search was restricted to articles published since 2001, to automatically exclude studies conducted before the FCR trial became publicly available. A total of 329 articles were initially identified and reviewed by the first three authors. Only studies with available FCR raw score data (k=37; N=7575) were included in the final analyses. Those that included comparison to established PVTs administered to the entire sample were included in comparison analyses.
Data Analyses
BR Fail was reported for FCR and reference PVTs. Sensitivity (true positive rate) and specificity (true negative rate) were computed for FCR against reference PVTs, along with likelihood ratios (LR). A positive LR (+LR) is an index of how much more likely an individual with a given condition (i.e., invalid performance) is to produce a positive test result (i.e., fail a PVT) compared to an individual without the condition (i.e., valid performance). Conversely, negative LR (–LR) is an index of how much less likely an individual with a given condition (i.e., invalid performance) is to produce a negative test result (i.e., pass a PVT) compared to an individual with the condition (i.e., invalid performance). Naturally, the higher the +LR and the lower the –LR, the more informative the test is.
RESULTS
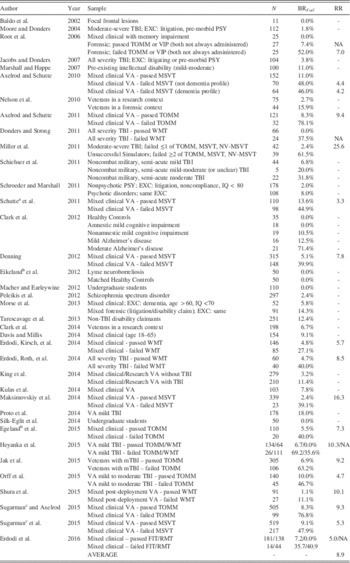
Table 1 presents BR Fail for FCRs ≤14. All 245 healthy controls across four studies scored above this cutoff (Clark et al., Reference Clark, Stricker, Libon, Delano-Wood, Salmon, Delis and Bondi2012; Eikeland, Ljøstad, Mygland, Herlofson, & Løhaugen, 2012; Macher & Earleywine, Reference Macher and Earleywine2012; Silk-Eglit et al., Reference Silk-Eglit, Stenclik, Gavett, Adams, Lynch and Mccaffrey2014). Within studies, the presence and/or severity of neurological disease process had a dose-response relationship to BR Fail on FCR, but 322 clinical patients who passed reference PVTs and another 104 who were unexamined for performance validity also had a zero BR Fail . An additional 170 patients with a variety of neuropsychiatric conditions, such as focal frontal lesions (Baldo, Delis, Kramer, & Shimamura, Reference Baldo, Delis, Kramer and Shimamura2002), amnestic mild cognitive impairment (Clark et al., Reference Clark, Stricker, Libon, Delano-Wood, Salmon, Delis and Bondi2012), lyme neuroborreliosis (Eikeland et al., 2012), and mixed clinical with memory impairment (Root, Robbins, Chang, & Van Gorp, Reference Root, Robbins, Chang and Van Gorp2006), also had zero BR Fail .
Table 1 Base rates of failure (BRFail) for FCR ≤14 in the published literature (N=7575)

Note. FCR = Forced Choice Recognition trial of the CVLT-II (cutoff, ≤14); RR = Relative risk associated with failing the reference PVT vs. FCR; TOMM = Test of Memory Malingering (standard cutoffs); VIP = Validity Indicator Profile (standard cutoffs); MSVT = Medical Symptom Validity Test (standard cutoffs); WMT = Green’s Word Memory Test (standard cutoffs); NV-MSVT = Non-Verbal Medical Symptom Validity Test (standard cutoffs); FIT = Rey 15-item test (standard cutoffs); RMT = Recognition Memory Test – Words (standard cutoffs); EXC = exclusion criteria; PSY = psychiatric disorders; VA = Veteran’s Affairs.
a Same pool of VA patients with a larger N.
b Norwegian version of the CVLT-II.
c Same pool of VA patients as in Sugarman and Axelrod (Reference Sugarman and Axelrod2015) and Sugarman et al. (Reference Sugarman, Holcomb, Axelrod, Meyers and Liethen2015).
BR Fail on FCR covaried with the severity of neurocognitive impairment. Patients in the semi-acute stage of TBI with moderate injury severity were almost five times more likely to fail FCR than those with mild injury (Schiehser et al., Reference Schiehser, Delis, Filoteo, Delano-Wood, Han, Jak and Bondi2011). BR Fail was four times higher in patients with psychotic disorders compared to those with other psychiatric disorders (Schroeder & Marshall, Reference Schroeder and Marshall2011). Patients with moderate Alzheimer’s disease were six times more likely to fail FCR than those in earlier stages of the disorder (Clark et al., Reference Clark, Stricker, Libon, Delano-Wood, Salmon, Delis and Bondi2012). Presence of TBI more than tripled the likelihood of FCR failure in a mixed clinical sample of veterans assessed in a research context (King et al., Reference King, Donnelly, Wade, Donnelly, Dunnam, Warner and Alt2014). However, in the absence of data on reference PVTs, the clinical meaning of these findings is difficult to determine.
A combined sample of 1526 patients (excluding dementia and intellectual disability) across 14 studies with no external incentives to appear impaired (as identified by researchers) and no data on reference PVTs produced a weighted mean BR Fail of 3.5%. Conversely, a combined sample of 386 patients (excluding dementia and intellectual disability) across three studies (Morse, Douglas-Newman, Mandel, & Swirsky-Sacchetti, Reference Morse, Douglas-Newman, Mandel and Swirsky-Sacchetti2013; Nelson et al., Reference Nelson, Hoelzle, McGuire, Ferrier-Auerbach, Charlesworth and Sponheim2010; Tarescavage, Wygant, Gervais, & Ben-Porath, Reference Tarescavage, Wygant, Gervais and Ben-Porath2013) with incentive to appear impaired, but no data on reference PVTs, produced a weighted mean BR Fail of 13.2%.
A combined clinical sample of 3417 patients across 19 studies who passed a reference PVT produced a weighted mean BR Fail of 6.8%. Conversely, a combined clinical sample of 1245 patients across the same 19 studies who failed a reference PVT produced a weighted mean BR Fail of 49.9%. The average within-study risk ratio associated with passing or failing a reference PVT was 8.5, suggesting that overall, examinees who failed the reference PVT were 8.5 times more likely to also fail FCR.
A subset of studies (N=4432) reported enough data to compute the classification accuracy of FCR against stand-alone PVTs (Table 2). Although comparing parameters derived from different samples, BR Fail , and reference PVTs inevitably increases method variance, a few trends are apparent. Overall, FCR had much higher specificity (.93) than sensitivity (.50) to invalid responding, and better positive (7.7) than negative (.54) likelihood ratios.
Table 2 Sensitivity (SN), specificity (SP), positive (+LR) and negative likelihood ratios (−LR) of FCR ≤14 against reference PVTs (PVTRef)

Note. BR Fail = Base rate of failure (% of the sample scored below the cutoff); FCR = Forced Choice Recognition trial of the CVLT-II (cutoff, ≤14); MSVT = Medical Symptom Validity Test (standard cutoffs); TOMM = Test of Memory Malingering (standard cutoffs); WMT = Green’s Word Memory Test (standard cutoffs); FIT = Rey 15-item test (standard cutoffs); RMT = Recognition Memory Test – Words (standard cutoffs); VA = Veteran’s Affairs; Mod = moderate severity; SENS = sensitivity; SPEC = specificity; +LR = positive likelihood ratio; −LR = negative likelihood ratio.
a To be consistent with other studies, MSVT failures with dementia and non-dementia profiles were collapsed.
b Same pool of VA patients as in Sugarman and Axelrod (Reference Sugarman and Axelrod2015) and Sugarman et al. (Reference Sugarman, Holcomb, Axelrod, Meyers and Liethen2015).
BR Fail was also evaluated as a function of criterion measures. The weighted mean BR Fail on reference PVTs was 26.6%, versus 17.3% on FCR. However, of the 328 patients across six studies who failed the Test of Memory Malingering (TOMM) at standard cutoffs, 65.6% failed FCR (Axelrod & Schutte, Reference Axelrod and Schutte2011; Egeland, Andersson, Sundseth, & Schanke, Reference Egeland, Andersson, Sundseth and Schanke2015; Heyanka et al., Reference Heyanka, Thaler, Linck, Pastorek, Miller, Romesser and Sim2015; Jak et al., Reference Jak, Gregory, Orff, Colón, Steele, Schiehser and Twamley2015; Orff et al., Reference Orff, Jak, Gregory, Colón, Schiehser, Drummond and Twamley2015; Sugarman & Axelrod, Reference Sugarman and Axelrod2015). In contrast, only 30.9% of the 249 patients across four studies who failed the Word Memory Test (WMT) at standard cutoffs scored ≤14 on FCR (Donders & Strong, Reference Donders and Strong2011; Erdodi, Kirsch, et al., Reference Erdodi, Kirsch, Lajiness-O’Neill, Vingilis and Medoff2014; Erdodi, Roth, et al, Reference Erdodi, Roth, Kirsch, Lajiness-O’Neill and Medoff2014; Heyanka et al., Reference Heyanka, Thaler, Linck, Pastorek, Miller, Romesser and Sim2015; Shura, Miskey, Rowland, Yoash-Gantz, & Denning, Reference Shura, Miskey, Rowland, Yoash-Gantz and Denning2015).
DISCUSSION
The FCR trial was introduced to the CVLT-II to screen for invalid responding. To our knowledge, this is the first systematic review of its ability to differentiate cognitive impairment from invalid responding in clinical, research and forensic samples, and classification accuracy against established PVTs. At FCR ≤14, BR Fail was zero for all healthy controls, consistent with the very low BR Fail (<1%) observed in the normative sample (Delis et al., Reference Delis, Kramer, Kaplan and Ober2000).
As expected, scores on other PVTs, incentive status and type of criterion measure were associated with BR Fail on FCR. Those who failed reference PVTs were eight times more likely to also fail FCR. Similarly, those with external incentives to appear impaired (as identified by researchers) were four times more likely to fail FCR, suggesting that FCR is sensitive to poor test taking effort. In addition, those who failed the TOMM were more than twice as likely to fail FCR than were those who failed the WMT.
The heterogeneity of criterion measures is a major limitation of any attempt to summarize PVT research across studies using different instruments. Our review is no exception. Reporting omnibus FCR failure rates in reference to PVTs with different signal detection profiles further inflates method variance. Therefore, we avoided traditional meta-analytic techniques and single-number summaries such as AUC, because they often produce misleading conclusions (Hanczar et al., Reference Hanczar, Hua, Sima, Weinstein, Bittner and Dougherty2010; Hand, Reference Hand2009; Lobo, Jiménez‐Valverde, & Real, Reference Lobo, Jiménez‐Valverde and Real2008). However, the large number of studies and sample sizes are expected to attenuate these measurement artifacts. Furthermore, the excessive between-studies variability mostly affects the stability of global parameter estimates (i.e., the BR Fail in general, across all studies and PVTs), which is beyond the scope of the present study. The most relevant finding is that, overall, FCR produced lower BR Fail (17.3%) than reference PVTs (26.6%). The fact that BR Fail was almost double on WMT (37.4%) compared to TOMM (20.0%) is both a confound in computing the averaging classification accuracy for FCR and an important clinical observation well-supported in the research literature (Green, Reference Green2007).
Empirical evidence on FCR’s classification accuracy suggests that the ≤14 cutoff is highly specific, but only moderately sensitive to invalid responding. In other words, scoring >14 on FCR does not rule out non-credible presentation as it misses half of the invalid response sets, but scoring below that cutoff rules it in with high accuracy, keeping false positive errors around 6%. This seemingly inescapable trade-off between sensitivity and specificity has been labeled the “Larrabee limit” (Erdodi, Kirsch, et al., Reference Erdodi, Roth, Kirsch, Lajiness-O’Neill and Medoff2014).
One limitation of most studies is that it is unclear how many of these failures represent marginal (“near-pass”) versus more extreme failures. That information would be important because the performance of individuals who fail FCR at ≤13 or ≤12 (as in case studies reported by Binder, Spector, & Youngjohn, Reference Binder, Spector and Youngjohn2012; Yochim, Kane, Horning, & Pepin, Reference Yochim, Kane, Horning and Pepin2010) could be better understood if the BR Fail associated with a score that low in individuals with severe impairment and/or those who pass reference PVTs was known. Conversely, it has also been suggested that a less conservative cutoff (≤15) merits investigation (D. Delis, personal communication, May 2012; Erdodi, Kirsch, et al., Reference Erdodi, Kirsch, Lajiness-O’Neill, Vingilis and Medoff2014; Root et al., Reference Root, Robbins, Chang and Van Gorp2006). Other limitations included the fact that some studies did not group disease or injury by severity, which limits the meaning that can be drawn from those groups, and many studies administered only one PVT to group participants, which is not reflective of recommended (Heilbronner et al., Reference Heilbronner, Sweet, Morgan, Larrabee and Millis2009) or actual (Sweet, Benson, Nelson, & Moberg; Reference Sweet, Benson, Nelson and Moberg2015) practice.
Investigations of the relationship between FCR and other CVLT-II indices (such as recall, recognition, or executive type errors) would allow a more nuanced approach to interpreting FCR failures in groups with higher or lower BR Fail . It is also worth noting that, while the CVLT-II normative sample excluded participants who performed poorly enough to suspect dementia or other significant cognitive impairment, they were not systematically screened with PVTs. That stated, nearly 1% of that group failed FCR, as did a variable proportion (0.0–13.6%) of the samples that passed reference PVTs, underscoring the poor negative predictive power of FCR.
Future research on FCR would benefit from reporting the frequency distribution for FCR, rather than group means, standard deviations or BR Fail , as that would provide a better informed clinical interpretation of FCR scores, allow to explore alternative cutoffs, and establish an empirical basis for the stratification of marginal versus extreme failures (Bigler, Reference Bigler2012). First, the highly skewed distribution suggests that a cutoff-based interpretation (rather than treating FCR as a continuous scale) is the appropriate clinical interpretation of the instrument. Second, FCR violates the basic assumption of normality underlying most statistical tests, rendering some of the designs using regression analyses with FCR as a continuous variable of questionable validity. Finally, a systematic review of the classification accuracy of other PVTs embedded within the CVLT-II (e.g., Yes/No recognition hits) would be a valuable addition to the literature.
We found that non-credible examinees are eight times more likely than credible ones to fail FCR. However, non-credible examinees are only half as likely to pass FCR compared to credible examinees. Therefore, failing FCR is a strong predictor of invalid performance, but passing FCR is a weak predictor of valid performance. This signal detection profile is consistent with the test authors’ description, who stated that FCR “is best suited for the detection of suboptimal effort in more blatant, unsophisticated exaggerators.” (Delis et al., Reference Delis, Kramer, Kaplan and Ober2000, pp. 54–55). Overall, we interpret this burgeoning literature as providing support for the utility of FCR as a PVT in many applications, while recognizing that judgment about performance validity must be based on multiple validity indicators and incorporate findings from other sources of information such as clinical history, observation, and known patterns of neuropsychiatric dysfunction (Heilbronner et al., Reference Heilbronner, Sweet, Morgan, Larrabee and Millis2009).