


INTRODUCTION
Conventional radiocarbon measurements of carbonates using accelerator mass spectrometry (AMS) usually require a laborious multistep process covering the sampling, the chemical conversion to graphite, and, finally, the measurement with AMS. To construct a 14C record from a growing sequence (e.g. speleothems or corals), individual samples are taken by micromilling along the growth axis of the sample with spatial resolution reaching a few hundred µm (Fohlmeister et al. Reference Fohlmeister, Kromer and Mangini2011, Reference Fohlmeister, Schroeder-Ritzrau, Scholz, Spoetl, Riechelmann, Mudelsee, Wackerbarth, Gerdes, Riechelmann, Immenhauser, Richter and Mangini2012; Hodge et al. Reference Hodge, McDonald, Fischer, Redwood, Hua, Levchenko, Drysdale, Waring and Fink2011; Rudzka-Phillips et al. Reference Rudzka-Phillips, McDermott, Jackson and Fleitmann2013; Sundqvist et al. Reference Sundqvist, Holmgren, Fohlmeister, Zhang, Bar Matthews, Spotl and Kornich2013). This process is time consuming, especially when aiming for high spatial resolution. Typically, sample preparation and conversion into a graphite target ready for AMS requires approximately 5 hr of preparation time for a batch containing seven samples.
A common sampling method for fast elemental and isotopic analysis of solid samples is laser ablation (LA) coupled to inductively coupled plasma mass spectrometry (ICPMS) (Gray Reference Gray1985; Durrant and Ward Reference Durrant and Ward2005; Fernandez et al. Reference Fernandez, Claverie, Pecheyran and Donard2007; Pisonero et al. Reference Pisonero, Fernandez and Guenther2009; Koch and Guenther Reference Koch and Guenther2011). With this technique, a high-energy pulsed laser beam is focused onto the surface of a solid sample, decomposing a very small part of it and forming an aerosol, which is directly introduced into the plasma ion source of an ICPMS for online analysis. The advantages of this technique are its ease of use, the high spatial resolution down to the µm scale, and the resulting low material consumption. Furthermore, little sample preparation is required, reducing the risk of contamination during sample preparation and the overall analysis times.
By focusing an ultraviolet laser beam onto a carbonate sample, a considerable proportion of the ablated material is converted into CO2. Rosenheim et al. (Reference Rosenheim, Thorrold and Roberts2008) estimated the CO2 yield from a CaCO3 sample ablated with a quintupled Nd:YAG 213-nm wavelength laser system to be around 30%. In their study, the produced CO2 was collected on a CO2 trap, graphitized, and subsequently analyzed for its 14C/12C ratio as a conventional AMS sample. Even though this pilot study could show that LA sampling for 14C measurements is possible, it could not benefit from the online measurement of the CO2 sample in a gas ion source. In a second study, using a comparable laser system that is operated at the same wavelength, the maximum CO2 yield was estimated to be up to 70% (Wacker et al. Reference Wacker, Muensterer, Hattendorf, Christl, Guenther and Synal2013). Here, the CO2 was directly flushed into the AMS for online 14C analysis and the known 14C/12C ratio of a stalagmite sample was well reproduced within uncertainties.
Based on these initial studies, a dedicated LA-AMS system was developed that permits rapid 14C analyses of relatively large samples with the ability of reaching a high spatial resolution. The LA-AMS unit was designed under the aspects of a high CO2 conversion efficiency and a large flexibility regarding sample size and shape. A thorough characterization of the system was performed including the determination of ablation rates, CO2 conversion efficiency, and AMS signal intensity as a function of both the helium carrier gas flow rate and CO2 concentrations. Finally, the blank value of the system and the reproducibility of analyses of samples with known ratios as well as washout behavior and possible cross-contamination issues were investigated.
METHODS
Instrumental Setup
A mixture of a particulate and a gas phase is formed when ablating CaCO3. The respective amounts of these phases depend on several parameters like the laser wavelength and energy as well as the ambient pressure in the LA cell. Once the CO2-containing gas phase is produced by LA, it needs to be transferred into the gas ion source of the AMS as efficiently as possible. To ensure optimal operation of the gas ion source, it needs to be fed with He and laser produced CO2 at a certain flow rate and gas mixture. These parameters, in turn, depend on the pressure in the LA cell and on the laser fluence but also on the dimensions of the transfer capillary.
The design of a dedicated LA-AMS system is therefore a complex optimization process. In this section, the general requirements and the design considerations of the LA-AMS setup are presented, separated into its three main parts:
-
1. Laser system with beam delivery optics and sample observation unit;
-
2. LA cell that houses the sample and where the CO2 is produced; and
-
3. AMS with its gas ion source where the CO2 is converted to negative C ions.
Laser System and Sample Observation
For constructing a LA-AMS setup, a laser source with a high CO2 conversion efficiency is required. An argon fluoride excimer laser (GeolasC, λ=193 nm, Microlas GmbH, Göttingen, Germany), a Nd:YAG laser (LSX213, 5ω, λ=213 nm, CETAC Technologies, Omaha, USA), and a Nd:YAG laser (LSX500, 4ω, λ=266 nm, CETAC Technologies) were first compared with respect to their CO2 conversion efficiency, revealing that the excimer setup is most efficient with a conversion efficiency of 70±6%, while for the LSX213 laser 44±2% and for the LSX500 30% were achieved. The value found for the LSX213 is on the same order as the one determined by Rosenheim et al. (Reference Rosenheim, Thorrold and Roberts2008), but below the value found by Wacker et al. (Reference Wacker, Muensterer, Hattendorf, Christl, Guenther and Synal2013). In both studies, the same wavelength and a comparable laser fluence were used. Due to its high CO2 conversion efficiency, a pulsed argon fluoride excimer laser (Ex5, Argon Fluoride 193 nm, GAM LASER, Orlando, USA) with maximum output energy of 12 mJ per pulse and a pulse length between 6 and 8 ns was used for this setup. The pulse repetition rate ranges from 20 to 250 Hz and the laser beam is rectangular shaped with 3×6 mm2 in size. For all subsequent experiments, the laser energy was varied between 0.8 and 2 mJ, resulting in fluences on the sample between 1 and 2.5 J/cm2 (corresponding to an irradiance between 0.14 and 0.36 GW/cm2). The repetition rate of the laser was adjusted between 200 and 250 Hz. The typical laser settings for LA-AMS measurements are listed in Table 1.
Table 1 Typical laser settings during LA-AMS measurements.

The optical system directs the beam to the sample surface by using four 45° dielectric mirrors and an objective lens with a focal length of 55 mm. The lens is mounted in front of the steering mirror on a translation stage that allows changing the focus position relative to the sample surface. The laser beam is focused onto the sample surface at an angle of incidence of 45°, producing craters of rectangular shape and dimensions of 110×680 µm2. An observation unit consisting of a monochrome CCD camera (AVT MANTA G-125B, Allied Vision Technologies, Stadtroda, Germany) and a zoom lens (OPTO TUBUS Z-1, 0/146, Opto, Gräfelfing, Germany) with a nominal working distance of 15 cm and a magnification of 0.72 to 4.23-fold is arranged above the steering mirror to view and position the sample with respect to the laser beam. The optical setup presented here allows the observation of low-contrast samples. Illumination is supplied by an in-house fabricated ring-illumination consisting of 16 white LEDs with a luminous intensity of 18 cd and an angle of radiation of 22°. A linear polarizer with N-BK7 protective windows suitable for 400–700 nm is placed between the zoom lens and the illumination unit to minimize stray light.
The LA Cell and Gas Handling
The shape and size of the LA cell can influence the aerosol formation and transport from the ablation site to the ion source of the mass spectrometer. In order to increase signal intensities and thus to reduce measurement times as well as cross-contamination, an LA cell with short washout times at low gas flow rates was developed. Besides the need for a small cell volume, the capability of hosting large samples is desirable for LA-AMS. This was achieved by constructing a compound system that consists of two parts: the ablation head (A in Figure 1) where the aerosol expansion takes place and the sample box (B in Figure 1) where large samples with dimensions of up to 150×25×15 mm3 can be placed. The inner volume of the ablation head is kept small with approximately 600 µL to ensure rapid gas exchange. Possible cross-contamination by particles formed during previous laser pulses is minimized by placing the sample surface vertical so that aerosol particles preferably settle in the lower part of the ablation head, where remobilization by subsequent laser pulses is minimized (compare Figure 2). Similarly, particle deposition on the cell window is reduced by placing it perpendicular to the sample surface out of the direction of aerosol expansion. The stopping distance for the expanding particles was estimated from the ambient pressure and the laser energy (compare Bäuerle Reference Bäuerle2000) yielding 2.5 mm for 1 bar and a laser energy of 0.5 mJ on the sample, therefore ensuring that most particles will be stopped before reaching the window.
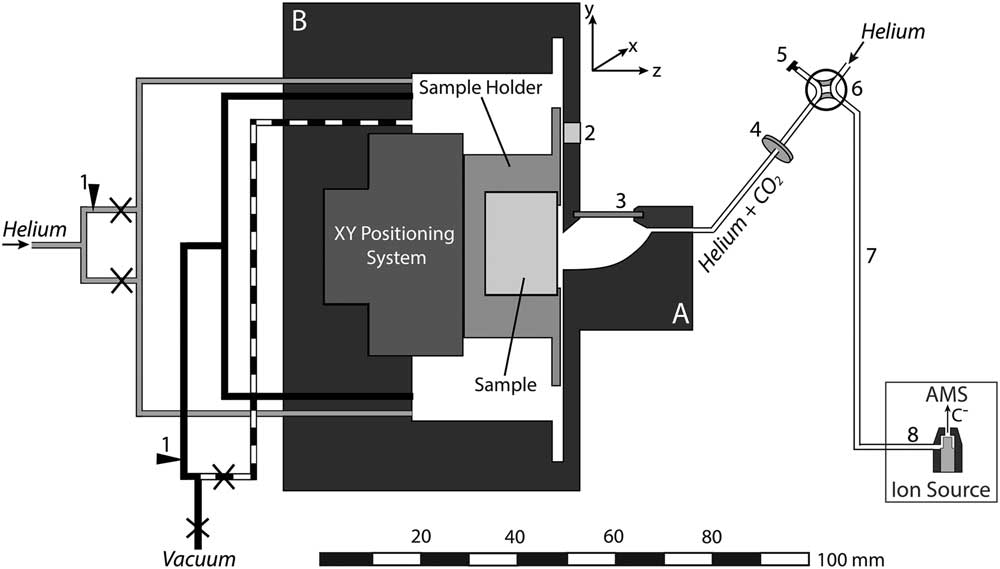
Figure 1 Schematic overview of the LA-AMS setup. The LA cell consists of two parts: the ablation head (A) and the sample box (B). Black and dashed lines represent the vacuum system, gray lines the helium connections, and white lines the connection between the ablation head and the ion source. Legend: 1. flow adjustment, 2. pressure sensor, 3. window, 4. filter, 5. cap, 6. four-way valve, 7. LA-AMS capillary, 8. capillary in ion source,×shut-off valve.
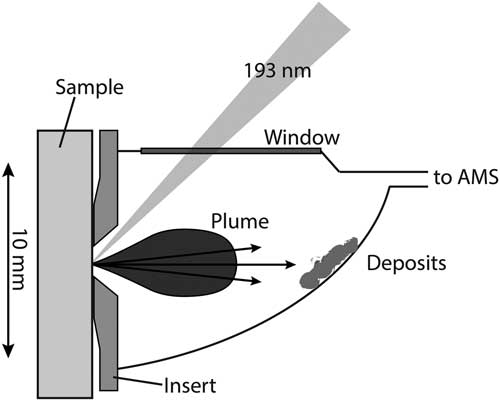
Figure 2 Enlargement of the ablation head. The focused laser beam entering through the window at an angle of 45° is indicated. Furthermore, the ablation plume and emitted particles and resulting deposits on the cell wall are shown. The insert reduces the gap between the ablation head and the sample resulting in a higher flow resistance for gas from the ablation head to the sample box.
The ablation head is made of aluminum and anodized in black to minimize light reflections and thus improve sample observation. The window with an effective area of 12×2 mm2 has a thickness of only 0.5 mm to reduce absorption and distortion of the laser beam. Window materials tested with the LA-AMS setup were CaF2 and fused silica, both with 45° antireflection coating for 193 nm on both sides. The CaF2 window showed only a slightly longer lifetime with respect to deterioration by the laser beam.
In order to further manipulate the gas dynamics and especially reduce CO2 losses into the sample box, exchangeable inserts made from aluminum can be mounted to adjust the spacing between the ablation cell and the sample surface. The sample is placed in a specifically designed sample holder unit that can be retracted easily for sample exchange. A set of up to 20 tension springs is mounted in the bottom part of the holder (not shown in Figure 1) to press the sample specimen against the rim of a 0.5-mm-thick steel plate mounted on top. This setup allows an accurate positioning of the sample surface relative to the ablation head. An x-y positioning system (SLC, SmarAct GmbH, Germany) consisting of two linear positioners both equipped with nanosensors (resolution of approximately 1 nm) and a step width in the sub-nanometer range is placed in the sample box. The linear positioners can reach velocities up to 13 mm/s and have maximum travelling distances of 180 mm and 29 mm. Since the y-positioner is moving vertically, it is equipped with a constant force spring that compensates for a mass of 200 g, which results in an overall allowable load of 550 g for vertical movement.
For a given CO2 production rate by LA, the mass transfer from the ablation spot to the ion source is determined by the helium pressure in the LA cell and the flow resistance of the transfer capillary. The ability of adjusting the pressure inside the LA cell is crucial for controlling the gas flow rate into the ion source and thus the measurement conditions during LA-AMS. The setup of valves, capillaries, and pressure sensor is depicted in Figure 1. The black lines represent stainless steel vacuum capillaries with an inner diameter (I.D.) of 2.5 mm. Upstream of the pump, the line is split in two, one that is connected to a gas flow controller (model 100, VICI Company, Houston, USA) to adjust a flow rate between 0 and 250 mL/min, and one without flow restriction (dashed line). The gas flow controller allows controlled evacuation and therefore to maintain a specific cell pressure during the measurement. The lines can be individually closed and thus either reduced pumping or no evacuation can be applied during analysis, while full speed pumping is used to flush the cell volume. The helium gas supply (gray lines) is also split into two capillaries, one connected directly to the LA cell and the other one equipped with a needle valve for adjusting the flow rate into the cell (2–19 mL @ 40 psi N2 inlet, nonlubricated, Vici). After the cell outlet a combination of two filters (stainless steel replacement frits. Valco, pore size: 0.5 µm, thickness: 0.75 mm and 0.5 µm, thickness: 1 mm) is inserted to avoid particulate matter reaching the ion source. To isolate the LA unit and during preconditioning of the AMS gas target, it can be bypassed via the four-way valve. A pressure sensor (Keller, PAA-33X/1bar/80794, 0.001–1 bar measurement range) is mounted directly on the cell.
For a given cell pressure, the flow rate into the AMS is determined by the capillary, which is installed between the four-way valve and the ion source (“6” in Figure 1). Two different capillaries, made of deactivated fused silica with a length of 110 cm and an I.D. of 250 µm and 100 cm length and an I.D. of 150 mm, were tested.
AMS with a Gas Ion Source
For the 14C analyses, the ETH Zurich Mini Carbon Dating AMS system (MICADAS) operating at a terminal voltage of 200 kV is used (Synal et al. Reference Synal, Stocker and Suter2007). The MICADAS is equipped with a hybrid ion source allowing to measure graphite as well as CO2 (Ruff et al. Reference Ruff, Wacker, Gaeggeler, Suter, Synal and Szidat2007). The ion source is equipped with a steel capillary of 250 µm I.D. and 64 cm length (“7” in Figure 1) that guides the gas samples from the fused silica LA capillary to the inlet of the sputter targets. The sputter targets consist of an aluminum cap with a titanium insert. The CO2 is guided to the top of the Ti insert where the interaction with a focused Cs+ ion beam leads to the formation of secondary C– ions that are extracted for final 14C/12C analysis. We note that the conversion of CO2 into negatively charged carbon ions under the influence of the primary Cs+ beam in the AMS gas ion source is referred to as sputtering throughout the manuscript. The sputtering efficiency is highly sensitive to the Cs+ density (compare Fahrni et al. Reference Fahrni, Wacker, Synal and Szidat2013), the gas supply rate, and the CO2 concentration. A fast beam pulsing system after the ion source allows to measure the different C isotopes quasi-simultaneously (Synal et al. Reference Synal, Stocker and Suter2007).
The ultimate measure of the performance of the LA-AMS setup is the C ion current measured with the AMS. Therefore, the characterization of the LA-AMS setup was based on monitoring the 12C ion current (12CLE), which is measured right after the low-energy magnet following the ion source and is an indicator for the overall performance of the ion source and the carbon ion collection efficiency.
Before each LA experiment, similar sputtering conditions were established by following a fixed tuning procedure, using the gas interface system (GIS) (Ruff et al. Reference Ruff, Wacker, Gaeggeler, Suter, Synal and Szidat2007). To ensure proper working conditions of the gas ion source, two to three gas standards (SRMs NIST Ox-I or NIST Ox-II standard) were measured before every LA-AMS run. Subsequently, two conventional gas blanks (5% CO2 in helium, Messer Schweiz AG, Lenzburg, Switzerland) were analyzed to allow for a correction of the instrumental background.
A typical LA-AMS measurement sequence then starts with preconditioning of the sputter targets for 30 to 60 s with the LA cell bypassed and helium introduced into the ion source to clean the sputter target. Subsequently, the laser is switched on and the produced CO2 is transported with helium from the LA cell into the ion source where negative C ions are produced and finally the 14C is collected. For all measurements, the integration time for 14C/12C data was set to 10 s. The period of data acquisition is limited by the lifetime of the gas targets, which depends on the Cs density and the magnitude of the ion current and is in our case typically 10–20 min.
SAMPLE PREPARATION AND SAMPLE MATERIALS
Sample Preparation
Samples are introduced into the sample holder by placing them on top of the tension springs and retaining them with the upper steel plate, which is mounted with 12 screws. Several samples can be placed next to each other, but gaps between different pieces need to be avoided in order to create an even surface at the ablation region. For the same reason, samples that were smaller than the sample holder have been embedded in epoxy resin. In order to avoid potential contamination from the epoxy intruding the potentially porous material, the samples are tightly wrapped in polyethylene foil and placed into a rectangular aluminum form. The epoxy preparation (Epoxi Fix Kit, Struers) is then poured over the sample and allowed to cure for 24 hr. Finally, the sample is removed from the form, the epoxy is cut into the desired dimensions, and the wrapping film is taken off. Samples in the form of carbonate powder (e.g. reference materials) can be pressed using a hydraulic press (Specac, Portmann instruments AG, Biel-Benken, Switzerland) with a pressing force of 15 tons into molds made of stainless steel (width: 5 mm, length: 18.5 mm, depth: 1 mm) and placed in the sample holder for analysis.
Standard and Reference Materials
A summary of all sample materials used in the following experiments is given in Table 2. For characterization of the LA-AMS setup, a surface-polished, rectangular piece of marble (Natursteine Wüst, Zurich, Switzerland) was fit tightly into the sample holder. This sample is used as a 14C blank. A certified carbonate standard material used with LA-AMS is the IAEA C2 powdered travertine standard with a nominal F14C value of 0.4114±0.0003 (Rozanski et al. Reference Rozanski, Stichler, Gonfiantini, Scott, Beukens, Kromer and van der Plicht1992). Here, F14C represents the activity ratio of the sample relative to a modern reference material (Edwards et al. Reference Edwards, Gallup and Cheng2003; Reimer et al. Reference Reimer, Brown and Reimer2004). Furthermore, an in-house coral powder standard (CSTD) with a nominal value of 0.9445±0.0018 (n=262) is used (Gao et al. Reference Gao, Xu, Zhou, Pack, Griffin, Santos, Southon and Liu2014). Finally, a piece of a stalagmite was powdered in a ceramic mortar and homogenized and is used as in-house standard. Five subsamples of the in-house standard were analyzed by conventional gas measurements, yielding a F14C of 0.871±0.007. Furthermore, a bamboo coral sample was cut into two sections. The mean F14C along the entire growth axis had been determined conventionally to be 0.329±0.001 (Klaus-Tschira-Archäometrie-Zentrum, Mannheim, Germany).
Table 2 Overview of the different materials used for LA-AMS and their 14C content.

RESULTS AND DISCUSSION
The following section is divided into two main parts: the first part covers the instrumental characterization of the LA-AMS setup where the CO2 production as well as sensitivity and signal stability are investigated. The key findings are subsequently combined and discussed. The second part covers 14C analyses using LA-AMS and, thus, analytical aspects such as the blank level, the reproducibility of reference materials, washout behavior of the LA cell, and the effect of cross-contamination. Finally, LA-AMS scans on a natural sample are presented and the key points of the analytical aspects for LA-AMS are summarized and discussed.
Instrumental Characterization
CO2 Production by LA
The ablation rate, i.e. the mass of carbonate removed per laser pulse, depends on the fluence of the laser and on the density of the sample material. The ablation rate of the laser system for a marble sample was determined using a repetition rate of 200 Hz, a fluence of 1.8 J/cm2, a lateral velocity of 10 µm/s, and a spot size of 110×680 µm2. The mass of the sample was determined before and after ablation by weighing (Mettler AE 163, Mettler-Toledo, Greifensee, Switzerland). Five replicates were carried out and the mean ablation rate, determined from the mass difference and laser pulses applied, was 8.1±0.4 ng CaCO3 per pulse, corresponding to 97±5 µg CaCO3/min. The gas phase formed during the ablation can be expected to mainly consist of CO2. Of greatest importance for the coupling of LA with AMS is the CO2 conversion efficiency, which represents the proportion of ablated material actually converted into gaseous CO2 and determines the achievable sensitivity for the 14C analyses per unit volume of material.
The CO2 conversion efficiency of the LA-AMS unit was estimated using LA quadrupole (Q)-ICPMS. The aerosol formed during ablation of a carbonate sample was analyzed by the ICPMS (Elan 6000, Perkin Elmer, Waltham, MA, USA) directly and after filtering (0.4-µm pore size, Millipore, Billerica, MA, USA) the particulate matter from the aerosol. By monitoring Ca in the ICPSMS, which is present in the particle phase, it could be confirmed that the particles were effectively filtered out. The respective signal intensities allow determining the respective fractions of carbon present in the gaseous and solid phase. The production efficiency was found to be only marginally dependent on laser fluences between 0.5 and 2 J/cm2 (here, the laser energy was altered while the spot size was kept constant) with a mean of 53±2% (Figure 3), which is somewhat above the value observed in the study described earlier. The discrepancy is most likely caused by the much higher laser fluences that were applied in that study.

Figure 3 The CO2 conversion efficiency of the Ex5 laser system as a function of the fluence. The solid line represents the mean value of the four measurements and the dashed lines indicate the standard error.
Sensitivity and Signal Stability
It was found that for LA-AMS measurements significantly higher carrier gas flow rates compared to conventional gas measurements are necessary in order to reach sufficiently high ion currents for 14C analysis. The total gas flow rate of the LA-AMS system was determined by establishing a calibration between the gas flow rate and the pressure in the ion source using a mass flow controller (MCC-2SCCM-TFT, Alicat Scientific, Tucson, USA). The ion source pressure observed during LA-AMS measurements ranges from 2.7×10⁻⁶ to 3.6×10⁻⁶ mbar, corresponding to a calibrated gas flow rate from 1.1 to 1.7 mL/min. In a next step, the C-flow rate from the LA cell into the ion source was determined. It can be derived from the CO2 concentration and the total gas flow rate. Different CO2 concentrations in helium were prepared from a 5% CO2 in helium mixture (Messer Schweiz AG, Lenzburg, Switzerland) to a total pressure of 1200 mbar in the LA cell. These mixtures were introduced into the gas ion source at a gas flow rate of 1.5 mL/min and the signal was collected for 5 min. For each measurement, the average ion current during the last 50 s of the 5 min was evaluated in order to ensure stable measurement conditions. The results are depicted in Figure 4 where the 12CLE current is plotted against the C-flow rate. The error bars represent the variability of the ion current and are an indication for the stability of the measurement. Each data point corresponds to one measurement, because the performance of the instrument changes slightly over the course of a measurement day as well as from day to day. Nevertheless, the overall behavior as shown in Figure 4 could be reproduced (the same is true for Figure 6). Between 1 and 4 µg/min, the efficiency is constant and the ion current increases with an increasing C-flow rate, reaching a maximum at approximately 4 µg/min. For even higher C-flow rates, the efficiency decreases resulting in a drop of the ion current. This relation between the ion current and the C-flow rate is a complex process that has previously been observed and described by Fahrni et al. (Reference Fahrni, Wacker, Synal and Szidat2013).

Figure 4 Ion current as a function of the C-flow rate. The error bars indicate the ion current range and, thus, represent the signal stability. The pressure in the cell was kept constant resulting in a gas flow rate of 1.5 mL/min. The maximum ion current is found at a C flow of ~4 µg/min.
During optimized LA-AMS measurements, typical 12CHE currents between 10 and 20 µA have been observed. A decrease in the laser repetition rate resulted in nearly every case in a simultaneous decrease of the ion current. Thus, based on the calibration curve (Figure 4), the CO2 concentration in the He gas supplied by the LA system can be estimated to be in a range of 2 to 4 µg/min. Fahrni et al. (Reference Fahrni, Wacker, Synal and Szidat2013) showed that for conventional gas measurements the optimum C flow is between 2 and 3 µg/min, which is of similar magnitude as for the LA-AMS setup, even though the total gas flow rate applied during LA-AMS measurements is 1 order of magnitude higher.
Routine gas measurements have shown that not only the magnitude of the ion current but also the stability of the gas measurements depend on the C flow. Two different transient ion signals observed during LA-AMS are shown in Figure 5. The behavior for the optimum C-flow range is depicted in panel (a): a quick rise of the 12C current occurs when the ablation is started, followed by a slow increase of the signal intensity. If the C flow is lower than the optimum range, much lower initial ion currents are obtained with a subsequent steep increase as displayed in panel (b). A third case that has rarely been observed during LA-AMS is a C-flow rate above the optimum, i.e. larger than 4 µg/min. This results in a first quick and very steep rise of the current followed by signal drop. The different transient behaviors of the ion current are so far not understood and are most likely caused by complex processes (i) during the extraction of CO2 from the LA site and (ii) those occurring in the ion source. Possible explanations for the different C-flow rates obtained during LA-AMS, even when laser and gas flow settings were kept constant, are discussed in the next section.

Figure 5 Depending on the C-flow rate into the ion source, one of the following cases occurs: (a) Optimum conditions cause a quick rise in the 12C current, which is followed by a steady signal. (b) A low C flow results in a slow and steady signal rise. The current increase at 2.5 min is caused by an increase in the helium background pressure in the LA cell. For both cases, LA was used as a sample introduction technique.
Two capillaries (“6” in Figure 1) of different I.D. and length were alternatingly installed between the LA cell and the ion source. For each capillary, the helium background pressure in the cell was varied while the laser parameters were kept constant at the values listed in Table 1, and the corresponding ion current was collected for approximately 3 min. All measurements were performed on the marble sample and maximum ion currents for both capillaries were on the order of 14 µA but at different LA-cell pressures as shown in Figure 6. For capillary 1, higher cell pressures (900–1100 mbar) compared to capillary 2 (500–700 mbar) were necessary to reach comparable C-flow rates and, thus, maximum ion currents. Routine LA-AMS measurements showed that the longer the capillaries were in use, the higher the LA-cell pressure had to be in order to maintain the gas flow rates. This is due to gradual clogging of the capillary as a result of laser produced particles that are fine enough to pass through the filters and sediment along the capillary. Capillary 2 with the larger I.D. has shown to be more suitable for the LA-AMS setup as it clogs much slower.

Figure 6 Ion current dependence on the helium background pressure in the LA cell for two capillaries with different flow resistances. The maximum ion current is reached at different pressures for the two capillaries.
Overall Considerations
Using the CO2 conversion efficiency of 53±2% and considering the ablation rate of 97±5 µg/min of CaCO3 when operating at a repetition rate of 200 Hz, a CO2 production rate of 23±3 µg/min can be calculated, corresponding to 6.2±0.9 µg carbon/min. In order to assess the overall efficiency of the LA-AMS setup, the C produced by LA (6.2±0.9 µg) is compared to the amount of C that is transported into the ion source (2–4 µg C/min). It can be seen that there is a discrepancy between the produced and the transported carbon of 30–60%. Most likely, CO2 is lost in the LA cell through the gap between the inset and the sample surface (compare Figure 2) by diffusion. This loss can be reduced by increasing the helium gas flow rates (1–2 mL/min) into the ion source. Day-to-day variations of the gap size most likely result in changes in the CO2-transport efficiency from the LA cell into the ion source: a larger gap will result in a greater CO2 loss into the sample box, thus reducing the C flow into the ion source and vice versa. These variations are most likely the reason for the different transient behaviors that have been observed during LA-AMS measurements for the same measurement settings. A modification of the inset of the LA cell could reduce the CO2 losses into the sample box.
The negative ion yield calculated for the LA-AMS system is on the order of 4% and, thus, approximately 1.5 times lower than for conventional gas measurements as reported by Fahrni et al. (Reference Fahrni, Wacker, Synal and Szidat2013). Most likely, the high carrier gas flow rate applied for LA-AMS causes losses in the sputter targets, thus decreasing the sputtering efficiency. A comparison of the key parameters for conventional gas measurements and for the LA-AMS setup can be found in Table 3.
Table 3 Figures of merit of conventional gas measurements and of the LA-AMS system.

Radiocarbon Analyses with LA
14C analyses of natural samples using LA-AMS requires knowledge of the blank level, the washout of the LA cell, the effect of cross-contamination, as well as the accuracy, precision, and the reproducibility that can be achieved. These analytical aspects will be addressed in the following section.
Blank Level
The standard corrected blank values (Wacker et al. Reference Wacker, Christl and Synal2010) obtained for the marble sample with the LA-AMS setup are displayed in the left part of Figure 7 (solid and open black circles), where also the mean 12C current corresponding to each blank measurement is depicted (red triangles). Dashed vertical lines separate different days or indicate the reopening of the LA cell. The error bars are dominated by counting statistics with measurement times for each data point varying between 2.5 and 5 min. The laser settings were kept as similar as possible for the three measurement days (see Table 1 and caption of Figure 7). No obvious correlation between the 12C current and the blank level is observed, indicating that residual CO2 in the gas volume of the ablation cell is not the main reason for the higher F14C in the beginning of the experiment. The mean blank value including all data points results in an F14C of 0.013±0.004 (not shown in Figure 7). It can also be seen that the F14C-blank ratio is elevated at the beginning of a measurement day (open symbols). After a measurement time of approximately 15 min, it converges to a background mean level of 0.011±0.002 (gray area in Figure 7). This is significantly higher than the blank level of 0.006±0.002 (shaded area), which is normally reached with the conventional GIS. The initial elevation of the LA-AMS blank level on each measurement day is possibly caused by an exchange reaction between newly produced CO2 and CO2 previously adsorbed on the surfaces of the instrument, samples, or deposits is the major source of these deviations. After a sufficiently long exposure to CO2 with the same F14C, stable conditions are achieved.

Figure 7 LA-blank measurements (black dots) during 3 days and blank gas passed directly through the LA cell on 2 days (squares). The open symbols represent the first 15 min of measurement on each day and were excluded from calculating the mean blank value and its standard deviation (gray area). The shaded area corresponds to the conventional gas blank level. Furthermore, the 12C current (triangles) corresponding to each blank measurement is depicted. Laser settings are equal to those in Table 1. The pressure in the LA cell was set as follows: 200–500 mbar (capillary 2) on day 1, 500–1100 mbar (capillary 1), and 300–900 mbar (capillary 2) on day 2, 550–1100 mbar (capillary 1) on day 3.
Blank gas has also been passed directly through the LA system at different cell pressures and at different CO2/He mixtures and then introduced into the ion source. The results obtained for two measurement days are shown in the right panel of Figure 7 where the open symbols represent the first 15 min of each day. Again, the initial blank level for each day is elevated, which confirms the assumption of gas exchange reactions taking place. Considering only the data points after the first 15 min, a F14C mean blank level of 0.008±0.004 is yielded for the blank gas. This blank level is in the same order as the blank level from conventional gas measurements and is an indication that the higher blank value observed during LA measurements in comparison to conventional measurements is the result of the LA process. Residual CO2, adsorbed on the sample surface or the LA-cell interior that successively is removed by shockwaves formed by LA, desorption by light, or heat generated during the laser pulse, might be the reason for the elevation of the LA-AMS blank level.
Washout and Cross-Contamination
The washout of the LA cell is depicted in Figure 8 after ablating a carbonate sample for 30 min. Once the laser is turned off, the signal drops from 11 to 0.6 µA within 30 s, corresponding to a time constant for washout of 6 s. The subsequent drop is much slower and until the lifetime of the target was reached (~23 min), the level is still elevated compared to the current of <0.1 µA typically reached with helium on a cleaned target after presputtering with Cs (dashed line). This elevation can be explained by CO2 that escaped during the measurement into the sample box of the LA cell where it built up to a concentration that causes this higher current. Therefore, between the measurements of different samples, the LA cell is evacuated and flushed with helium in order to avoid the carryover of CO2 from the previous sample.

Figure 8 Washout behavior of the LA cell after lasing for 30 min, which is an exceptionally long lifetime fo the sputter target. The dashed line indicates the background level of the ion current, which normally reaches 0.1 µA after presputtering.
The effect of cross-contamination of the LA-AMS system was investigated in a study and the results are summarized in Figure 9. Laser and cell parameters were set to maximize the 12CLE currents (settings as in Table 1 with capillary 1). Three samples with different 14C content (marble, IAEA-C2, and the stalagmite in-house standard) were measured in the order indicated on the x axis of the figure. Each data point corresponds to the average of signal collection between 3 and 6 min. Between samples, the cell was evacuated and flushed with helium three times in order to minimize the level of residual CO2 from the previous sample. The F14C of the blank sample after the measurement of a standard is elevated by a factor of more than 4 and that this effect increases with time. When measuring a standard after a blank sample, the same effect is observed: the first standard analysis results in a lower F14C. This is especially pronounced for the stalagmite standard, which has the highest 14C content. A longer evacuation and flushing procedure between a standard and a blank sample did not lower the initial F14C ratio measured for the blank. It is likely that some equilibration between the newly produced CO2 and CO2 previously adsorbed on the surfaces of the instrument, samples, or deposits is the major source of these deviations. As observed above for the blank levels, stable conditions are achieved after a sufficiently long exposure to CO2 with the same F14C.

Figure 9 Study of the effect of cross-contamination during LA. Blanks measured directly after standards are elevated. The same can be observed for standards measured after blanks. The gray band represents the blank range normally yielded for LA-AMS measurements. For the standard materials, the standard deviation of the nominal value is shown (gray lines).
Reproducibility of Analyses of Reference Materials
As no matrix matched 14C standards for carbonates are available, pressed IAEA C2 and CSTD powder were used to investigate how accurate nominal values of reference materials can be reproduced using the LA-AMS setup. Ion currents yielded for the pressed carbonate powder were comparable to those of the marble sample. The measurement parameters were as listed in Table 1 and the results are shown in Figure 10. The CSTD standard was measured multiple times on four measurement days. The measurement precision for the single days was calculated to be between 0.7% and 1.1%, yielding a mean F14C of 0.94±0.01, which matches within 1 standard deviation the nominal value of 0.9445±0.0018. Eight replicates of the C2 standard on two measurement days yielded a mean F14C of 0.410±0.009, which matches within 1 standard deviation the reference value of 0.4114±0.0003. Measurement precisions reached for the 2 days were 2.9% and 0.3%, respectively. The low precision obtained on day 5 is due to low ion currents attained that day. The three values from day 6 (open symbols) are from the two measurement sequences from the previous experiment shown in Figure 9 excluding the first data point. Furthermore, eight replicates of the in-house prepared standard from a modern stalagmite yielded a F14C value of 0.84±0.01, which matches within 2 standard deviations with the value of 0.871±0.007 obtained from five conventional gas measurements. For the single days, the precision achieved was 1.5% and 0.8%. Again, measurements from day 5 showed much lower ion currents resulting in higher uncertainties, and the second data set (day 6) represented by open symbols is taken from the cross-contamination study (Figure 9) without considering the first data point after a blank measurement.

Figure 10 Measured F14C divided by the nominal value (referred to as “fraction nominal”) for three standard materials using LA-AMS. The open symbols represent data that are also shown in Figure 9. Solid vertical lines indicate different measurement days, while dashed lines represent the measurement of other samples in between. The solid horizontal line indicates the nominal value of the standards, dashed horizontal lines the standard deviation of the nominal value, and gray areas represent 1 standard deviation of the measured values.
LA-AMS Scans
A natural carbonate sample (bamboo coral) has been studied by comparing scans on two different sample sections. For this, the two sections of the coral labeled coral-1 and coral-2 have been prepared by embedding them in epoxy resin. On each subsample, two scans were performed as shown in Figure 11. The arrows indicate the scan direction. Each scan covered the same growth period but a different length on the coral. Therefore, normalized scan distances are used. The measurement parameters were as listed in Table 1 except for the repetition rate of 150 Hz and the lateral velocity, which was varied between 8 and 12 µm/s to ensure measurement times on the order of 10 min, corresponding to the typical lifetime of the sputter targets at the day of the measurement. The spatial resolution corresponding to the different scans ranges from 450–650 µm. When calculating the mean value of each subsample, the uncertainty resulting from counting statistics is in the order of 2%, while the scatter is around 3%. An optimized error is obtained, when adding an additional external error in the order of 1% to the propagated error. A reduced χ2 test was performed with all scans confirming that the means of the different scans are not significantly different (95% confidence limit). The mean F14C value of all four scans is 0.326±0.002, which is in very good agreement with the value of 0.330±0.001 derived from analyzing the coral by conventional graphite analysis.
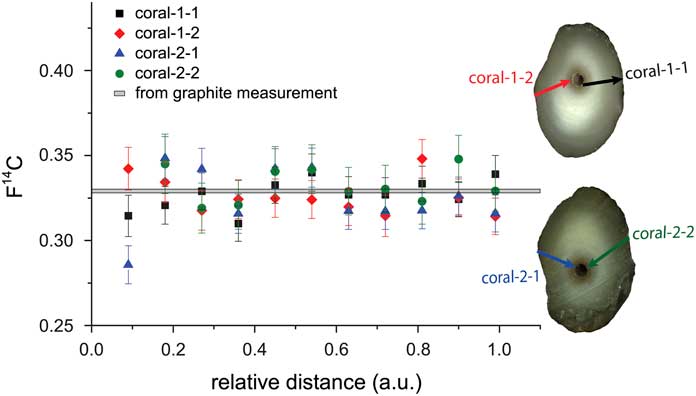
Figure 11 Comparison of four scans on two sections of a bamboo coral with the mean F14C value across the growth axis from conventional graphite measurements (gray band). The arrows indicate where the scans were performed and the arrow heads point into the direction of scan.
SUMMARY
The LA-AMS system allows to perform rapid survey scans on carbonate samples such as corals or stalagmites that contain the 14C signature of the record. The blank value of the LA-AMS setup is sufficiently low to allow 14C measurements of ages as low as 35,000 yr. Standards could be reproduced with a precision of better than 1% and reference materials matched nominal values within the uncertainties. Continuous scans offer a great flexibility regarding the spatial resolution and the measurement precision. When performing a survey scan at a lateral velocity of 10 µm/s, a section of 3.6 cm length can be analyzed in 60 min. With a laser repetition rate of 200 Hz, about 6 mg of the material will be consumed. When averaging data collected in 10 s, the spatial resolution corresponds to 200 µm and for a modern sample the measurement precision is in the order of 5% under the assumption of a negative ion current of 6 µA.
When performing continuous scans on natural samples with changing 14C content, washout and cross-contamination need to be considered, because the LA cell cannot be evacuated and flushed during the scan. As a result, the 14C signal can be altered by the washout. This effect could be reduced by designing a suitable inset for the LA cell that would allow minimizing CO2 losses into the sample box.
A significant effect of cross-contamination could be observed between samples of highly different 14C content. Since for naturally grown samples the difference in 14C content between two neighboring layers is significantly smaller, this carryover effect is less pronounced when performing continuous scans. Nevertheless, for future experiments a suitable data processing scheme should be applied where carryover correction is taken into account.
CONCLUSION
Conventional 14C analysis of carbonate samples by AMS requires time-consuming sampling and potentially contamination-prone chemical treatment. LA as a sampling technique for gas ion source AMS can overcome these drawbacks. A setup combining LA with AMS for the rapid online detection of 14C was built, and parameters for optimum operation were determined. A LA cell that allows the precise positioning of large samples relative to the laser beam and a gas handling system that enables controlled gas flow into the ion source were constructed. Typically, 8.1±0.9 ng of CaCO3 are ablated per laser pulse (equal to 97±5 µg CaCO3/min @200 Hz, 1–2.5 J/cm2, 680×110 µm2), and LE ion currents of up to 20 µA could be reached. The blank levels appeared to be independent on C– current and slightly higher than observed during conventional gas measurements. Nominal values of certified and in-house standards were reproduced within errors. Survey scans covering several centimeters per hour allow obtaining a rapid overview of the 14C imprint in a carbonate sample. Four individual, continuous scans on two sections of a natural bamboo coral sample resulted in a mean F14C of good agreement with the value derived from conventional graphite measurements.
Future developments will focus on design modifications that aim for a higher CO2 transport efficiency from the LA cell into the ion source to achieve a higher measurement precision. Although significant room for future improvement has been identified, the novel LA-AMS setup is readily applicable for accurate and precise 14C analysis of carbonate records at unprecedented spatial resolution.
ACKNOWLEDGMENTS
We would like to thank Philippe Trüssel and Thomas Mettler (both ETH Zürich, Switzerland) for their technical support in constructing the LA setup. We are grateful to Jens Fohlmeister and Norbert Frank (both University of Heidelberg, Germany) for providing sample material. Financial support given by ETH (Research Grant ETH-11 11-1) is gratefully acknowledged. We thank the editorial manager Mark McClure and two unknown reviewers that helped to improve this manuscript substantially.


