The safe disposal of high-level radioactive waste (HLRW) is a significant challenge for several countries. Deep geological repositories are recognized internationally as an effective method for the disposal of HLRW. Bentonite and its sand mixtures have been suggested as a geotechnical barrier between the metal canisters containing the waste and the host rock (Saiyouri et al., Reference Saiyouri, Tessier and Hicher2004; Gökalp et al., Reference Gökalp, Başaran and Uzun2011; Chen et al., Reference Chen, Zhu, Ye, Cui and Chen2016; Yigzaw et al., Reference Yigzaw, Cuisinier, Massat and Masrouri2016; Kaufhold et al., Reference Kaufhold, Dohrmann, Götze and Svensson2017). The large swelling capacity of bentonite results in low hydraulic conductivity and the ability to seal cracks even in contact with the partially fractured crystalline host rock (Kaufhold & Dohrmann, Reference Kaufhold and Dohrmann2016); this effectively restricts the migration of nuclides released from the repository. However, in the long-term interaction between the surrounding rock and the groundwater during the operation of a repository, some of the material is gradually dissolved in the groundwater to form a groundwater solution with a particular chemical composition (Ye et al., Reference Ye, Zhang, Chen, Chen and Cui2017; Yustres et al., Reference Yustres, Jenni, Asensio, Pintado, Koskinen, Navarro and Wersin2017). Infiltration of groundwater solution into the buffer/backfill material may modify its swelling properties. Therefore, prediction of the effects of salt solutions on the swelling properties of bentonite and its sand mixture is of great importance for the evaluation of the properties of the repository.
Numerous experimental studies on the swelling behaviour of bentonites in various salt solutions are available in the literature (e.g. Rao & Thyagaraj, Reference Rao and Thyagaraj2007; Komine et al., Reference Komine, Yasuhara and Murakami2009; Liu, Reference Liu2013). The salinity of groundwater has a strong inhibitory effect on swelling potential due to the influence on the diffuse double layer (DDL) (Yong & Mohamed, Reference Yong and Mohamed1992; Tripathy et al., Reference Tripathy, Sridharan and Schanz2004; Siddiqua et al., Reference Siddiqua, Blatz and Siemens2011; Liu, Reference Liu2013; Tripathy, Reference Tripathy, Bag and Thomas2014). When the ionic strength increases, the thickness of the DDL and the net repulsive stress between bentonite particles decrease, leading to a decrease in the swelling potential (Schanz & Tripathy, Reference Schanz and Tripathy2009; Tripathy et al., Reference Tripathy, Bag and Thomas2014; Xu et al., Reference Xu, Xiang, Jiang, Chen and Chu2014). The DDL model was valid in the cases of osmotic swelling when compacted bentonites were brought into contact with dilute salt solutions (Liu, Reference Liu2013; Xiang et al., Reference Xiang, Xu and Jiang2014). However, this model showed limitations for estimating the swelling of bentonites in concentrated solutions (Low, Reference Low1980; Viani et al., Reference Viani, Low and Roth1983; Yong, Reference Yong1999; Liu, Reference Liu2013).
The osmotic suction of the pores is also important for the deformation of compacted clays when they are in contact with a salt solution (Xu et al., Reference Xu, Xiang, Jiang, Chen and Chu2014). The increase in osmotic suction acts as an additional part of the effective stress that favours a decrease in the swelling potential of the compacted bentonite (Rao & Shivananda, Reference Rao and Shivananda2005; Rao & Thyagaraj, Reference Rao and Thyagaraj2007; Xu et al., Reference Xu, Xiang, Jiang, Chen and Chu2014). An equation for effective stress was proposed by Xu et al. (Reference Xu, Xiang, Jiang, Chen and Chu2014) that used osmotic suction to express quantitatively the influence of salinity on the volume change of clays. The volume change behaviour of a given bentonite in solutions with different salinities may be expressed by a unique e m–p e relationship, which provides a method to formulate the swelling properties of swelling clays in concentrated solutions.
Unlike with pure bentonite, sand content also affects the swelling state (Xu et al., Reference Xu, Matsuoka and Sun2003; Sun et al., Reference Sun, Cui and Sun2009). In these studies, bentonite–sand mixtures in distilled water showed two characteristic swelling states: (1) at low vertical pressure, montmorillonite in the mixtures was able to separate the sand particles and so to swell at the same e m as pure bentonite; and (2) at high vertical pressure, the sand particles were kept in contact and filled up the clay void, leading to a greater clay/void ratio than with pure bentonite. However, in a salt solution, the factors influencing the swelling characteristics are more complex and the swelling states are not well understood. Accordingly, the objectives of the present study were to investigate the effects of sand particles and pore fluids on the swelling states of bentonite–sand mixtures and to predict the swelling deformation of bentonite–sand mixtures in salt solution.
Materials and methods
Materials
The bentonite used in this paper was Kunigel-V1-Na+-bentonite, which is produced in Japan and contains 48% Na-montmorillonite (Table 1). The sand used is produced in the Fujian Province, China. The physical properties of the sand are: specific gravity, G s = 2.65, particle size, d = 0.5–1.0 mm, and SiO2 content, C s = 99.45%. Bentonite and sand were mixed under dry conditions, with the bentonite contents, α, of the mixtures being 40%, 50%, 70% and 100%. Distilled water and NaCl solutions with 0.5 and 1.0 mol/L were chosen, and they are abbreviated as DW, 0.5 M and 1.0 M, respectively, in the following figures and tables.
Table 1. Physical properties of Kunigel bentonite (Xu et al., Reference Xu, Matsuoka and Sun2003).

Confined swelling deformation test procedures
The distilled water was added to bentonite and its sand mixtures to a 16 ± 0.5% water content. Then, the wet soil was statically compacted to form 10.0 mm × 6.2 mm specimens with an initial dry density of 1.75 g/cm3 to ensure that they would swell in the deformation tests. Covered with two porous stones at the upper and lower surfaces, the compacted specimens were placed into the oedometer. The piston of the cell adjoined to the upper porous stone was kept in contact with the loading ram. After a vertical pressure (50, 100, 200, 400 or 800 kPa) was applied to the specimens, distilled water or NaCl solution was injected into the oedometer. The swell-compressive deformation of the specimens was recorded by the dial gauge with a precision of 0.001 mm. The specimens were considered stabilized when the reading on the dial was constant for 24 h. The vertical pressures were applied once, and only the monotonic swelling trajectories were analysed. The strain εs was defined as the percentage change in the specimen's height and the maximum strain (εmax) was defined as the strain at the final stable state (full saturation). εmax was assigned a positive sign for swell strain and a negative sign for compressed strain.
Nitrogen adsorption tests
After full swelling in salt solution, pure bentonite specimens were unloaded and oven-dried at 105°C for 24 h. Then, the dried specimens were homogenized and passed through a 0.03 mm sieve for the nitrogen adsorption test. The nitrogen adsorption tests were carried out using a Micromeritics ASAP 2020M surface analyser at 77 K to determine the surface fractality of bentonite.
Results and discussion
Swelling deformation tests
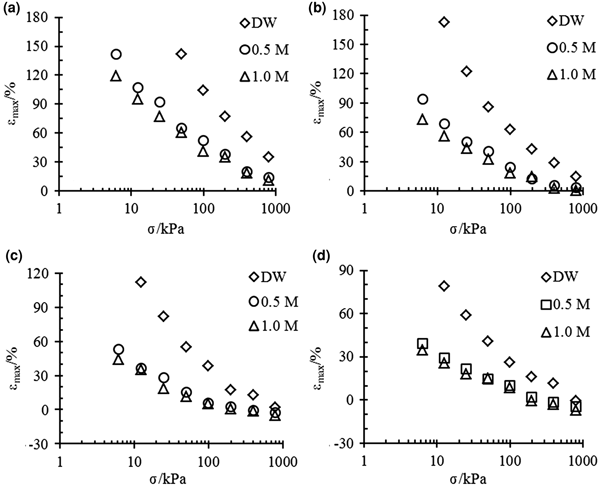
The relationships between the maximum strain εmax and vertical pressure σ for bentonite–sand mixtures with different bentonite contents are illustrated in Fig. 1. The bentonite content increased the swelling potential of the mixture, but the salt concentration of the pore fluid or vertical pressure reduced the swelling strains, even to the point of compression.
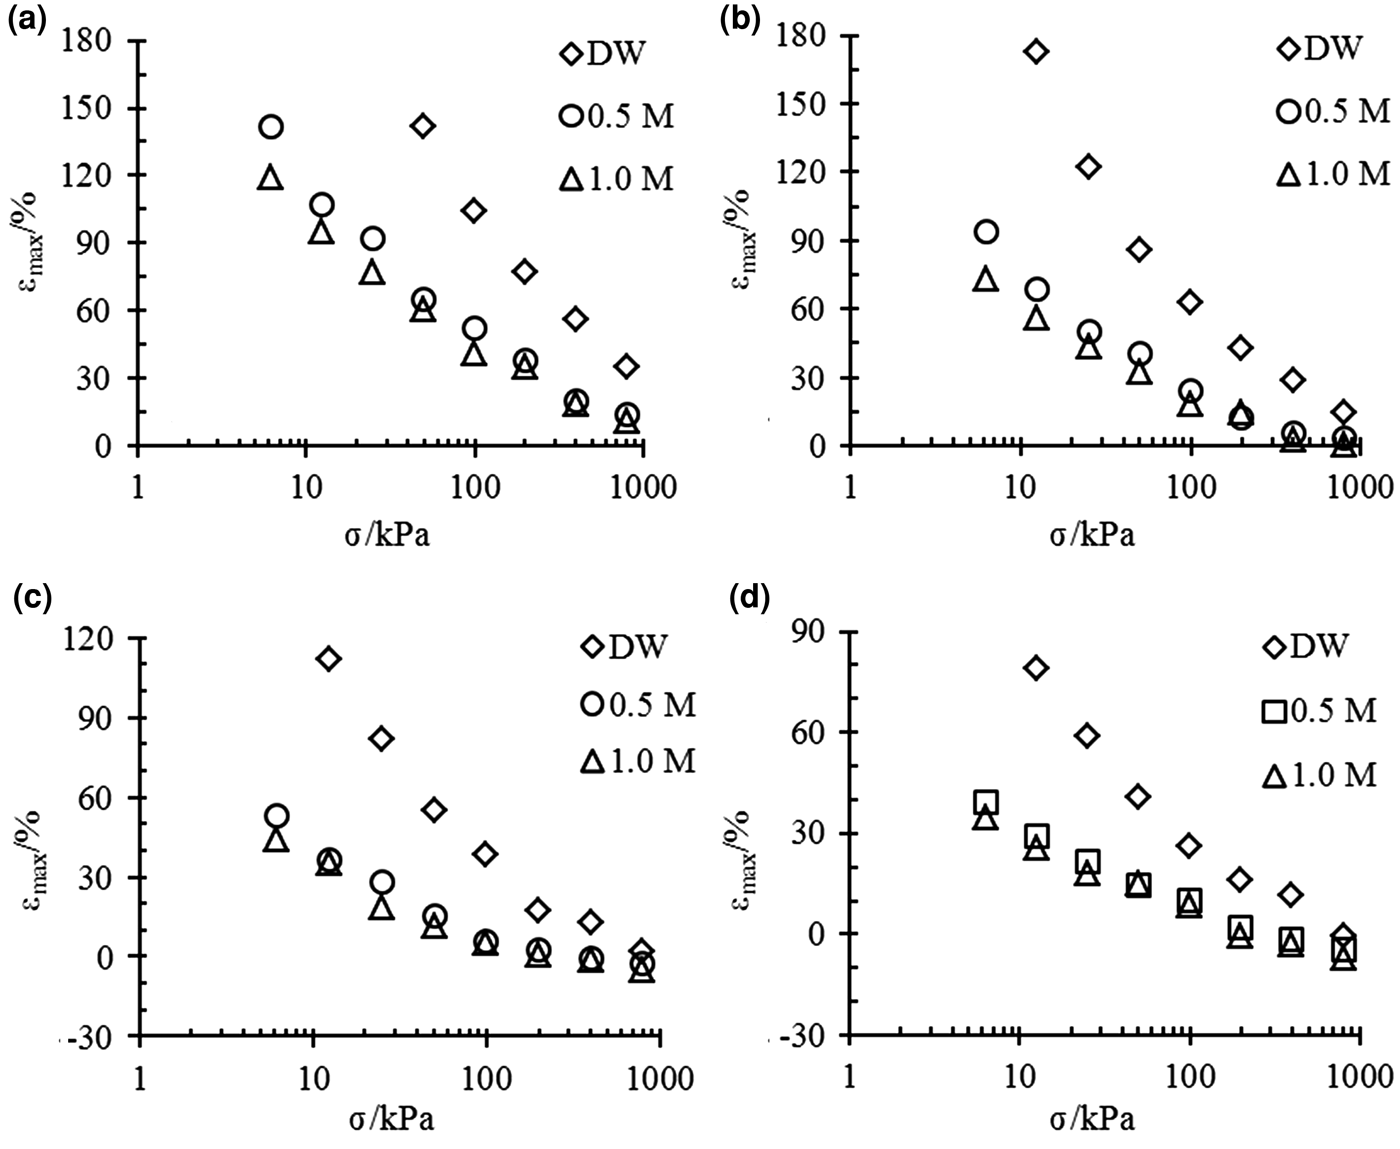
Fig. 1. εmax vs. σ for different bentonite–sand mixtures with (a) 100%, (b) 70%, (c) 50%, and (d) 40% bentonite contents in different solutions.
Pure bentonite (α = 100%) and the mixtures with 70% bentonite contents exhibit swelling strains in all of the experimental conditions (Fig. 1a,b).
The mixtures with 50% bentonite contents exhibited swelling strains in distilled water at all pressures, but in the 0.5 and 1.0 mol/L NaCl solutions, the mixtures experienced small compressed strains when the vertical pressure reached 400 kPa (Fig. 1c).
The mixtures with 40% bentonite contents experienced compression at 800, 400 and 200 kPa when they were saturated by distilled water, 0.5 mol/L and 1.0 mol/L solution, respectively (Fig. 1d).
The differences between the final strains of the same mixtures are large in different solutions under low pressures. However, the final strains are essentially the same for mixtures with small bentonite contents (40% and 50%) under high pressure.
The swelling deformation of the bentonite–sand mixtures can also be expressed by the void ratio of montmorillonite, e m, which is defined as (Sun et al., Reference Sun, Cui and Sun2009):
where V w and e are the water volume and the void ratio of the mixture at full saturation, respectively, V m is the montmorillonite volume, ρm is the grain density of montmorillonite, ρs is the grain density of the bentonite–sand mixture, α is the bentonite content in the mixture (mass %) and β is the montmorillonite content in the bentonite (mass %).
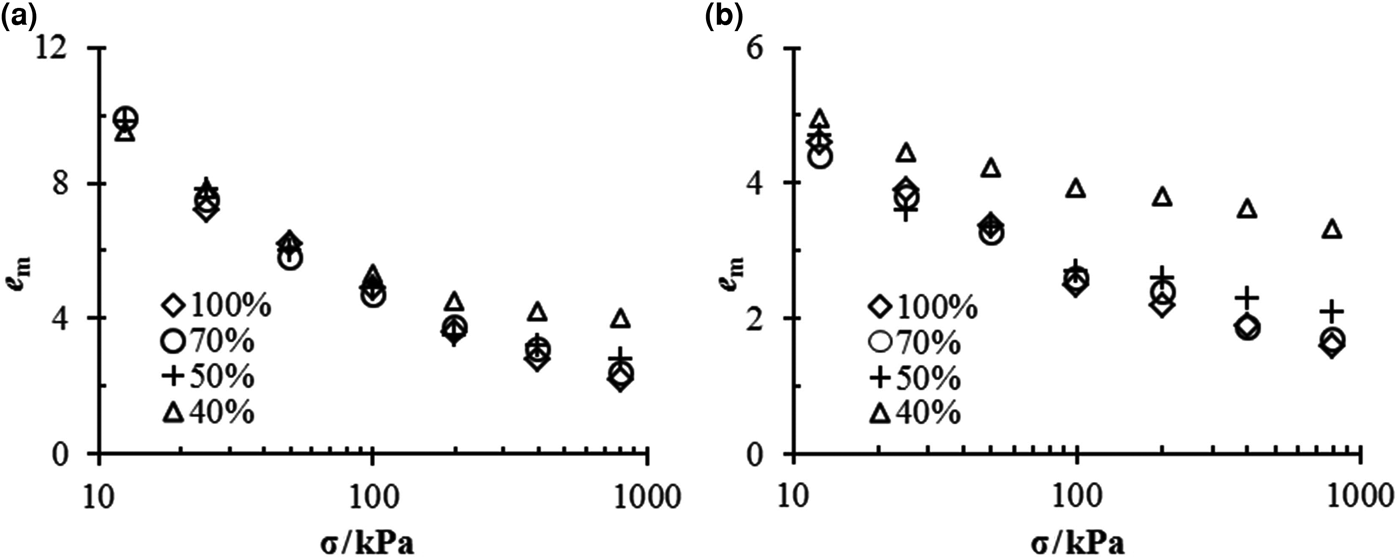
The e m–σ relationships for different mixtures in different solutions are shown in Fig. 2. Similarly to the swelling strain, the salt concentration or vertical pressure reduces the void ratio of montmorillonite, e m. However, in contrast to the swelling strain, e m tends to increase for mixtures with small bentonite contents.
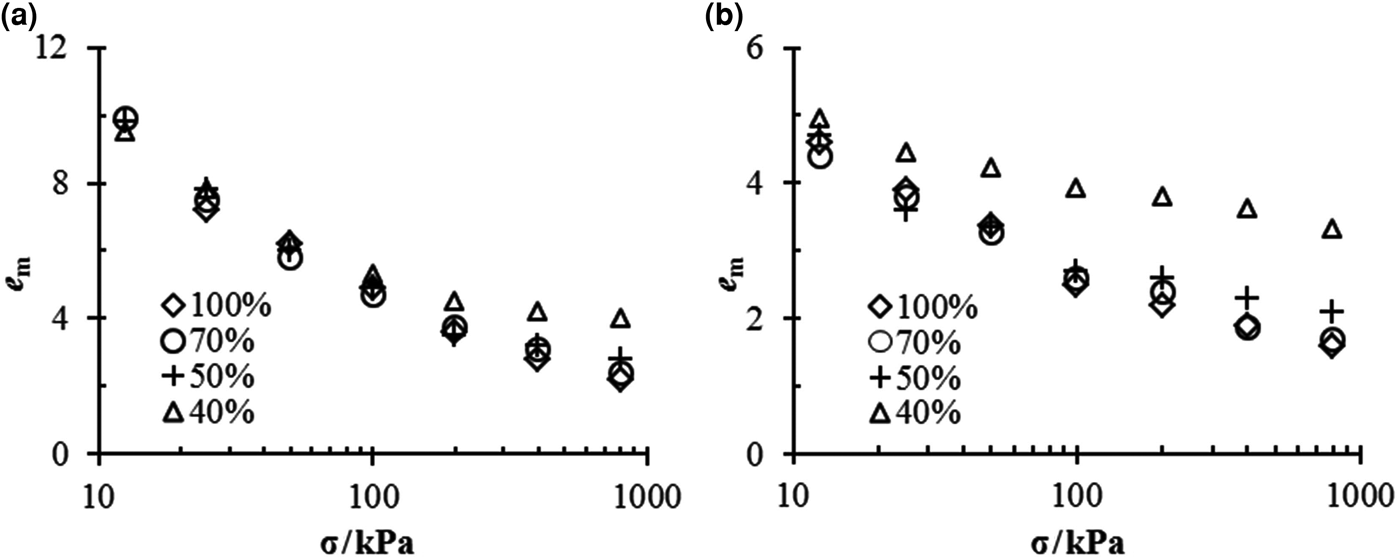
Fig. 2. e m vs. σ for bentonite–sand mixtures in (a) distilled water and (b) 1.0 M NaCl solution.
The mixtures with 70% bentonite contents always had the same e m as pure bentonite under the same experimental conditions.
In the case of distilled water, all mixtures exhibited essentially the same value of e m under low vertical pressure, but once the vertical pressure exceeded 50 kPa, the e m of the mixtures with 40% bentonite contents became larger than those of the remaining mixtures (Fig. 2a).
In 1.0 M NaCl solution (Fig. 2b), the mixtures with 40% bentonite contents always had the largest e m under any vertical pressure; in addition, when the vertical pressure exceeded 200 kPa, the mixtures of α = 50% exhibited larger values of e m than pure bentonite and mixtures of α = 70%.
em–pe relationship for mixtures in salt solution
The effective stress is generally defined as the net interactive force between soil particles, and in the case of the volume change of bentonite, it may be regarded as the interactive force between montmorillonite layers. In the case of distilled water, the effective stress, p e, is balanced by the vertical pressure, σ, loaded in swelling tests (Xu et al., Reference Xu, Xiang, Jiang, Chen and Chu2014). In comparison, saturation of bentonite specimens with inflowing salt solutions increases the osmotic suction in pore water, which in turn acts as an additional effective stress component (Rao & Thyagaraj, Reference Rao and Thyagaraj2007). Based on the surface structure of montmorillonite aggregates and montmorillonite layers, Xu et al. (Reference Xu, Xiang, Jiang, Chen and Chu2014) proposed a new formula for effective stress, incorporating the osmotic suction of pore fluid, which may be expressed as:
where σ is the vertical pressure applied on specimens, π is the osmotic suction of pore water and D s is the surface fractal dimension of bentonite. The surface fractal dimension is a descriptor used for characterizing the surface structures and irregularities of solid materials (Risović et al., Reference Risović, Mahović Poljaček, Furić and Gojo2008), which varies from 2 to 3. The larger the D s value, the more irregular and space-filling the surface (Helmy et al., Reference Helmy, Ferreiro, Bussetti and Peinemann1998). In bentonite swelling, the surface fractal dimension increases with increasing swelling strain (Xu et al., Reference Xu, Matsuoka and Sun2003).
The correlation of the void ratio of montmorillonite with effective stress is given by (Xu et al., Reference Xu, Xiang, Jiang, Chen and Chu2014):
where K is the swelling coefficient of montmorillonite. Equation 3 may be expressed in the bi-logarithmic form as:
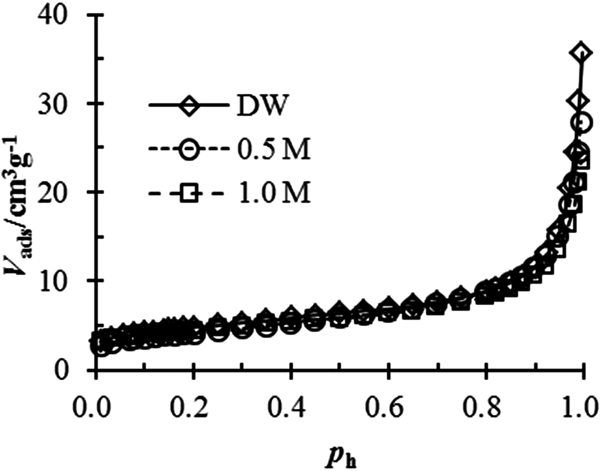
The surface fractal dimension of bentonite in salt solution is also determined using nitrogen adsorption. The nitrogen adsorption isotherms of the bentonite tested in various solutions are shown in Fig. 3. Then, the fractal dimension may be calculated by the Frenkel–Halsey–Hill equation:
where V ads is the nitrogen adsorption volume, B is the nitrogen adsorption coefficient of bentonite and p h is the equilibrium relative pressure.
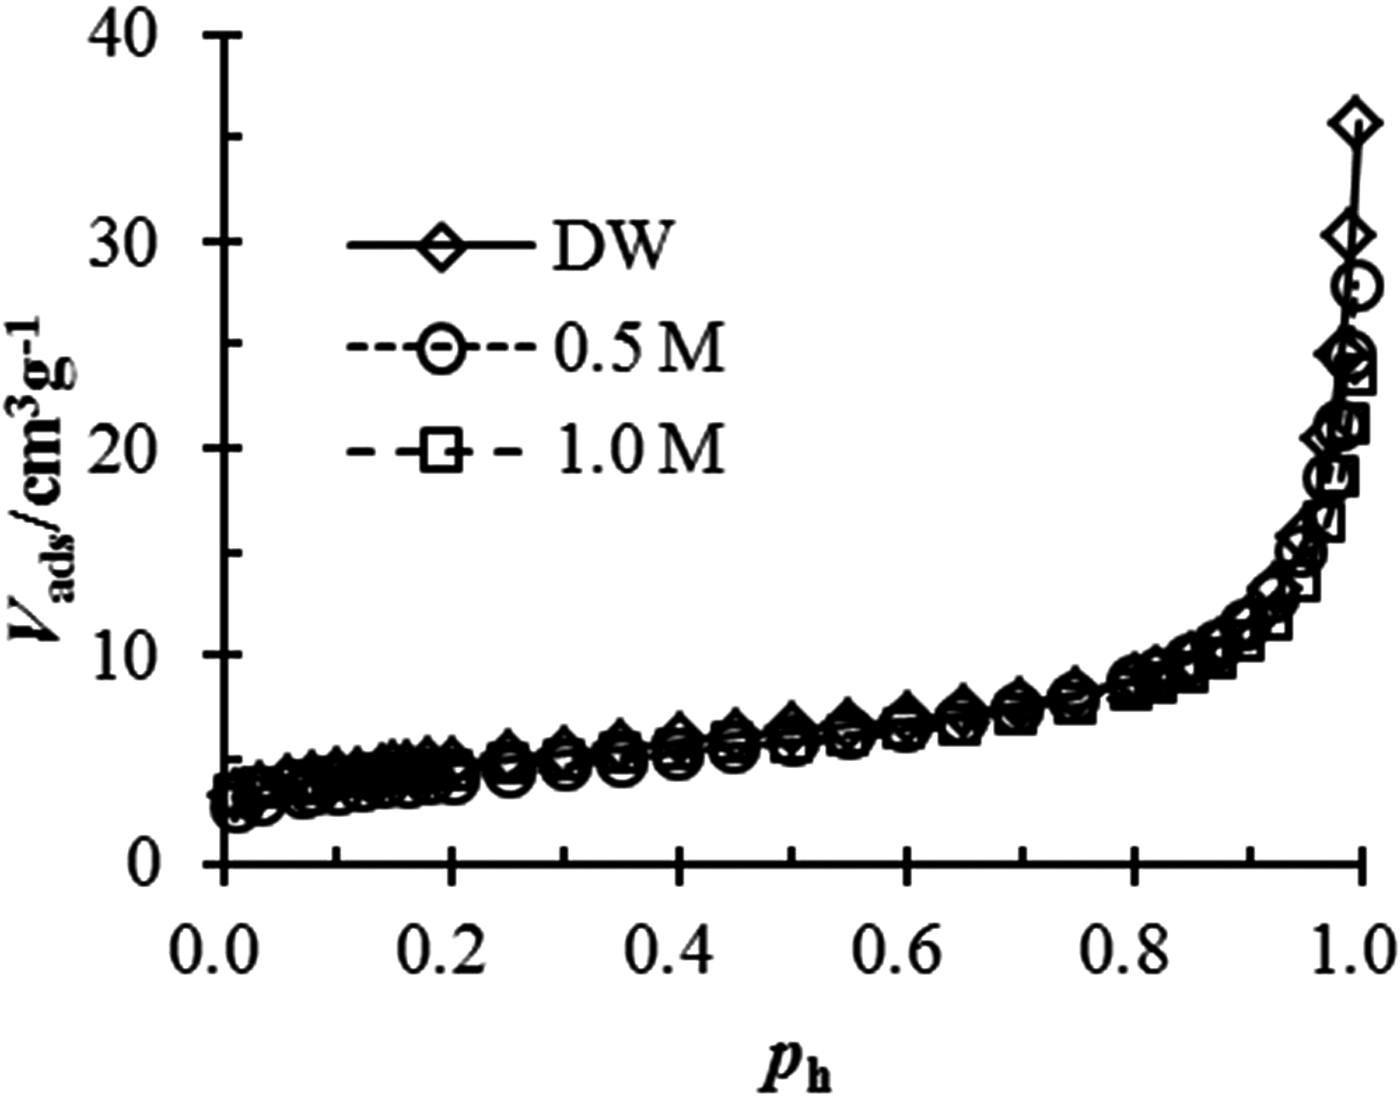
Fig. 3. Nitrogen adsorption–desorption isotherms of tested bentonite in different salt solutions.
The estimated D s values from the nitrogen adsorption are listed in Table 2. The variation in the surface fractal dimension for the tested bentonite is <0.1. Thus, the effect of NaCl concentration on the fractal dimension is negligible and so may be ignored.
Table 2. Fractal dimensions of Kunigel bentonite from the nitrogen adsorption tests.

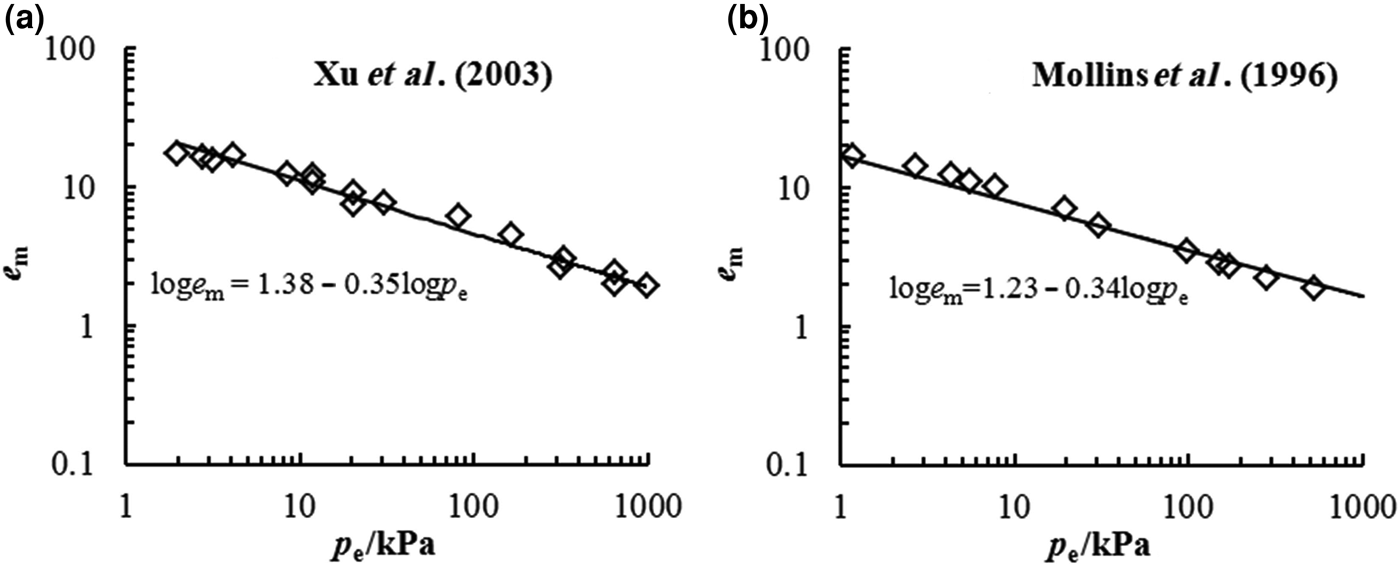
The D s of bentonite may also be estimated using Eq. 4 according to the experimental data from swelling deformation tests. The swelling deformations of Kunigel bentonite and MX-80 bentonite in distilled water from previous studies are illustrated in Fig. 4. The D s values of these two bentonites were estimated as 2.65 and 2.66, respectively. Thus, the D s values of Kunigel bentonite determined from the nitrogen adsorption and swelling tests are essentially identical.
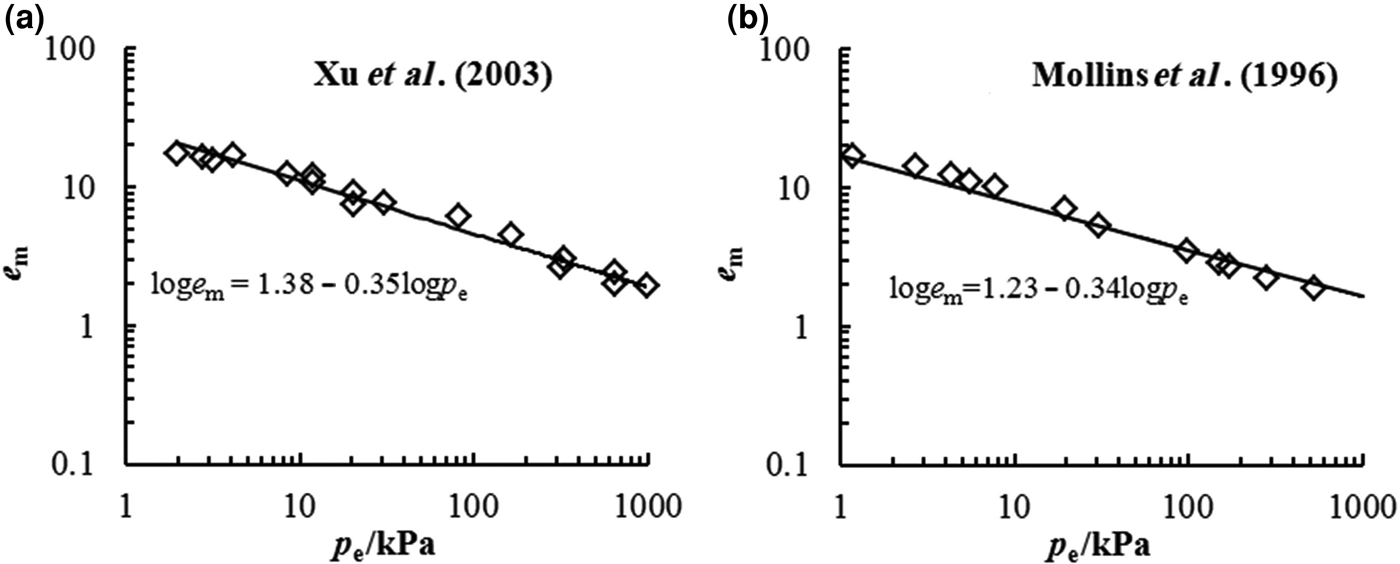
Fig. 4. D s from swelling deformation of (a) Kunigel bentonite (Xu et al., Reference Xu, Matsuoka and Sun2003) and (b) MX-80 bentonite (Mollins et al., Reference Mollins, Stewart and Cousens1996) in distilled water.
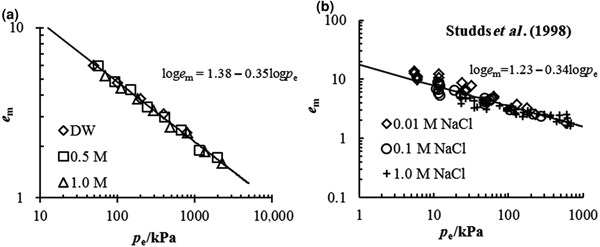
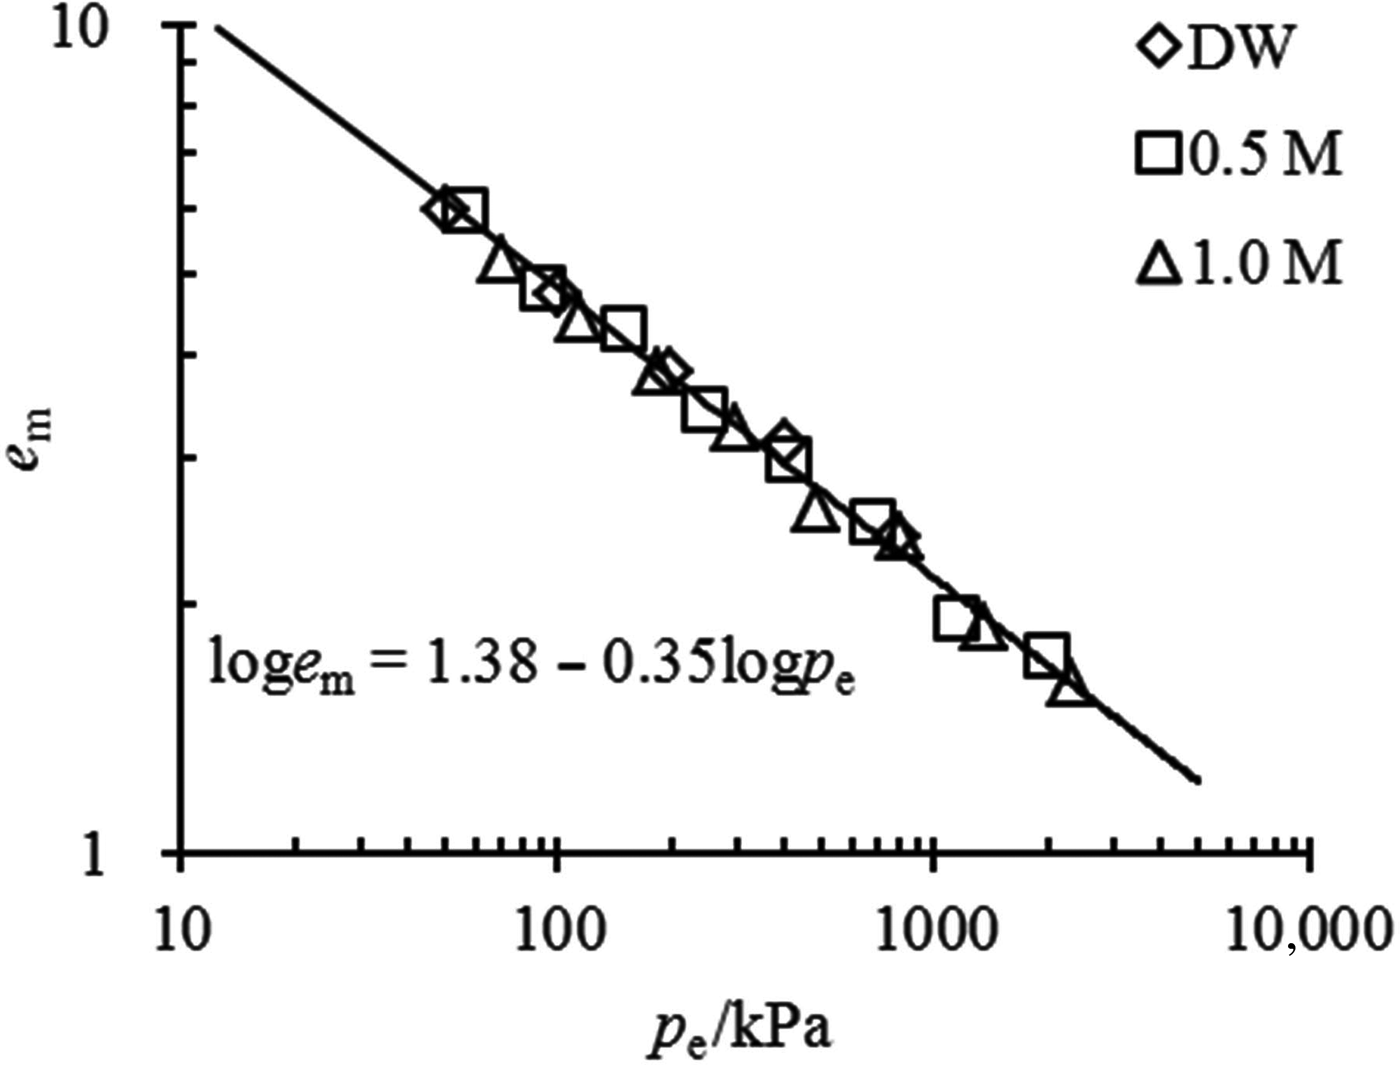
The comparison between the estimated e m–p e relationship from Eq. 4 and the experimental data in this study is illustrated in Fig. 5a. Good agreement is observed between the estimated and experimental data, suggesting that the swelling deformation of the Kunigel bentonite in various salt solution concentrations may be characterized by a unique e m–p e curve with equation loge m = 1.38 − 0.35logp e. The coefficients of the unique e m–p e curve may be obtained conveniently from the swelling experimental data in distilled water. From the swelling test results in distilled water, the e m–p e of MX-80 bentonite is estimated as loge m = 1.23 − 0.34logp e, which is validated by the swelling deformation in NaCl at different concentrations (0.01, 0.1 and 1 mol/L) determined by Studds et al. (Reference Studds, Stewart and Cousens1998), as is shown in Fig. 5b.
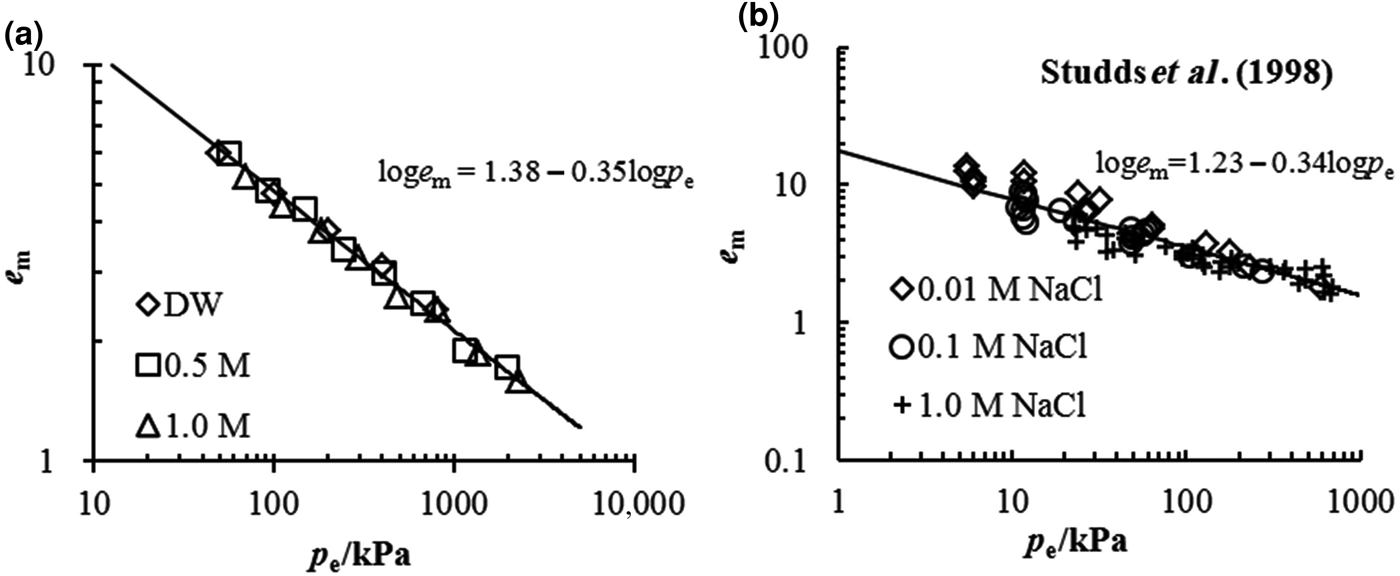
Fig. 5. Comparison between the prediction of the e m–p e relationship and the experimental data for (a) tested pure bentonite and (b) MX-80 bentonite from Studds et al. (Reference Studds, Stewart and Cousens1998).
The e m–p e relationship for the mixtures with 70% bentonite contents in various solutions is shown in Fig. 6. The swelling properties of this mixture may also be represented by the unique linear equation of loge m = 1.38 − 0.35logp e. Due to the large bentonite contents, these mixtures have essentially the same e m values as pure bentonite when they are saturated with the same solution and under the same vertical pressure; i.e. under the same effective stress. Therefore, when the coefficients of the e m–p e relationship are obtained from pure bentonite in distilled water, the swelling properties of mixtures with large bentonite contents in concentrated solutions may also be estimated.
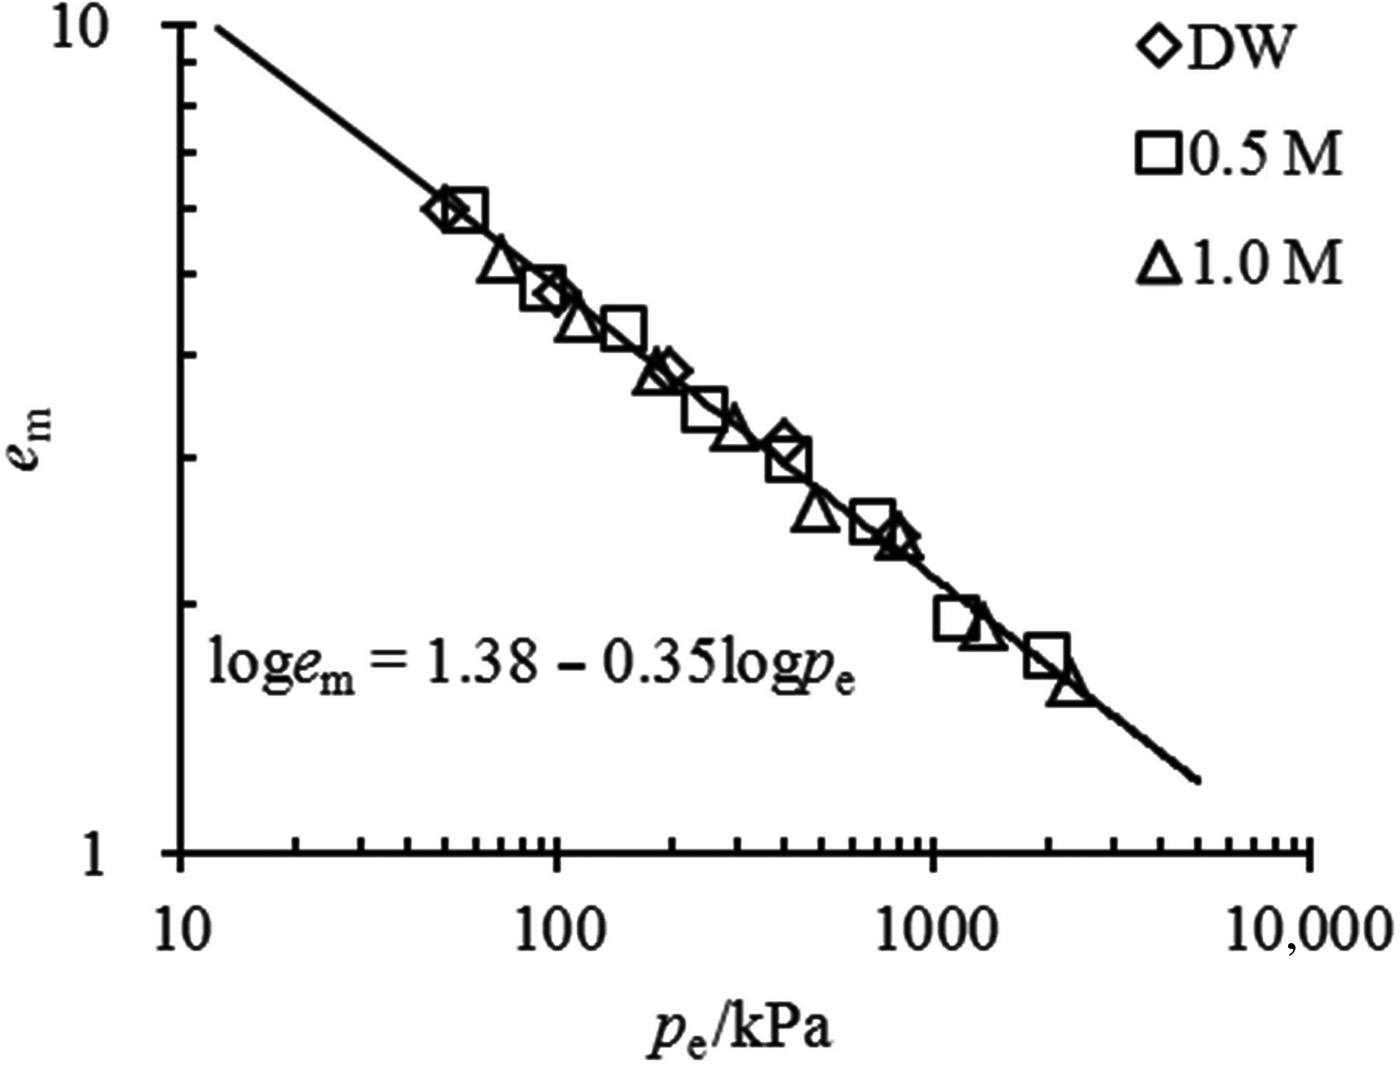
Fig. 6. Comparison between the prediction of the e m–p e relationship and the experimental data for mixtures with α = 70%.
Threshold of sand particle contact
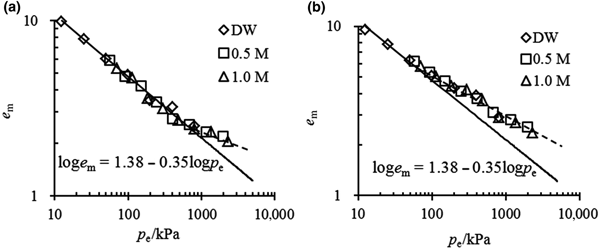
The e m–p e relationship for mixtures with small bentonite contents at full saturation is illustrated in Fig. 7. When the inflowing solution is dilute or the vertical stress is small, this will result in a small p e value, and the experimental data may be arranged with the unique e m–p e curve as expressed for pure bentonite. However, when the effective stress exceeded a particular threshold, caused only by the vertical stress or including osmotic suction, the tested plots always began to deviate from the unique e m–p e curve. The threshold of effective stress was ~750 kPa for α = 50% mixtures and ~50 kPa for α = 40% mixtures, suggesting that the greater the bentonite content in the mixture, the greater the threshold of effective stress above which the deviation begins.
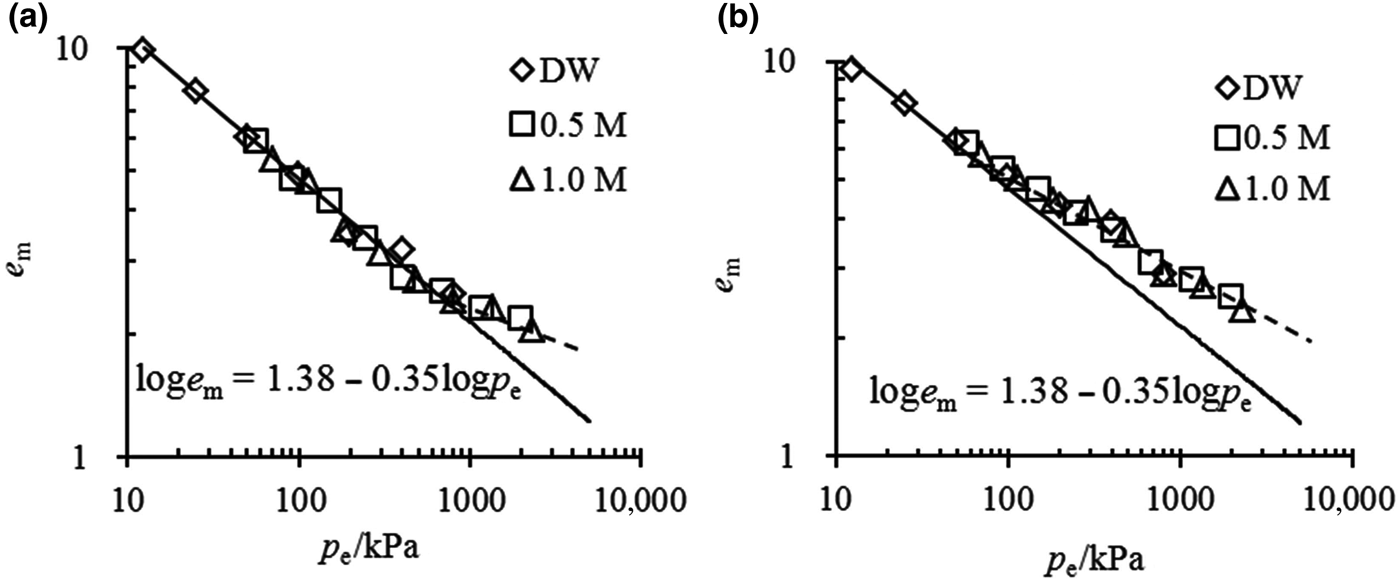
Fig. 7. e m–p e relationship for mixtures with (a) α = 50% and (b) α = 40%.
The various e m values for different mixtures in salt solution are caused by the different effective stresses borne by the montmorillonite layers. In the case of mixtures with large bentonite contents, the montmorillonite is able to swell against the effective stress and separate the sand particles. Even under high effective stress (high vertical pressure and/or high osmotic suction), the sand particles are still surrounded by the clay mineral, so all of the effective stress is taken up by the montmorillonite and the volume change of the mixtures might simply follow the unique curve of e m–p e. However, in the case of mixtures with small bentonite contents, when the effective stress is large enough, a small volume of water is adsorbed by the montmorillonite; thus, there is little void space for the separation of sand particles. Moreover, the sand particles might not be surrounded by montmorillonite particles, but rather might be in contact with each other and form a skeleton. In this case, the effective stress is not taken up by the montmorillonite, yielding a larger e m compared to pure bentonite.
The skeleton void ratio, e s, was defined as (Sun et al., Reference Sun, Cui and Sun2009):
where V w is the water volume at full saturation, V m is the volume of montmorillonite, V nm is the volume of non-expansive clay mineral, V w + V m + V nm represents the volume except for sand particles in the sand–bentonite mixture and V sd is the volume of sand particles. According to Eq. 1, at full saturation, there is V w = e mV m. Then, the relationship between e m and e s may be expressed as:
with
where ρm = 2.79, ρnm = 2.79 and ρsd = 2.75 are the specific gravity values of montmorillonite, non-expansive clay mineral in bentonite and sand particles, respectively (Sun et al., Reference Sun, Cui and Sun2009). For the tested bentonite, B = –2.08.
When e s is small enough, a skeleton of sand particles may be formed in the mixture, but the experimental data will deviate from the e m–p e curve. Therefore, when the effective stress reaches the threshold, e s also reaches the threshold e max, where sand particles begin to come into contact with each other. The initial deviations of e m for mixtures with 50% and 40% bentonite contents are 2.5 and 5.0, respectively (Fig. 7). Thus, e max accounts for 1.0 using Eq. 7, in agreement to the study by Sun et al. (Reference Sun, Cui and Sun2009), suggesting that the sand skeleton may be formed when the volume of sand particles is greater than the volume excluding sand particles in the mixture. When the deviation begins from the unique e m–p e curve, the e s = e max = 1.0, and the fractal e m–p e relationship should be satisfied simultaneously. That is:
It is suggested that the montmorillonite begins to adsorb water (e m = 0) when the sand skeleton begins to break up, which is the limiting bentonite content at which the sand skeleton may not be formed under any condition. According to Eq. 10, the limiting bentonite content of Kunigel bentonite is estimated as 51.1%.
Rearrangement of Eq. 10 gives:
The effective stress calculated by Eq. 11 is referred to as the sand particle contact stress, p ec, when the sand particle skeleton begins to form in mixtures with low bentonite contents, and the corresponding vertical stress, σc, applied on the mixture in a given salt solution is then estimated by Eq. 2. The estimated results of these calculations are listed in Table 3, and are in good agreement with the experimental data.
Table 3. Sand particle contact vertical stress, σc, for mixtures with small bentonite contents in different solutions (kPa).

Prediction of maximum swelling strain
The relationship between εmax of bentonite–sand mixtures and e m at full saturation may be written as (Xu et al., Reference Xu, Matsuoka and Sun2003):
Where A = 1 + (100/β − 1)(ρm/ρnm) + (100/α − 1)(100/β)(ρm/ρsd) and ρd is the initial dry density of bentonite–sand mixture samples. The remaining parameters in Eq. 12 have been defined previously.
After substitution of Eqs. 2 and 3 into Eq. 12, the maximum swelling strain of a bentonite–sand mixture in salt solution may be expressed as:
 $${\rm \varepsilon} _{\max} {\rm}={\rm } \left\{ {\displaystyle{{{\rm \rho}_{\rm d}} \over {A{\rm \rho}_{\rm s}}}K{\left[ {{\rm \sigma} + {\rm \pi} {\left( {\displaystyle{{\rm \sigma} \over {\rm \pi}}} \right)}^{D_{\rm s}-2}} \right]}^{D_{\rm s}{\rm -} 3} + \displaystyle{{{\rm \rho}_{\rm d}} \over {{\rm \rho}_{\rm s}}}-1} \right\} \times 100\lpar \% \rpar $$
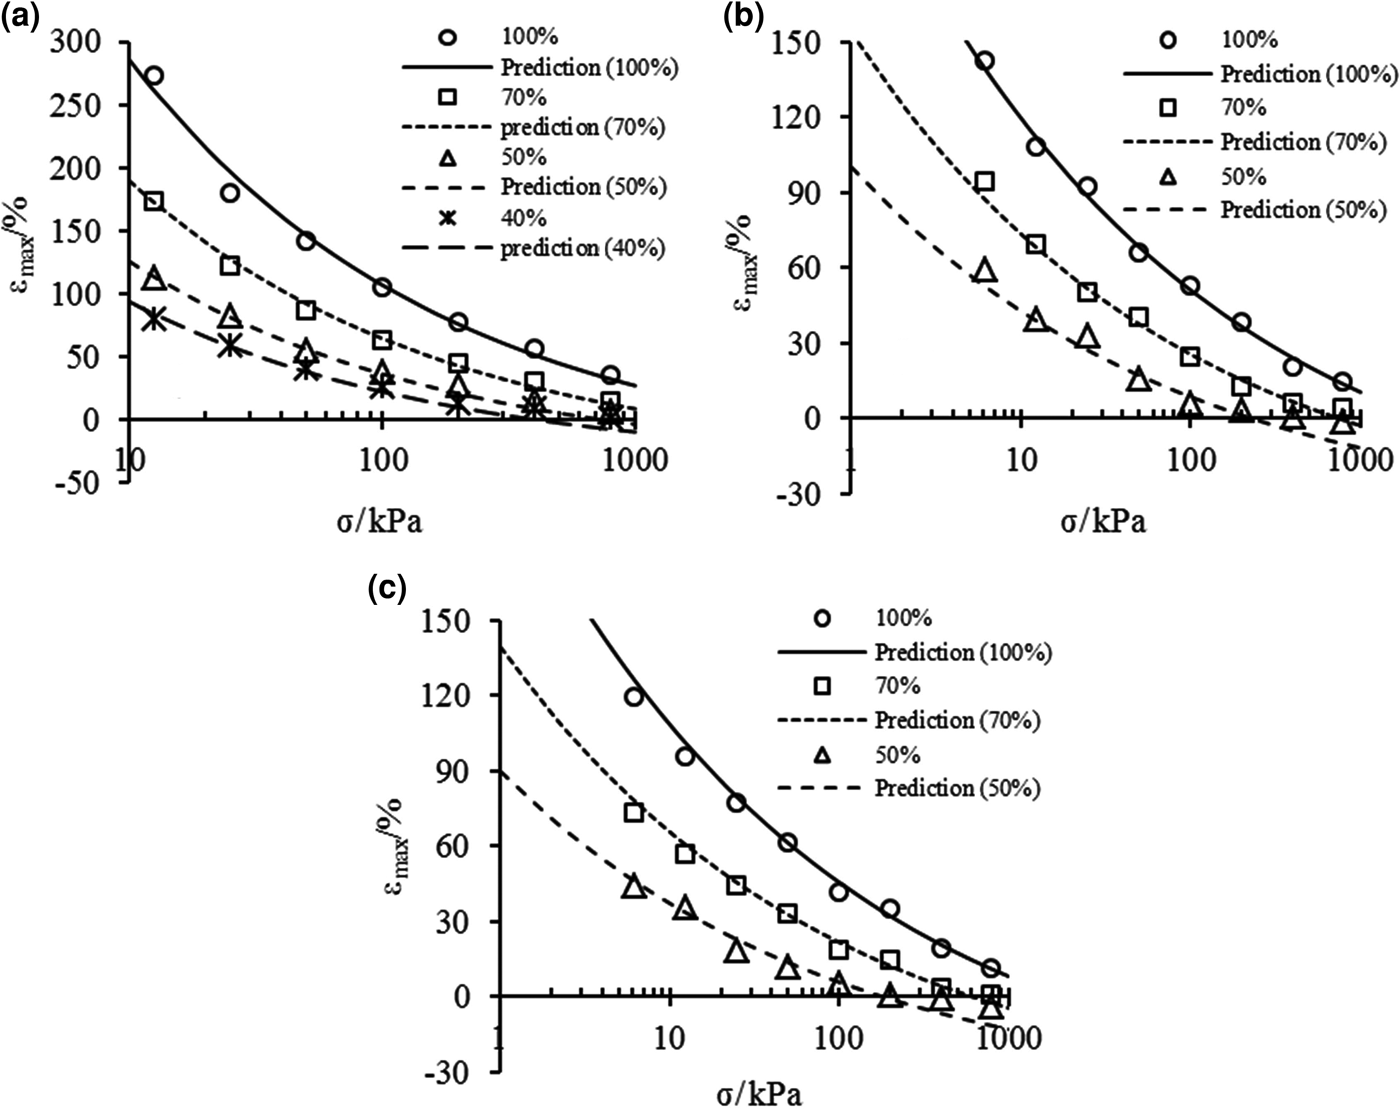
Maximum swelling strains of the bentonite–sand mixtures were calculated according to Eq. 13, and the calculated values and the experimental data are shown in Fig. 8. The predictions of εmax agree well with the experimental data at any condition for mixtures with large bentonite contents. Moreover, the predictions are in good agreement with the experimental data under low effective stress for mixtures with small bentonite contents, where the swelling deformation fits the e m–p e relationship.
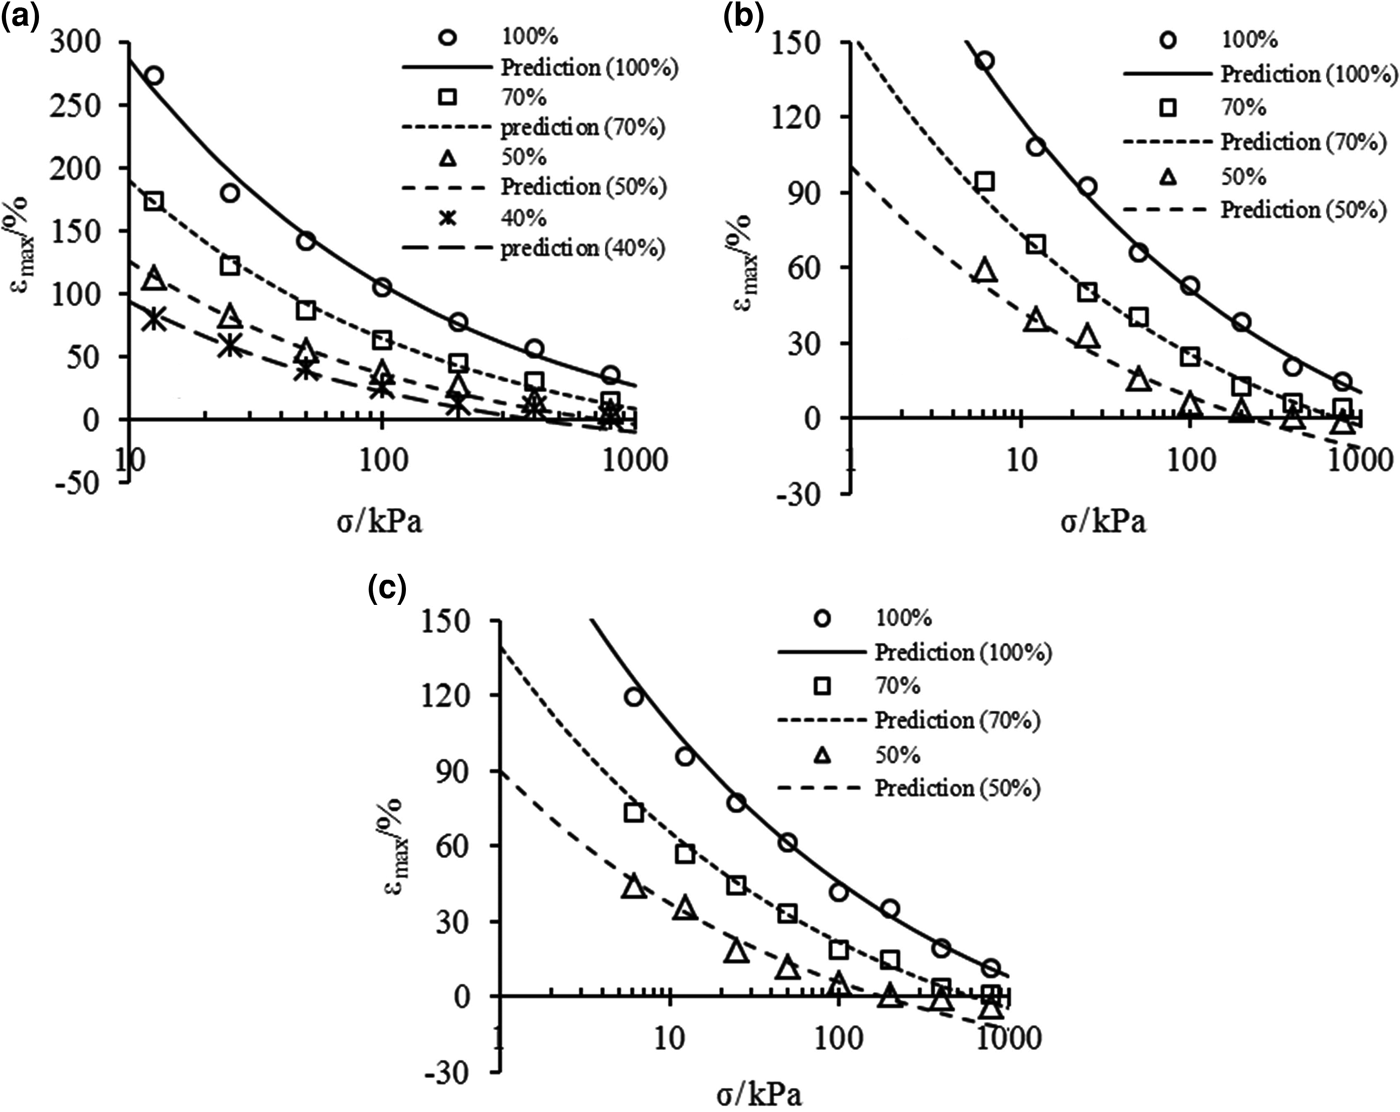
Fig. 8. Comparison between prediction of maximum swelling strains from Eq. 13 and experimental data of bentonite–sand mixtures in (a) distilled water, (b) 0.5 mol/L and (c) 1.0 mol/L NaCl solutions.
Conclusion
The swelling strain always increases with increasing bentonite content, but the void ratio of montmorillonite does not increase. The mixtures with large bentonite contents (α = 70%) have the same e m as pure bentonite under all experimental conditions. In contrast, the mixtures with small bentonite contents (α = 50% and α = 40%) had greater e m values when the vertical pressure and/or the salt concentration were high.
The water uptake of montmorillonite minerals is related to its surface structure, which is characterized by the fractal dimension. The salt concentration had little influence on the fractal dimension according to nitrogen adsorption tests. The swelling properties of bentonite and its sand mixtures in solutions with different salt concentrations may be expressed by a unique fractal curve of the e m–p e relationship. In this relationship, the effective stress incorporating osmotic suction was used in order to take into account the effect of salinity on swelling. The e m–p e relationship offers a convenient method for the prediction of the swelling deformation of bentonite–sand mixtures in concentrated salt solutions. The coefficients of the relationship may be obtained simply from the swelling test results of pure bentonite in distilled water.
For the mixtures with low bentonite contents, when the effective stress is large enough, a skeleton of sand particles is formed in the mixtures that bears part of the effective stress, causing deviation of the measured plots from the unique curve of the e m–p e relationship. According to the initial deviation from the e m–p e relationship, the sand skeleton is only formed when the volume of sand particles is greater than the volume of the non-sand particles in the mixtures. In addition, the limiting bentonite content above which the sand skeleton is not formed in the sand mixtures of Kunigel bentonite was estimated as 51.1%. Using the e m–p e relationship, the threshold of vertical pressure and the maximum swelling strains of mixtures in different solutions were also estimated. Good agreement exists between the estimations and the experimental data.
Author ORCIDs
G.S. Xiang, 0000-0002-3522-3074
Acknowledgements
The National Nature Science Foundation of China (Grant No. 41702311, No. 41630633 and No. 41877211) and the Nature Science Foundation of Anhui Province of China (Grant No. 1708085QE99) are acknowledged for their financial support. The authors also thank the reviewers and editors for their comments about this manuscript.


