


1. Introduction
Changes in the direction of channel boundaries can lead to the separation of flow from these boundaries in a variety of open channel flow configurations, including bends (e.g. Bagnold Reference Bagnold1960; Leeder & Bridges Reference Leeder and Bridges1975; Ferguson et al. Reference Ferguson, Parsons, Lane and Hardy2003; Frothingham & Rhoads Reference Frothingham and Rhoads2003; Nanson Reference Nanson2010; Rhoads & Massey Reference Rhoads and Massey2012; Schnauder & Sukhodolov Reference Schnauder and Sukhodolov2012), bifurcations (e.g. Bulle Reference Bulle1926, Neary & Odgaard Reference Neary and Odgaard1993, Dargahi Reference Dargahi2004 and Zinger et al. Reference Zinger, Rhoads, Best and Johnson2014), and confluences (e.g. Best & Reid Reference Best and Reid1984; Rhoads & Kenworthy Reference Rhoads and Kenworthy1995; Rhoads & Sukhodolov Reference Rhoads and Sukhodolov2001; Yang et al. Reference Yang, Wang, Lu and Wang2009).

Figure 1. (a,b) Definition sketch of two stages of flow separation in a two-dimensional boundary layer. The zone of flow separation is delimited by an internal shear layer, which location is defined by an inflexion point in the velocity profile. In the first stage, the velocity profile develops a deficit characterized by an ‘S shape’, but velocities remain downstream oriented. The internal shear layer weakens in downstream direction and mixes with the adjacent free flow. In the second stage, flow reversal occurs and a recirculation eddy develops in the separation zone. The internal shear layer reattaches at the boundary. (c,d) First and second stage of flow separation at the convex bank in an open channel bend.
Definitions of the process of flow separation vary somewhat in the literature. In reviewing flow separation in turbulent boundary layers, Simpson (Reference Simpson1989, Reference Simpson1996) writes: ‘the term ‘separation’ must mean the entire process of ‘departure’ or ‘breakaway’ or the breakdown of boundary layer flow. An abrupt thickening of the rotational flow region next to a wall and significant values of the normal-to-wall velocity component must accompany breakaway, or else this region will not have any significant interaction with the free-stream flow’. Separation from the boundary develops as turbulent flow moves rapidly into a region of imbalanced forces acting on the flow. In the classical case of a two-dimensional (2-D) boundary layer, the momentum deficit is caused by an adverse pressure gradient. Two stages can be distinguished in the development of flow separation. In the first stage, the velocity profile develops a deficit characterized by an ‘S shape’ (figure 1
a). An internal shear layer characterized by eddies and vortices occurs in the zone of steepest gradient, coinciding with an inflexion point in the velocity profile. Just downstream of the point of separation from the bank, the location of this inflexion point moves away from the bank as the zone of velocity deficit widens. The second stage is reached when the boundary velocity and shear stress are zero. Beyond this threshold, flow reversal occurs near the boundary, and a recirculating vortex develops in the separation zone (figure 1
b). At some distance downstream, the turbulent internal shear layer dissipates and becomes indistinguishable from the adjacent free stream (first stage), or it reattaches to the boundary (second stage). In 2-D boundary layers, only the second stage is commonly considered as true flow separation. According to Simpson (Reference Simpson1989, Reference Simpson1996), ‘It is too narrow a view to use vanishing surface shearing stress or flow reversal as the criterion for separation. Only in steady two-dimensional flow do these conditions usually accompany separation’. The process of flow separation from the convex bank in open channel bends, bifurcations and confluences is more complex than classic 2-D flow separation due to the three-dimensional (3-D) nature of the flow. Figure 1(c,d) illustrate schematically the two stages of flow separation for the case of open channel bends. In his seminal paper on flow separation in open channel bends, Bagnold (Reference Bagnold1960) recognizes both stages of flow separation. According to Bagnold, flow separation mainly depends on the sharpness of the bend, as parameterized by the ratio of centreline radius of curvature to channel width,
 $R/B$
. In mildly curved bends,
$R/B$
. In mildly curved bends,
 $R/B>3.5$
, no separation or development of an internal shear layer occurs. In sharper bends, typically for values of approximately
$R/B>3.5$
, no separation or development of an internal shear layer occurs. In sharper bends, typically for values of approximately
 $R/B<3$
, the first stage of separation occurs. Bagnold mentions that flow in the separation zone near the convex bank is relatively stagnant but still stable. In his second stage, which typically occurs in sharp bends characterized by
$R/B<3$
, the first stage of separation occurs. Bagnold mentions that flow in the separation zone near the convex bank is relatively stagnant but still stable. In his second stage, which typically occurs in sharp bends characterized by
 $R/B<2$
, Bagnold mentions that the flow becomes unstable, dissipates energy in eddying and flow reversal occurs. Bagnold provides sketches for both stages (his figure 84B,C), but his definition of flow separation is qualitative and does not involve clear criteria based on flow characteristics. Leeder & Bridges (Reference Leeder and Bridges1975) performed a field investigation to determine the critical conditions for the onset of convex bank flow separation in open channel bends as a function of
$R/B<2$
, Bagnold mentions that the flow becomes unstable, dissipates energy in eddying and flow reversal occurs. Bagnold provides sketches for both stages (his figure 84B,C), but his definition of flow separation is qualitative and does not involve clear criteria based on flow characteristics. Leeder & Bridges (Reference Leeder and Bridges1975) performed a field investigation to determine the critical conditions for the onset of convex bank flow separation in open channel bends as a function of
 $R/B$
and the Froude number. They adopt Bagnold’s qualitative definition of flow separation and illustrate it with an updated definition sketch. This definition sketch of flow separation conforms to the first stage, and does not involve reattachment of the internal shear layer or flow recirculation. In line with Simpson’s (Reference Simpson1989, Reference Simpson1996) definition of flow separation in 3-D flows, and the definition of flow separation in bends by Bagnold (Reference Bagnold1960) and Leeder & Bridges (Reference Leeder and Bridges1975), the term convex bank flow separation in the present paper includes both stages of flow separation in 3-D flows. It refers to the hydrodynamic processes that cause the main flow body to separate from the convex bank, whereby a zone of slower moving fluid is situated between the convex bank and the main flow body. A defining characteristic is the occurrence of an internal shear layer at the separation of the main flow body and the slower moving flow, which is identified by an inflexion point in the velocity profile. Other defining fluid mechanical characteristics related to turbulence and mean flow will be identified in the paper.
$R/B$
and the Froude number. They adopt Bagnold’s qualitative definition of flow separation and illustrate it with an updated definition sketch. This definition sketch of flow separation conforms to the first stage, and does not involve reattachment of the internal shear layer or flow recirculation. In line with Simpson’s (Reference Simpson1989, Reference Simpson1996) definition of flow separation in 3-D flows, and the definition of flow separation in bends by Bagnold (Reference Bagnold1960) and Leeder & Bridges (Reference Leeder and Bridges1975), the term convex bank flow separation in the present paper includes both stages of flow separation in 3-D flows. It refers to the hydrodynamic processes that cause the main flow body to separate from the convex bank, whereby a zone of slower moving fluid is situated between the convex bank and the main flow body. A defining characteristic is the occurrence of an internal shear layer at the separation of the main flow body and the slower moving flow, which is identified by an inflexion point in the velocity profile. Other defining fluid mechanical characteristics related to turbulence and mean flow will be identified in the paper.
Convex bank flow separation has been successfully simulated by means of three-dimensional (3-D) eddy resolving techniques by Van Balen, Blanckaert & Uijttewaal (Reference Van Balen, Blanckaert and Uijttewaal2010) and Koken, Constantinescu & Blanckaert (Reference Koken, Constantinescu and Blanckaert2013) for an open channel bend, and by Constantinescu et al. (Reference Constantinescu, Miyawaki, Rhoads, Sukhodolov and Kirkil2011) for a river confluence. Three-dimensional Reynolds Averaged Navier–Stokes (RANS) models with isotropic turbulence closure on the contrary could not resolve the convex bank flow separation in the same bend (Zeng et al. Reference Zeng, Constantinescu, Blanckaert and Weber2008; Van Balen et al. Reference Van Balen, Blanckaert and Uijttewaal2010) and confluence (Constantinescu et al. Reference Constantinescu, Miyawaki, Rhoads, Sukhodolov and Kirkil2011). The difference between these eddy resolving and RANS simulations indicates that turbulence plays a crucial role in the generation of convex bank flow separation.
Flow separation decreases the effective channel width and thus reduces the channel conveyance capacity, which can alter morphological patterns (Ferguson et al. Reference Ferguson, Parsons, Lane and Hardy2003; Kleinhans et al. Reference Kleinhans, Schuurman, Bakx and Markies2009) with potential impacts on ecological diversity, river planform evolution and floodplain sedimentology (Burge & Smith Reference Burge, Smith, Smith and Rogers2009). In spite of its importance, little is known about the fluid mechanics of convex bank flow separation induced by changes in the direction of the channel boundaries, and especially the role of turbulence in this process. The knowledge gaps may largely be attributed to the paucity of detailed experimental data, including the three velocity components and turbulence characteristics (table 1). Convex bank flow separation has been observed and measured in natural rivers, but with a spatial resolution and accuracy that are insufficient for a detailed analysis of the fluid dynamics and a reliable validation of the numerical models.
Table 1. Available experimental data including the three components of the mean velocity in zone of convex bank flow separation in bends, confluences and bifurcations.

The present paper analyses experimental data measured with unprecedented detail in the zone of convex bank flow separation in a laboratory bend, in order to enhance insight into the physics behind the process of convex bank flow separation occurring in a variety of configurations, including confluences and bifurcations. The hydrodynamic and morphodynamic processes in open channel bends have been abundantly investigated in the past (recent contributions include Jamieson, Post & Rennie Reference Jamieson, Post and Rennie2010; Blanckaert Reference Blanckaert2011; Engel & Rhoads Reference Engel and Rhoads2012; Sukhodolov Reference Sukhodolov2012; Constantinescu et al. Reference Constantinescu, Kashyap, Toyay, Rennie and Townsend2013; Koken et al. Reference Koken, Constantinescu and Blanckaert2013), but the process of flow separation from the convex (inner) bank has hardly received any attention. Experiments in the laboratory bend examined in the present paper have already provided insight into the morphological implications of convex bank flow separation (Blanckaert Reference Blanckaert2010, Reference Blanckaert2011), the fluid dynamics near the concave outer bank (Blanckaert et al. Reference Blanckaert, Duarte, Chen and Schleiss2012), curvature-induced secondary flow, which is defined in the present study as the flow components perpendicular to the river axis (Blanckaert Reference Blanckaert2009), and global evolution of flow through bends (Zeng et al. Reference Zeng, Constantinescu, Blanckaert and Weber2008; Blanckaert Reference Blanckaert2010). None of these previous studies has focused specifically on the characteristics of mean flow and turbulence within the zone of convex bank flow separation. The major contributions of the paper are:
-
(i) to report and analyse detailed experimental data on the streamwise flow, the secondary flow, the streamwise vorticity, the bed shear stress, the friction coefficient, the turbulent normal and shear stresses and the tke in the zone of convex bank flow separation (§ 3), which allow for an analysis of the flow physics.
-
(ii) to analyse the flow physics underlying the process of convex bank flow separation in the reported experiments by means of an analysis of the friction factor (§ 4), a term-by-term analysis of the transverse momentum equation (§ 4), and an analysis of the kinetic energy transfer between the mean flow and the turbulence (§ 5).
-
(iii) to translate the findings of the laboratory experiment into insight into the flow physics underlying the convex bank flow separation in a wide variety of configurations, including bends, confluences and bifurcations (§ 6).
-
(iv) to provide benchmark data for the validation of numerical models (§§ 3–5), and to define requirements for numerical models to simulate accurately the process of convex bank flow separation (§§ 4 and 5).
2. The experiments
Blanckaert (Reference Blanckaert2010) reports in detail the experimental set-up, the instruments, the data treatment procedures and estimates of the experimental uncertainty. Only essential information is reported herein. The present paper uses the same nomenclature as Blanckaert (Reference Blanckaert2009, Reference Blanckaert2010) and Blanckaert et al. (Reference Blanckaert, Duarte, Chen and Schleiss2012) who report experiments in the same laboratory flume. An orthogonal (
 $s,n,z$
) reference system is adopted with the streamwise
$s,n,z$
) reference system is adopted with the streamwise
 $s$
-axis along the centreline, outward
$s$
-axis along the centreline, outward
 $n$
-axis and vertically upward
$n$
-axis and vertically upward
 $z$
-axis. The origin of the
$z$
-axis. The origin of the
 $s$
-axis is at the bend entrance.
$s$
-axis is at the bend entrance.
The 1.3 m wide (
 $B$
) open channel flume consists of a 9 m long straight entry reach, followed by a
$B$
) open channel flume consists of a 9 m long straight entry reach, followed by a
 $193^{\circ }$
bend with constant centreline radius of curvature of 1.7 m (
$193^{\circ }$
bend with constant centreline radius of curvature of 1.7 m (
 $R$
) and a 5 m long straight exit reach (figure 2). The flume has smooth vertical banks made of PVC, and the bed of the flume is flat and consists of glued uniform sand with a diameter of
$R$
) and a 5 m long straight exit reach (figure 2). The flume has smooth vertical banks made of PVC, and the bed of the flume is flat and consists of glued uniform sand with a diameter of
 $d=0.002~\text{m}$
. Table 2 summarizes the geometric and hydraulic conditions of the three experiments, which all concern sharply curved (
$d=0.002~\text{m}$
. Table 2 summarizes the geometric and hydraulic conditions of the three experiments, which all concern sharply curved (
 $R/B=1.31$
, and
$R/B=1.31$
, and
 $R/\tilde{H}=8.0$
, 10.6 and 15.6, respectively;
$R/\tilde{H}=8.0$
, 10.6 and 15.6, respectively;
 $\tilde{H}$
is the flume-averaged flow depth), subcritical (Froude number
$\tilde{H}$
is the flume-averaged flow depth), subcritical (Froude number
 $\mathit{Fr}<1$
) open channel flow.
$\mathit{Fr}<1$
) open channel flow.

Figure 2. Water surface level (cm) in the F16 experiment with an interval of 0.001 m derived from echosounder measurements. The horizontal bed defines the reference level. The white line delimits the zone of convex bank flow separation at the water surface. The definition of this line is detailed in § 3.3. ADVP measurements of the velocities are available in the indicated cross-sections.
Table 2. Hydraulic and geometric conditions.
 $Q$
is the flow discharge,
$Q$
is the flow discharge,
 $\tilde{H}$
the flume-averaged flow depth,
$\tilde{H}$
the flume-averaged flow depth,
 $B$
the flume width,
$B$
the flume width,
 $\tilde{U} =Q/B\tilde{H}$
the flume-averaged velocity,
$\tilde{U} =Q/B\tilde{H}$
the flume-averaged velocity,
 $E_{s,0}$
the average energy slope in the straight inflow,
$E_{s,0}$
the average energy slope in the straight inflow,
 $C_{f,0}^{-1/2}=U_{0}/\sqrt{gR_{h,0},E_{s,0}}$
a Chézy-type dimensionless friction coefficient for the straight inflow based on the average hydraulic radius
$C_{f,0}^{-1/2}=U_{0}/\sqrt{gR_{h,0},E_{s,0}}$
a Chézy-type dimensionless friction coefficient for the straight inflow based on the average hydraulic radius
 $R_{h,0}$
and velocity
$R_{h,0}$
and velocity
 $U_{0}$
in the straight inflow,
$U_{0}$
in the straight inflow,
 $\tilde{E}_{s}$
the flume-averaged energy slope,
$\tilde{E}_{s}$
the flume-averaged energy slope,
 $\tilde{C}_{f}^{-1/2}=\tilde{U} /\sqrt{g\tilde{R}_{h},\tilde{E}_{s}}$
a Chézy-type dimensionless friction coefficient based on flume-averaged flow characteristics,
$\tilde{C}_{f}^{-1/2}=\tilde{U} /\sqrt{g\tilde{R}_{h},\tilde{E}_{s}}$
a Chézy-type dimensionless friction coefficient based on flume-averaged flow characteristics,
 $\mathit{Re}=\tilde{U} \tilde{H}/{\it\nu}$
the Reynolds number and
$\mathit{Re}=\tilde{U} \tilde{H}/{\it\nu}$
the Reynolds number and
 $\mathit{Fr}=\tilde{U} /\sqrt{g\tilde{H}}$
the Froude number. Blanckaert (Reference Blanckaert2009) and Blanckaert et al. (Reference Blanckaert, Duarte, Chen and Schleiss2012) have labelled the experiments examined in the present paper as F_xx_90_00, where F indicates flat bed, xx the flow depth in cm, 90 the inclination of the outer bank and 00 the roughness of the outer bank. For the sake of simplicity, the labels of the experiments are simplified in the present paper as Fxx.
$\mathit{Fr}=\tilde{U} /\sqrt{g\tilde{H}}$
the Froude number. Blanckaert (Reference Blanckaert2009) and Blanckaert et al. (Reference Blanckaert, Duarte, Chen and Schleiss2012) have labelled the experiments examined in the present paper as F_xx_90_00, where F indicates flat bed, xx the flow depth in cm, 90 the inclination of the outer bank and 00 the roughness of the outer bank. For the sake of simplicity, the labels of the experiments are simplified in the present paper as Fxx.

The curvature of open channel bends is commonly parameterized by means of the ratio
 $R/B$
(e.g. Hickin Reference Hickin1974; Markham & Thorne Reference Markham, Thorne, Billi, Hey, Thorne and Tacconi1992; Hooke Reference Hooke2003). This ratio tends to infinity for straight rivers, and values less than 1 for the sharpest bends occurring in nature (see compilation of field data in Crosato Reference Crosato2008). Flow separation at the convex bank only occurs in sufficiently sharply curved bends, but no reliable quantitative criterion yet exists for the bend sharpness required for the onset of flow separation. A discriminative value of
$R/B$
(e.g. Hickin Reference Hickin1974; Markham & Thorne Reference Markham, Thorne, Billi, Hey, Thorne and Tacconi1992; Hooke Reference Hooke2003). This ratio tends to infinity for straight rivers, and values less than 1 for the sharpest bends occurring in nature (see compilation of field data in Crosato Reference Crosato2008). Flow separation at the convex bank only occurs in sufficiently sharply curved bends, but no reliable quantitative criterion yet exists for the bend sharpness required for the onset of flow separation. A discriminative value of
 $R/B\approx 2$
has been suggested by Bagnold (Reference Bagnold1960), whereas Leeder & Bridges (Reference Leeder and Bridges1975) provided a discriminative curve as a function of
$R/B\approx 2$
has been suggested by Bagnold (Reference Bagnold1960), whereas Leeder & Bridges (Reference Leeder and Bridges1975) provided a discriminative curve as a function of
 $R/B$
and
$R/B$
and
 $\mathit{Fr}$
. These guidelines motivated the choice of
$\mathit{Fr}$
. These guidelines motivated the choice of
 $R/B=1.31$
in the reported experiments. Blanckaert & de Vriend (Reference Blanckaert and de Vriend2010) have identified
$R/B=1.31$
in the reported experiments. Blanckaert & de Vriend (Reference Blanckaert and de Vriend2010) have identified
 $R/B$
and
$R/B$
and
 $C_{f}^{-1}\tilde{H}/B$
(
$C_{f}^{-1}\tilde{H}/B$
(
 $C_{f}$
is a Chézy-type dimensionless friction coefficient defined in table 2) as the dominant control parameters for flow redistribution due to curvature variations. The former is a characteristic of individual bends whereas the latter characterizes a river reach. The latter control parameter motivated the design of the experiments with three different flow depths. Variation of the flow depth also leads to variations in the ratio
$C_{f}$
is a Chézy-type dimensionless friction coefficient defined in table 2) as the dominant control parameters for flow redistribution due to curvature variations. The former is a characteristic of individual bends whereas the latter characterizes a river reach. The latter control parameter motivated the design of the experiments with three different flow depths. Variation of the flow depth also leads to variations in the ratio
 $\tilde{H}/R$
, which is the dominant control parameter for curvature-induced secondary flow (Rozovskii Reference Rozovskii1957; Engelund Reference Engelund1974; de Vriend Reference de Vriend1977).
$\tilde{H}/R$
, which is the dominant control parameter for curvature-induced secondary flow (Rozovskii Reference Rozovskii1957; Engelund Reference Engelund1974; de Vriend Reference de Vriend1977).
The centreline radius of curvature changes abruptly at the bend entrance and exit in the laboratory flume, and is constant around the bend. Due to inertia however, the flow adapts gradually to the imposed abrupt changes in curvature. Moreover, abrupt changes in curvature tend to be common features in natural curved rivers, as for example on the Embarras River investigated by Frothingham & Rhoads (Reference Frothingham and Rhoads2003). Therefore, the first part of the laboratory bend is representative of zones of pronounced curvature increase in natural rivers, and the middle part of the bend is representative of zones of little or no curvature variation.
It is important to gain insight in the hydrodynamic processes underlying the convex bank flow separation over an immobile horizontal bed, before unravelling the interactions between the hydrodynamic processes and the sediment transport in the more complex case with mobile bed topography. The present paper only considers experiments with a flat immobile bed, but discusses the influence of a mobile bed topography in § 6.
The discharge was measured with an uncertainty of about 1 % by means of an electromagnetic flow meter on the supply pipeline. Measurements of the water surface topography were obtained using echosounders with a resolution of less than 1 mm. Eight echosounders were installed on a carriage at transverse positions
 $n=\pm 0.1,\pm 0.3,\pm 0.5,\pm 0.6~\text{m}$
. Measurements were made in the straight entry reach in cross-sections situated between
$n=\pm 0.1,\pm 0.3,\pm 0.5,\pm 0.6~\text{m}$
. Measurements were made in the straight entry reach in cross-sections situated between
 $s=-8~\text{m}$
and the bend entrance, in the first four meters of the straight outflow reach with a streamwise spacing of 0.5 m and at cross-sections spaced every
$s=-8~\text{m}$
and the bend entrance, in the first four meters of the straight outflow reach with a streamwise spacing of 0.5 m and at cross-sections spaced every
 $10^{\circ }$
of arc length in the bend. The measurement resolution was increased near the bend entrance and exit where water surface gradients are locally steep. The streamwise spacing was reduced to 0.25 m in the last two meters of the straight inflow reach and the first two meters of the straight outflow reach, and to
$10^{\circ }$
of arc length in the bend. The measurement resolution was increased near the bend entrance and exit where water surface gradients are locally steep. The streamwise spacing was reduced to 0.25 m in the last two meters of the straight inflow reach and the first two meters of the straight outflow reach, and to
 $5^{\circ }$
in the first
$5^{\circ }$
in the first
 $30^{\circ }$
and the last
$30^{\circ }$
and the last
 $30^{\circ }$
of the bend reach.
$30^{\circ }$
of the bend reach.
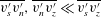
Velocity measurements were acquired with an Acoustic Doppler Velocity Profiler (ADVP) developed at the Ecole Polytechnique Fédérale Lausanne, Switzerland (Lemmin & Rolland Reference Lemmin and Rolland1997; Hurther & Lemmin Reference Hurther and Lemmin1998; Blanckaert & Lemmin Reference Blanckaert and Lemmin2006). This instrument measures the 3-D velocity vector with high spatial and temporal resolution simultaneously in an entire vertical profile. The sampling frequency was 31.25 Hz and the acquisition time was 200 s. Blanckaert & de Vriend (Reference Blanckaert and de Vriend2004) and Blanckaert (Reference Blanckaert2010) discuss in detail the uncertainty in the measured flow quantities. They report the following conservative estimates of the uncertainty in the experimental data: 4 % in the streamwise mean velocity
 $v_{s}$
, 10 % in the transverse and vertical mean velocities
$v_{s}$
, 10 % in the transverse and vertical mean velocities
 $(v_{n},v_{z})$
, 15 % in the turbulent shear stresses
$(v_{n},v_{z})$
, 15 % in the turbulent shear stresses
 $(\overline{v_{s}^{\prime }v_{n}^{\prime }},\overline{v_{s}^{\prime }v_{z}^{\prime }},\overline{v_{n}^{\prime }v_{z}^{\prime }})$
, 20 % in the turbulent normal stresses
$(\overline{v_{s}^{\prime }v_{n}^{\prime }},\overline{v_{s}^{\prime }v_{z}^{\prime }},\overline{v_{n}^{\prime }v_{z}^{\prime }})$
, 20 % in the turbulent normal stresses
 $(\overline{v_{s}^{\prime 2}},\overline{v_{n}^{\prime 2}},\overline{v_{z}^{\prime 2}})$
and the turbulent kinetic energy (tke)
$(\overline{v_{s}^{\prime 2}},\overline{v_{n}^{\prime 2}},\overline{v_{z}^{\prime 2}})$
and the turbulent kinetic energy (tke)
 $k=0.5(\overline{v_{s}^{\prime 2}}+\overline{v_{n}^{\prime 2}}+\overline{v_{z}^{\prime 2}})$
. Blanckaert & de Vriend (Reference Blanckaert and de Vriend2004) report conservative estimates of the uncertainty in quantities derived from the time-averaged velocities and turbulent stresses. They report, for example, an uncertainty of 20 % in the streamwise vorticity
$k=0.5(\overline{v_{s}^{\prime 2}}+\overline{v_{n}^{\prime 2}}+\overline{v_{z}^{\prime 2}})$
. Blanckaert & de Vriend (Reference Blanckaert and de Vriend2004) report conservative estimates of the uncertainty in quantities derived from the time-averaged velocities and turbulent stresses. They report, for example, an uncertainty of 20 % in the streamwise vorticity
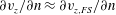
 ${\it\omega}_{s}=\partial v_{z}/\partial n-\partial v_{n}/\partial z$
. The ADVP housing touches the water surface and causes perturbations in a layer of about 2 cm (Blanckaert Reference Blanckaert2010), which is indicated by shading in all relevant figures. In order to estimate depth-averaged values, measured data have been extrapolated in this layer using the method described in table 3 of Blanckaert (Reference Blanckaert2010). The uncertainty in depth-averaged variables is less than 10 %. The data interpretation and analysis take into consideration the experimental uncertainty.
${\it\omega}_{s}=\partial v_{z}/\partial n-\partial v_{n}/\partial z$
. The ADVP housing touches the water surface and causes perturbations in a layer of about 2 cm (Blanckaert Reference Blanckaert2010), which is indicated by shading in all relevant figures. In order to estimate depth-averaged values, measured data have been extrapolated in this layer using the method described in table 3 of Blanckaert (Reference Blanckaert2010). The uncertainty in depth-averaged variables is less than 10 %. The data interpretation and analysis take into consideration the experimental uncertainty.
Velocity measurements were first made along the centreline every
 $15^{\circ }$
in the bend, as reported by Blanckaert (Reference Blanckaert2009). The cross-section with the strongest secondary flow (at
$15^{\circ }$
in the bend, as reported by Blanckaert (Reference Blanckaert2009). The cross-section with the strongest secondary flow (at
 $135^{\circ }$
in the bend for the F11 experiment, at
$135^{\circ }$
in the bend for the F11 experiment, at
 $90^{\circ }$
for F16, and at
$90^{\circ }$
for F16, and at
 $75^{\circ }$
for F21) was subsequently measured on a grid with high spatial resolution that increased towards the banks. For the F16 experiment, detailed measurements were performed in the cross-sections at
$75^{\circ }$
for F21) was subsequently measured on a grid with high spatial resolution that increased towards the banks. For the F16 experiment, detailed measurements were performed in the cross-sections at
 $15^{\circ }$
,
$15^{\circ }$
,
 $30^{\circ }$
,
$30^{\circ }$
,
 $60^{\circ }$
,
$60^{\circ }$
,
 $90^{\circ }$
,
$90^{\circ }$
,
 $120^{\circ }$
,
$120^{\circ }$
,
 $150^{\circ }$
and
$150^{\circ }$
and
 $180^{\circ }$
in the bend, 0.5 and 2.5 m upstream of the bend entrance in the straight inflow reach, and 0.5, 1.5, 2.5 and 3.5 m downstream of the bend exit in the straight outflow reach. The measurement grids (figures 4, 9 and 10) typically consist of more than 40 vertical profiles with each vertical profile consisting of measuring bins, each of which has a height of 3.75 mm. Measurements in the central part of the cross-section (
$180^{\circ }$
in the bend, 0.5 and 2.5 m upstream of the bend entrance in the straight inflow reach, and 0.5, 1.5, 2.5 and 3.5 m downstream of the bend exit in the straight outflow reach. The measurement grids (figures 4, 9 and 10) typically consist of more than 40 vertical profiles with each vertical profile consisting of measuring bins, each of which has a height of 3.75 mm. Measurements in the central part of the cross-section (
 $-0.5~\text{m}<n<0.5~\text{m}$
) were made with a symmetrical configuration of the ADVP, whereas measurements closer to the bank required the use of an asymmetrical ADVP configuration. Blanckaert (Reference Blanckaert2010) reports in detail how cross-sectional patterns are obtained from measurements on overlapping grids with both ADVP configurations.
$-0.5~\text{m}<n<0.5~\text{m}$
) were made with a symmetrical configuration of the ADVP, whereas measurements closer to the bank required the use of an asymmetrical ADVP configuration. Blanckaert (Reference Blanckaert2010) reports in detail how cross-sectional patterns are obtained from measurements on overlapping grids with both ADVP configurations.
In the present paper, mean flow quantities are normalized with the cross-sectionally-averaged velocity,
 $U=Q/BH$
(
$U=Q/BH$
(
 $H$
is the cross-sectionally-averaged flow depth), whereas turbulence quantities are normalized with the characteristic shear velocity for an equivalent straight uniform flow defined as
$H$
is the cross-sectionally-averaged flow depth), whereas turbulence quantities are normalized with the characteristic shear velocity for an equivalent straight uniform flow defined as
 $u_{\ast ,0}=C_{f,0}^{1/2}U$
. Here
$u_{\ast ,0}=C_{f,0}^{1/2}U$
. Here
 $C_{f,0}$
is a Chézy-type dimensionless friction coefficient for the straight inflow defined as
$C_{f,0}$
is a Chézy-type dimensionless friction coefficient for the straight inflow defined as
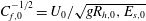 $C_{f,0}^{-1/2}=U_{0}/\sqrt{gR_{h,0},E_{s,0}}$
, based on the average hydraulic radius
$C_{f,0}^{-1/2}=U_{0}/\sqrt{gR_{h,0},E_{s,0}}$
, based on the average hydraulic radius
 $R_{h,0}$
, the average velocity
$R_{h,0}$
, the average velocity
 $U_{0}$
and the average energy slope
$U_{0}$
and the average energy slope
 $E_{s,0}$
in the straight inflow reach. The latter is obtained by a linear fit to the cross-sectionally-averaged energy level
$E_{s,0}$
in the straight inflow reach. The latter is obtained by a linear fit to the cross-sectionally-averaged energy level
 $E=H+U^{2}/(2g)$
. The dense measuring grid permits estimates of
$E=H+U^{2}/(2g)$
. The dense measuring grid permits estimates of
 $E_{s,0}$
with an uncertainty of less than 5 %, resulting in an uncertainty in
$E_{s,0}$
with an uncertainty of less than 5 %, resulting in an uncertainty in
 $C_{f,0}$
that is also approximately 5 %.
$C_{f,0}$
that is also approximately 5 %.
3. Flow patterns in the zone of convex bank flow separation
3.1. Patterns of flow and turbulence around the bend
The patterns of flow and turbulence around the bend are investigated in the F16 experiment, where measurements are available in 13 cross-sections around the flume. Different processes induce transverse velocities near the convex bank. First, a transverse tilting of the water surface develops at the bend entrance, with transverse water surface gradients that are an order of magnitude larger than streamwise water surface gradients (figure 2). This effect leads to an adverse streamwise water surface gradient near the concave outer bank, and strongly enhanced streamwise water surface gradients near the convex inner bank from about 1 m upstream of the bend entrance to about
 $40^{\circ }$
into the bend (figure 2). As a result, flow decelerates at the outside of the bend and accelerates at the inside (figure 3
a). Due to mass conservation, this effect is accompanied by mass transport towards the convex bank,
$40^{\circ }$
into the bend (figure 2). As a result, flow decelerates at the outside of the bend and accelerates at the inside (figure 3
a). Due to mass conservation, this effect is accompanied by mass transport towards the convex bank,
 $v_{n}<0$
.
$v_{n}<0$
.

Figure 3. Patterns of flow variables in the F16 experiment. (a) Normalized depth-averaged streamwise unit discharge
 $U_{s}h/UH$
(—), and cross-stream profiles of
$U_{s}h/UH$
(—), and cross-stream profiles of
 $U_{s}h/UH-1$
(—) in the measured cross-sections; (b) normalized near-surface transverse velocity
$U_{s}h/UH-1$
(—) in the measured cross-sections; (b) normalized near-surface transverse velocity
 $v_{n,surf}/U$
(—);
$v_{n,surf}/U$
(—);
 $v_{n,surf}$
is obtained by averaging the measured velocity in the five points within the layer from 0.006 to 0.0019 m below the water surface, where the highest transverse near-surface velocities occur. (c) Normalized near-bed transverse velocity
$v_{n,surf}$
is obtained by averaging the measured velocity in the five points within the layer from 0.006 to 0.0019 m below the water surface, where the highest transverse near-surface velocities occur. (c) Normalized near-bed transverse velocity
 $v_{n,bed}/U$
(—);
$v_{n,bed}/U$
(—);
 $v_{n,bed}$
is obtained by averaging the measured velocity in the five points within the layer from 0.006 to 0.0019 m above the bed, where the highest transverse near-bed velocities occur; (d) normalized depth-averaged transverse unit discharge
$v_{n,bed}$
is obtained by averaging the measured velocity in the five points within the layer from 0.006 to 0.0019 m above the bed, where the highest transverse near-bed velocities occur; (d) normalized depth-averaged transverse unit discharge
 $U_{n}h/UH$
(—); (e) normalized depth-averaged turbulent kinetic energy (tke),
$U_{n}h/UH$
(—); (e) normalized depth-averaged turbulent kinetic energy (tke),
 $\langle k\rangle /u_{\ast ,0}^{2}$
. Isoline pattern based on high-resolution measurements in the indicated cross-sections. The black line delimits the zone of convex bank flow separation at the water surface. The definition of this line is detailed in § 3.3.
$\langle k\rangle /u_{\ast ,0}^{2}$
. Isoline pattern based on high-resolution measurements in the indicated cross-sections. The black line delimits the zone of convex bank flow separation at the water surface. The definition of this line is detailed in § 3.3.
Second, the interplay between the inward pressure gradient induced by the transverse tilting of the water surface and the outward centrifugal force leads to the development of a secondary flow, with outward velocities in the upper part of the water column (figure 3
b) and inward velocities in the lower part of the water column (figure 3
c). This secondary flow develops at the bend entrance, reaches a maximum magnitude between
 $90^{\circ }$
and
$90^{\circ }$
and
 $120^{\circ }$
into the bend, and weakens in the final part of the curved reach.
$120^{\circ }$
into the bend, and weakens in the final part of the curved reach.
The transverse velocities near the convex bank resulting from these two processes affect flow separation. From the bend entrance to about
 $15^{\circ }$
into the bend, the secondary flow is weak, and
$15^{\circ }$
into the bend, the secondary flow is weak, and
 $v_{n}<0$
over the entire water column (figure 3
b–d), which opposes flow separation. From about
$v_{n}<0$
over the entire water column (figure 3
b–d), which opposes flow separation. From about
 $15^{\circ }$
into the bend, outward transverse velocities related to the secondary flow become larger than inward transverse velocities related to the mass transport, resulting in outward transverse velocities near the water surface (figure 3
b) that favour flow separation from the convex bank. In the lower part of the water column (figure 3
c), on the contrary, the resulting transverse velocities induced by both processes are inwards over the entire length of the curved reach and oppose flow separation. Between the cross-sections at
$15^{\circ }$
into the bend, outward transverse velocities related to the secondary flow become larger than inward transverse velocities related to the mass transport, resulting in outward transverse velocities near the water surface (figure 3
b) that favour flow separation from the convex bank. In the lower part of the water column (figure 3
c), on the contrary, the resulting transverse velocities induced by both processes are inwards over the entire length of the curved reach and oppose flow separation. Between the cross-sections at
 $15^{\circ }$
and
$15^{\circ }$
and
 $30^{\circ }$
into the curved reach, the depth-averaged transverse velocity
$30^{\circ }$
into the curved reach, the depth-averaged transverse velocity
 $U_{n}$
also changes sign and becomes outward oriented (figure 3
d).
$U_{n}$
also changes sign and becomes outward oriented (figure 3
d).
The sign reversal of
 $U_{n}$
near the convex bank seems to be a good indicator for the onset of flow separation, which occurs just downstream of the cross-section at
$U_{n}$
near the convex bank seems to be a good indicator for the onset of flow separation, which occurs just downstream of the cross-section at
 $30^{\circ }$
into the bend. There, the main body of flow, including the core of highest velocities, separates from the convex bank (figure 3
a). Slower moving fluid occupies the region between the convex bank and the core of highest velocities. The velocity gradient is maximum at the abrupt lateral transition between the slow and fast moving fluids, where an internal shear layer occurs. No flow recirculation occurs in the zone of slow fluid, however, and velocities remain positive, i.e. the flow is still moving downstream. The zone of flow separation widens in the streamwise direction, but velocity gradients between the slow and fast moving fluids weaken and have almost vanished at the cross-section at
$30^{\circ }$
into the bend. There, the main body of flow, including the core of highest velocities, separates from the convex bank (figure 3
a). Slower moving fluid occupies the region between the convex bank and the core of highest velocities. The velocity gradient is maximum at the abrupt lateral transition between the slow and fast moving fluids, where an internal shear layer occurs. No flow recirculation occurs in the zone of slow fluid, however, and velocities remain positive, i.e. the flow is still moving downstream. The zone of flow separation widens in the streamwise direction, but velocity gradients between the slow and fast moving fluids weaken and have almost vanished at the cross-section at
 $150^{\circ }$
into the bend (figure 3
a) These characteristics correspond to the first stage of flow separation (figure 1
c).
$150^{\circ }$
into the bend (figure 3
a) These characteristics correspond to the first stage of flow separation (figure 1
c).
The edge of the zone of convex bank flow separation is indicated in figures 2 and 3 and all subsequent figures. The criteria for delimiting the separation zone will be discussed in § 3.3 once all relevant aspects of the flow field are presented.
Near the water surface, a streak of high outward transverse velocities induced by the convex bank flow separation is clearly distinguishable from the streak induced by the secondary flow (figure 3
b). The smallest outward transverse velocities at the water surface are observed near the shear layer at the edge of the zone of convex bank flow separation. Depth-averaged transverse velocities are small within the zone of convex bank flow separation (about
 $0.02U$
), and show considerable positive values just outside this zone (maximum value of about
$0.02U$
), and show considerable positive values just outside this zone (maximum value of about
 $0.08U$
in cross-section at
$0.08U$
in cross-section at
 $90^{\circ }$
) (figure 3
d). The pattern of inward near bed transverse velocities (figure 3
c), on the contrary, does not show a relation to the convex bank flow separation.
$90^{\circ }$
) (figure 3
d). The pattern of inward near bed transverse velocities (figure 3
c), on the contrary, does not show a relation to the convex bank flow separation.
Figure 3(e) shows the measured pattern of normalized depth-averaged tke. Additional strain induced by the secondary flow causes an increase of tke in the bend, notably in the central parts of the cross-sections. This process has been explained and modelled by Blanckaert (Reference Blanckaert2009). Another zone of additional depth-averaged tke is clearly related to the internal shear layer induced by the process of convex bank separation: it originates near the convex bank and moves away from the bank in the downstream direction. Depth-averaged tke reaches maximum values in the cross-section at
 $120^{\circ }$
into the bend that are approximately two and a half times higher than those in the straight inflow reach. In the straight outflow reach, the tke levels recover towards values for flow in the straight approach reach.
$120^{\circ }$
into the bend that are approximately two and a half times higher than those in the straight inflow reach. In the straight outflow reach, the tke levels recover towards values for flow in the straight approach reach.
3.2. Patterns of flow and turbulence in cross-sections
Patterns of the streamwise velocity
 $v_{s}$
, streamwise vorticity
$v_{s}$
, streamwise vorticity
 ${\it\omega}_{s}$
and tke are examined for the F16 experiment in the cross-section at
${\it\omega}_{s}$
and tke are examined for the F16 experiment in the cross-section at
 $30^{\circ }$
in the bend just upstream of the zone of convex bank flow separation, as well as in the cross-sections at
$30^{\circ }$
in the bend just upstream of the zone of convex bank flow separation, as well as in the cross-sections at
 $60^{\circ }$
,
$60^{\circ }$
,
 $90^{\circ }$
,
$90^{\circ }$
,
 $120^{\circ }$
and
$120^{\circ }$
and
 $150^{\circ }$
within the bend. Although the entire cross-sectional patterns are shown, the discussion focuses on the process of convex bank flow separation. We refer to Blanckaert (Reference Blanckaert2009) and Blanckaert et al. (Reference Blanckaert, Duarte, Chen and Schleiss2012) for a discussion of the other flow processes.
$150^{\circ }$
within the bend. Although the entire cross-sectional patterns are shown, the discussion focuses on the process of convex bank flow separation. We refer to Blanckaert (Reference Blanckaert2009) and Blanckaert et al. (Reference Blanckaert, Duarte, Chen and Schleiss2012) for a discussion of the other flow processes.

Figure 4. Normalized streamwise velocity
 $v_{s}/U$
in the cross-sections at
$v_{s}/U$
in the cross-sections at
 $30^{\circ },60^{\circ },90^{\circ },120^{\circ }$
and
$30^{\circ },60^{\circ },90^{\circ },120^{\circ }$
and
 $150^{\circ }$
in the bend in the F16 experiment. A vertical profile is shown at
$150^{\circ }$
in the bend in the F16 experiment. A vertical profile is shown at
 $n=-0.53~\text{m}$
; the horizontal line in this profile indicates
$n=-0.53~\text{m}$
; the horizontal line in this profile indicates
 $v_{s}/U=1$
. The white line delimits the zone of convex bank flow separation (§ 3.3). The dashed lines indicate the measuring grid. The same colour bar is used in all figures.
$v_{s}/U=1$
. The white line delimits the zone of convex bank flow separation (§ 3.3). The dashed lines indicate the measuring grid. The same colour bar is used in all figures.
The cross-sectional patterns of the normalized streamwise velocity,
 $v_{s}/U$
, are illustrated in figure 4. The abrupt transverse tilting of the water surface in the region of strongly increasing curvature is accompanied by strongly enhanced streamwise water surface gradients near the convex bank (figure 2) that cause flow acceleration, and explain the occurrence of the core of highest streamwise velocities close to the convex bank in the cross-section at
$v_{s}/U$
, are illustrated in figure 4. The abrupt transverse tilting of the water surface in the region of strongly increasing curvature is accompanied by strongly enhanced streamwise water surface gradients near the convex bank (figure 2) that cause flow acceleration, and explain the occurrence of the core of highest streamwise velocities close to the convex bank in the cross-section at
 $30^{\circ }$
. From approximately
$30^{\circ }$
. From approximately
 $40^{\circ }$
into the bend, the main flow separates from the convex bank and the core of highest velocities moves farther away from the bank. A zone of convex bank flow separation with substantially lower streamwise velocities develops between the convex bank and the core of highest velocities. In the cross-sections at
$40^{\circ }$
into the bend, the main flow separates from the convex bank and the core of highest velocities moves farther away from the bank. A zone of convex bank flow separation with substantially lower streamwise velocities develops between the convex bank and the core of highest velocities. In the cross-sections at
 $60^{\circ }$
and
$60^{\circ }$
and
 $90^{\circ }$
into the bend (figure 4
b,c), high velocity gradients clearly demarcate the separation between the zones of slow and fast flow, and identify an internal shear layer. In these cross-sections, the difference between minimum near-surface velocities at the inner side of the shear layer and maximum near-surface velocities at the outer side of the shear layer is about 0.5
$90^{\circ }$
into the bend (figure 4
b,c), high velocity gradients clearly demarcate the separation between the zones of slow and fast flow, and identify an internal shear layer. In these cross-sections, the difference between minimum near-surface velocities at the inner side of the shear layer and maximum near-surface velocities at the outer side of the shear layer is about 0.5
 $U$
. The zone of convex-bank flow separation widens in streamwise direction, but velocity gradients at the edge of the separation zone also attenuate, as illustrated by the patterns in the cross-sections at
$U$
. The zone of convex-bank flow separation widens in streamwise direction, but velocity gradients at the edge of the separation zone also attenuate, as illustrated by the patterns in the cross-sections at
 $120^{\circ }$
and
$120^{\circ }$
and
 $150^{\circ }$
into the bend (figure 4
d,e). The flow separation zone is not homogenous over the water column: it narrows from the water surface towards the bed, and does not reach onto the bed. Vertical profiles of the streamwise velocity extending through the separation zone are strongly deformed, with low velocities near the water surface and maximum values near the bed underneath the separation zone (figure 4).
$150^{\circ }$
into the bend (figure 4
d,e). The flow separation zone is not homogenous over the water column: it narrows from the water surface towards the bed, and does not reach onto the bed. Vertical profiles of the streamwise velocity extending through the separation zone are strongly deformed, with low velocities near the water surface and maximum values near the bed underneath the separation zone (figure 4).
The cross-sectional patterns of secondary flow in the F16 experiment are illustrated in figure 5 by means of the normalized streamwise vorticity,
 ${\it\omega}_{s}H/U$
. The patterns reveal a centre region cell of secondary flow (
${\it\omega}_{s}H/U$
. The patterns reveal a centre region cell of secondary flow (
 ${\it\omega}_{s}<0$
) induced by streamline curvature, and a counter-rotating outer bank cell of secondary flow (
${\it\omega}_{s}<0$
) induced by streamline curvature, and a counter-rotating outer bank cell of secondary flow (
 ${\it\omega}_{s}>0$
). Both these secondary flow cells are described and analysed by Blanckaert (Reference Blanckaert2009) and Blanckaert et al. (Reference Blanckaert, Duarte, Chen and Schleiss2012). A zone of reversed streamwise vorticity,
${\it\omega}_{s}>0$
). Both these secondary flow cells are described and analysed by Blanckaert (Reference Blanckaert2009) and Blanckaert et al. (Reference Blanckaert, Duarte, Chen and Schleiss2012). A zone of reversed streamwise vorticity,
 ${\it\omega}_{s}>0$
, occurs near the edge of the zone of convex bank flow separation in all cross-sections. It is highlighted by a thick
${\it\omega}_{s}>0$
, occurs near the edge of the zone of convex bank flow separation in all cross-sections. It is highlighted by a thick
 ${\it\omega}_{s}=0$
isoline in figure 5. It is still clearly visible at
${\it\omega}_{s}=0$
isoline in figure 5. It is still clearly visible at
 $150^{\circ }$
into the bend, where the velocity gradients are already considerably attenuated (figure 4
e). The zone of reversed vorticity
$150^{\circ }$
into the bend, where the velocity gradients are already considerably attenuated (figure 4
e). The zone of reversed vorticity
 ${\it\omega}_{s}>0$
clearly separates a zone of negative vorticity within the zone of convex bank flow separation from the zone of negative vorticity induced by centre region cell of secondary flow.
${\it\omega}_{s}>0$
clearly separates a zone of negative vorticity within the zone of convex bank flow separation from the zone of negative vorticity induced by centre region cell of secondary flow.

Figure 5. Normalized streamwise vorticity
 ${\it\omega}_{s}H/U$
in the cross-sections at
${\it\omega}_{s}H/U$
in the cross-sections at
 $30^{\circ },60^{\circ },90^{\circ },120^{\circ }$
and
$30^{\circ },60^{\circ },90^{\circ },120^{\circ }$
and
 $150^{\circ }$
in the bend in the F16 experiment. The white line delimits the zone of convex bank flow separation (§ 3.3). The black lines schematically indicate the pattern of secondary flow cells. The reversal of
$150^{\circ }$
in the bend in the F16 experiment. The white line delimits the zone of convex bank flow separation (§ 3.3). The black lines schematically indicate the pattern of secondary flow cells. The reversal of
 ${\it\omega}_{s}$
near the edge of the separation zone is highlighted by a thick
${\it\omega}_{s}$
near the edge of the separation zone is highlighted by a thick
 ${\it\omega}_{s}=0$
isoline. The same colour bar is used in all figures.
${\it\omega}_{s}=0$
isoline. The same colour bar is used in all figures.
Figure 6 analyses the secondary flow patterns in the zone of convex bank flow separation and near its edge in the cross-section at
 $90^{\circ }$
. Outside the zone of convex bank flow separation,
$90^{\circ }$
. Outside the zone of convex bank flow separation,
 $n>-0.35$
, the centre region cell of secondary flow induced by streamline curvature is clearly discernible (figure 6
a–d). Near the edge of the zone of convex bank flow separation, the vertical gradient of the transverse velocity,
$n>-0.35$
, the centre region cell of secondary flow induced by streamline curvature is clearly discernible (figure 6
a–d). Near the edge of the zone of convex bank flow separation, the vertical gradient of the transverse velocity,
 $\partial v_{n}/\partial z$
is reversed (figure 6
a), and the vertical velocity
$\partial v_{n}/\partial z$
is reversed (figure 6
a), and the vertical velocity
 $v_{z}$
changes sign (figure 6
b). Surprisingly, downward velocities,
$v_{z}$
changes sign (figure 6
b). Surprisingly, downward velocities,
 $v_{z}<0$
, occur in a large portion of the separation zone. The vector and streamline patterns of (
$v_{z}<0$
, occur in a large portion of the separation zone. The vector and streamline patterns of (
 $v_{n},v_{z}$
) (figure 6
c,d) show, however, that the reversal of
$v_{n},v_{z}$
) (figure 6
c,d) show, however, that the reversal of
 ${\it\omega}_{s}$
,
${\it\omega}_{s}$
,
 $\partial v_{n}/\partial z$
and
$\partial v_{n}/\partial z$
and
 $v_{z}$
does not lead to an additional counter-rotating secondary flow cell, despite the distinct zones of negative streamwise vorticity (figure 5).
$v_{z}$
does not lead to an additional counter-rotating secondary flow cell, despite the distinct zones of negative streamwise vorticity (figure 5).

Figure 6. Secondary flow in the inner part of the cross-section at
 $90^{\circ }$
in the bend in the F16 experiment. The black line delimits the zone of convex bank flow separation (§ 3.3). (a) Normalized transverse velocity
$90^{\circ }$
in the bend in the F16 experiment. The black line delimits the zone of convex bank flow separation (§ 3.3). (a) Normalized transverse velocity
 $v_{n}/U$
(%), (b) normalized vertical velocity
$v_{n}/U$
(%), (b) normalized vertical velocity
 $v_{z}/U$
(%), (c,e,g) vector representation of (
$v_{z}/U$
(%), (c,e,g) vector representation of (
 $v_{n},v_{z}$
) and its contributions related to the centre region cell of secondary flow (
$v_{n},v_{z}$
) and its contributions related to the centre region cell of secondary flow (
 $v_{n,CRC},v_{z,CRC}$
) and convex-bank flow separation (
$v_{n,CRC},v_{z,CRC}$
) and convex-bank flow separation (
 $v_{n,FS},v_{z,FS}$
), respectively (d) streamline representation of (
$v_{n,FS},v_{z,FS}$
), respectively (d) streamline representation of (
 $v_{n},v_{z}$
), and (f,h) contributions to the normalized streamwise vorticity
$v_{n},v_{z}$
), and (f,h) contributions to the normalized streamwise vorticity
 ${\it\omega}_{s}H/U$
(figure 5
c) related to the centre region cell of secondary flow,
${\it\omega}_{s}H/U$
(figure 5
c) related to the centre region cell of secondary flow,
 ${\it\omega}_{s,CRC}H/U$
, and convex bank flow separation
${\it\omega}_{s,CRC}H/U$
, and convex bank flow separation
 ${\it\omega}_{s,FS}H/U$
, respectively.
${\it\omega}_{s,FS}H/U$
, respectively.
The secondary flow patterns are further analysed by decomposing (
 $v_{n},v_{z}$
) and
$v_{n},v_{z}$
) and
 ${\it\omega}_{s}$
into a part corresponding to the curvature-induced centre region cell of secondary flow, (
${\it\omega}_{s}$
into a part corresponding to the curvature-induced centre region cell of secondary flow, (
 $v_{n,CRC},v_{z,CRC}$
) and
$v_{n,CRC},v_{z,CRC}$
) and
 ${\it\omega}_{s,CRC}$
, and a part related the convex bank flow separation, (
${\it\omega}_{s,CRC}$
, and a part related the convex bank flow separation, (
 $v_{n,FS},v_{z,FS}$
) and
$v_{n,FS},v_{z,FS}$
) and
 ${\it\omega}_{s,FS}$
. First,
${\it\omega}_{s,FS}$
. First,
 $v_{n,CRC}$
is obtained by parabolic interpolation between
$v_{n,CRC}$
is obtained by parabolic interpolation between
 $v_{n}=0$
at the convex bank and the measured
$v_{n}=0$
at the convex bank and the measured
 $v_{n}$
value at the outer edge of the zone of flow separation (
$v_{n}$
value at the outer edge of the zone of flow separation (
 $n=-0.35$
in the F16 experiment), where
$n=-0.35$
in the F16 experiment), where
 $\partial v_{n}/\partial n=0$
is imposed. This interpolation is inspired by numerical simulations with a RANS model by Koken et al. (Reference Koken, Constantinescu and Blanckaert2013, their figure 5), which predicted a centre region cell of secondary flow that covers the entire width of the cross-section. The vertical velocity
$\partial v_{n}/\partial n=0$
is imposed. This interpolation is inspired by numerical simulations with a RANS model by Koken et al. (Reference Koken, Constantinescu and Blanckaert2013, their figure 5), which predicted a centre region cell of secondary flow that covers the entire width of the cross-section. The vertical velocity
 $v_{z,CRC}$
is then obtained by solving the equation for mass conservation,
$v_{z,CRC}$
is then obtained by solving the equation for mass conservation,
 $\partial v_{n,CRC}/\partial n+\partial v_{z,CRC}/\partial z=0$
. The vector pattern (
$\partial v_{n,CRC}/\partial n+\partial v_{z,CRC}/\partial z=0$
. The vector pattern (
 $v_{n,CRC},v_{z,CRC}$
) and corresponding vorticity
$v_{n,CRC},v_{z,CRC}$
) and corresponding vorticity
 ${\it\omega}_{s,CRC}$
are shown in figure 6(e,f). Subtracting these from the measured (
${\it\omega}_{s,CRC}$
are shown in figure 6(e,f). Subtracting these from the measured (
 $v_{n},v_{z}$
) and corresponding
$v_{n},v_{z}$
) and corresponding
 ${\it\omega}_{s}$
yields (
${\it\omega}_{s}$
yields (
 $v_{n,FS},v_{z,FS}$
) and
$v_{n,FS},v_{z,FS}$
) and
 ${\it\omega}_{s,FS}$
(figure 6
g,h). This conceptual decomposition reveals that the convex bank flow separation is related to a secondary flow cell that co-rotates with the centre region cell, and has similar maximum vorticity levels (figures 5
c and 6
h). This conceptual decomposition also explains the different streaks of outward transverse velocities near the water surface associated with the convex bank flow separation and the centre region cell, respectively, that were observed in figure 3(b). Both the transverse gradient
${\it\omega}_{s,FS}$
(figure 6
g,h). This conceptual decomposition reveals that the convex bank flow separation is related to a secondary flow cell that co-rotates with the centre region cell, and has similar maximum vorticity levels (figures 5
c and 6
h). This conceptual decomposition also explains the different streaks of outward transverse velocities near the water surface associated with the convex bank flow separation and the centre region cell, respectively, that were observed in figure 3(b). Both the transverse gradient
 $\partial v_{z}/\partial n\approx \partial v_{z,FS}/\partial n$
(figure 6
b) and vertical gradient
$\partial v_{z}/\partial n\approx \partial v_{z,FS}/\partial n$
(figure 6
b) and vertical gradient
 $\partial v_{n,FS}/\partial z$
(figure 6
g) contribute to the generation of a core of opposite vorticity
$\partial v_{n,FS}/\partial z$
(figure 6
g) contribute to the generation of a core of opposite vorticity
 ${\it\omega}_{s,FS}>0$
near the edge of the zone of convex bank flow separation, whereby
${\it\omega}_{s,FS}>0$
near the edge of the zone of convex bank flow separation, whereby
 $\partial v_{z}/\partial n$
constitutes the dominant contribution (not shown). Maximum positive values of
$\partial v_{z}/\partial n$
constitutes the dominant contribution (not shown). Maximum positive values of
 ${\it\omega}_{s,FS}$
are comparable in magnitude to the maximum negative values of
${\it\omega}_{s,FS}$
are comparable in magnitude to the maximum negative values of
 ${\it\omega}_{s}$
occurring in the zone of convex bank flow separation and in the centre region cell of secondary flow.
${\it\omega}_{s}$
occurring in the zone of convex bank flow separation and in the centre region cell of secondary flow.
Van Balen et al. (Reference Van Balen, Blanckaert and Uijttewaal2010) and Koken et al. (Reference Koken, Constantinescu and Blanckaert2013) successfully simulated the secondary flow patterns in the experiment examined here with eddy resolving numerical models. RANS models, on the contrary, predicted a centre region cell of secondary flow that covered the entire cross-section. These numerical results suggest that the structure of turbulence plays an essential role in the generation of the additional secondary flow cells related to the convex bank flow separation. Accurate simulation of this additional secondary flow cell is a requisite for the accurate simulation of the process of convex bank separation, including the internal shear layer. The role of turbulence will be further investigated in § 5. Eddy resolving numerical simulations by Ottevanger (Reference Ottevanger2013, his figure 5.3) indicate the existence of a similar convex bank secondary flow cell in axisymmetric curved flow, which is defined as flow in an infinite bend of constant curvature where all streamwise gradients have vanished. Because flow separation from the convex bank is by definition impossible in axisymmetric flow, this numerical result indicates that the convex bank secondary flow cell is not a result of the convex bank flow separation, but may contribute to its onset.
The cross-sectional patterns of tke in the F16 experiment are illustrated in figure 7. The centre region cell of secondary flow (figure 5) is clearly the dominant process with respect to the generation of additional tke (figure 7) in the bend. The most pronounced increase in tke occurs near the centre of the centre region cell, as best illustrated in the cross-sections at
 $30^{\circ }$
and
$30^{\circ }$
and
 $60^{\circ }$
into the bend. Convex bank flow separation enhances tke in two ways. First, an increase in tke occurs near the edge of the zone of convex bank flow separation. It is best discernible in the cross-sections at
$60^{\circ }$
into the bend. Convex bank flow separation enhances tke in two ways. First, an increase in tke occurs near the edge of the zone of convex bank flow separation. It is best discernible in the cross-sections at
 $60^{\circ }$
and
$60^{\circ }$
and
 $90^{\circ }$
in the bend, weakens considerably in the cross-section at
$90^{\circ }$
in the bend, weakens considerably in the cross-section at
 $120^{\circ }$
, and has vanished at
$120^{\circ }$
, and has vanished at
 $150^{\circ }$
. Figure 8(a) shows that the streamwise turbulent normal stress
$150^{\circ }$
. Figure 8(a) shows that the streamwise turbulent normal stress
 $\overline{v_{s}^{\prime 2}}$
is the main contribution to the increased tke near the edge of the zone of convex bank flow separation. Second, the zone of convex bank flow separation confines the streamwise flow (figure 4) and the core of maximum vorticity associated with the centre region cell of secondary flow (figure 5) to the lower part of the water column, below the zone of convex bank flow separation. This confinement leads to enhanced values of streamwise velocity, vorticity and associated tke. Figure 8(b) shows that the transverse turbulent normal stress
$\overline{v_{s}^{\prime 2}}$
is the main contribution to the increased tke near the edge of the zone of convex bank flow separation. Second, the zone of convex bank flow separation confines the streamwise flow (figure 4) and the core of maximum vorticity associated with the centre region cell of secondary flow (figure 5) to the lower part of the water column, below the zone of convex bank flow separation. This confinement leads to enhanced values of streamwise velocity, vorticity and associated tke. Figure 8(b) shows that the transverse turbulent normal stress
 $\overline{v_{n}^{\prime 2}}$
is the main contribution to the increased tke below the zone of convex bank flow separation. It is also the main contribution to the core of maximum tke related to the centre region cell of secondary flow. The vertical turbulent normal stress
$\overline{v_{n}^{\prime 2}}$
is the main contribution to the increased tke below the zone of convex bank flow separation. It is also the main contribution to the core of maximum tke related to the centre region cell of secondary flow. The vertical turbulent normal stress
 $\overline{v_{z}^{\prime 2}}$
(figure 8
c) is smaller than the other two components, but still of a dominant order of magnitude.
$\overline{v_{z}^{\prime 2}}$
(figure 8
c) is smaller than the other two components, but still of a dominant order of magnitude.

Figure 7. Normalized tke
 $k/u_{\ast ,0}^{2}$
in the cross-sections at
$k/u_{\ast ,0}^{2}$
in the cross-sections at
 $30^{\circ },60^{\circ },90^{\circ },120^{\circ }$
and
$30^{\circ },60^{\circ },90^{\circ },120^{\circ }$
and
 $150^{\circ }$
in the bend in the F16 experiment. The white line delimits the zone of convex bank flow separation (§ 3.3). The same colour bar is used in all figures.
$150^{\circ }$
in the bend in the F16 experiment. The white line delimits the zone of convex bank flow separation (§ 3.3). The same colour bar is used in all figures.

Figure 8. Normalized turbulent normal stresses and shear stresses in the cross-section at
 $90^{\circ }$
in the bend in the F16 experiment. (a)
$90^{\circ }$
in the bend in the F16 experiment. (a)
 $\overline{v_{s}^{\prime 2}}/u_{\ast ,0}^{2}$
, (b)
$\overline{v_{s}^{\prime 2}}/u_{\ast ,0}^{2}$
, (b)
 $\overline{v_{n}^{\prime 2}}/u_{\ast ,0}^{2}$
, (c)
$\overline{v_{n}^{\prime 2}}/u_{\ast ,0}^{2}$
, (c)
 $\overline{v_{z}^{\prime 2}}/u_{\ast ,0}^{2}$
, (d)
$\overline{v_{z}^{\prime 2}}/u_{\ast ,0}^{2}$
, (d)
 $\overline{v_{s}^{\prime }v_{n}^{\prime }}/u_{\ast ,0}^{2}$
, (e)
$\overline{v_{s}^{\prime }v_{n}^{\prime }}/u_{\ast ,0}^{2}$
, (e)
 $\overline{v_{s}^{2}v_{z}^{\prime }}/u_{\ast ,0}^{2}$
, (f)
$\overline{v_{s}^{2}v_{z}^{\prime }}/u_{\ast ,0}^{2}$
, (f)
 $\overline{v_{n}^{\prime }v_{z}^{\prime }}/u_{\ast ,0}^{2}$
. The white line delimits the zone of convex bank flow separation (§ 3.3).
$\overline{v_{n}^{\prime }v_{z}^{\prime }}/u_{\ast ,0}^{2}$
. The white line delimits the zone of convex bank flow separation (§ 3.3).
Contrary to straight uniform open channel flow where
 $\overline{v_{s}^{\prime }v_{n}^{\prime }},\overline{v_{n}^{\prime }v_{z}^{\prime }}\ll \overline{v_{s}^{\prime }v_{z}^{\prime }}$
(Sukhodolov, Thiele & Bungartz Reference Sukhodolov, Thiele and Bungartz1998), all three turbulent shear stresses are of similar magnitude in curved open channel flow (figure 8). Especially the shear stresses
$\overline{v_{s}^{\prime }v_{n}^{\prime }},\overline{v_{n}^{\prime }v_{z}^{\prime }}\ll \overline{v_{s}^{\prime }v_{z}^{\prime }}$
(Sukhodolov, Thiele & Bungartz Reference Sukhodolov, Thiele and Bungartz1998), all three turbulent shear stresses are of similar magnitude in curved open channel flow (figure 8). Especially the shear stresses
 $\overline{v_{s}^{\prime }v_{n}^{\prime }}$
and
$\overline{v_{s}^{\prime }v_{n}^{\prime }}$
and
 $\overline{v_{s}^{\prime }v_{z}^{\prime }}$
, which represent the shear induced by cross-sectional gradients in the streamwise velocity, reach high values near the shear layer at the edge of the zone of convex bank flow separation. The shear layer is characterized by pronounced positive values of the turbulent shear stress
$\overline{v_{s}^{\prime }v_{z}^{\prime }}$
, which represent the shear induced by cross-sectional gradients in the streamwise velocity, reach high values near the shear layer at the edge of the zone of convex bank flow separation. The shear layer is characterized by pronounced positive values of the turbulent shear stress
 $\overline{v_{s}^{\prime }v_{z}^{\prime }}$
(figure 8
e). The pattern of
$\overline{v_{s}^{\prime }v_{z}^{\prime }}$
(figure 8
e). The pattern of
 $\overline{v_{n}^{\prime }v_{z}^{\prime }}$
(figure 8
f) relates to the secondary flow cells (figure 5
c). This shear stress shows a sign reversal in the shear layer, which coincides with the region of opposite vorticity (cf. figure 5
c). The pattern of
$\overline{v_{n}^{\prime }v_{z}^{\prime }}$
(figure 8
f) relates to the secondary flow cells (figure 5
c). This shear stress shows a sign reversal in the shear layer, which coincides with the region of opposite vorticity (cf. figure 5
c). The pattern of
 $\overline{v_{s}^{\prime }v_{n}^{\prime }}$
(figure 8
d) shows pronounced variations in the zone of convex bank flow separation.
$\overline{v_{s}^{\prime }v_{n}^{\prime }}$
(figure 8
d) shows pronounced variations in the zone of convex bank flow separation.
3.3. Dependence of convex bank flow separation on flow depth
Figures 9–11 show patterns of the most relevant flow variables in the cross-section at
 $135^{\circ }$
into the bend in the F11 experiment and at
$135^{\circ }$
into the bend in the F11 experiment and at
 $75^{\circ }$
into the bend in the F21 experiment. A change in flow depth
$75^{\circ }$
into the bend in the F21 experiment. A change in flow depth
 $H$
causes different values of the non-dimensional parameters
$H$
causes different values of the non-dimensional parameters
 $H/R$
,
$H/R$
,
 $C_{f}^{-1}H/B$
and Fr, which are all known to be important control parameters in curved open channel flow.
$C_{f}^{-1}H/B$
and Fr, which are all known to be important control parameters in curved open channel flow.

Figure 9. Patterns of flow variables in the cross-section at
 $135^{\circ }$
in the bend in the F11 experiment (a) normalized streamwise velocity
$135^{\circ }$
in the bend in the F11 experiment (a) normalized streamwise velocity
 $v_{s}/U$
; a vertical profile is shown at
$v_{s}/U$
; a vertical profile is shown at
 $n=-0.53~\text{m}$
; the horizontal line in this profile indicates
$n=-0.53~\text{m}$
; the horizontal line in this profile indicates
 $v_{s}/U\!=\!1$
, (b) normalized vertical velocity
$v_{s}/U\!=\!1$
, (b) normalized vertical velocity
 $v_{z}/U$
(%), (c) normalized streamwise vorticity
$v_{z}/U$
(%), (c) normalized streamwise vorticity
 ${\it\omega}_{s}H/U$
, (d) normalized tke
${\it\omega}_{s}H/U$
, (d) normalized tke
 $k/u_{\ast ,0}^{2}$
, (e) normalized turbulent normal stress
$k/u_{\ast ,0}^{2}$
, (e) normalized turbulent normal stress
 $\overline{v_{s}^{\prime 2}}/u_{\ast ,0}^{2}$
and (f) normalized turbulent shear stress
$\overline{v_{s}^{\prime 2}}/u_{\ast ,0}^{2}$
and (f) normalized turbulent shear stress
 $\overline{v_{s}^{\prime }v_{z}^{\prime }}/u_{\ast ,0}^{2}$
. The measuring grid is indicated in (a). The white line delimits the zone of convex bank flow separation (§ 3.3). Same colour bars as in corresponding figures 4, 5, 7, 8 and 10.
$\overline{v_{s}^{\prime }v_{z}^{\prime }}/u_{\ast ,0}^{2}$
. The measuring grid is indicated in (a). The white line delimits the zone of convex bank flow separation (§ 3.3). Same colour bars as in corresponding figures 4, 5, 7, 8 and 10.

Figure 10. Patterns of flow variables in the cross-section at
 $75^{\circ }$
in the bend in the F21 experiment (a) normalized streamwise velocity
$75^{\circ }$
in the bend in the F21 experiment (a) normalized streamwise velocity
 $v_{s}/U$
; a vertical profile is shown at
$v_{s}/U$
; a vertical profile is shown at
 $n=-0.53~\text{m}$
; the horizontal line in this profile indicates
$n=-0.53~\text{m}$
; the horizontal line in this profile indicates
 $v_{s}/U\!=\!1$
, (b) normalized vertical velocity
$v_{s}/U\!=\!1$
, (b) normalized vertical velocity
 $v_{z}/U$
(%), (c) normalized streamwise vorticity
$v_{z}/U$
(%), (c) normalized streamwise vorticity
 ${\it\omega}_{s}H/U$
, (d) normalized tke
${\it\omega}_{s}H/U$
, (d) normalized tke
 $k/u_{\ast ,0}^{2}$
, (e) normalized turbulent normal stress
$k/u_{\ast ,0}^{2}$
, (e) normalized turbulent normal stress
 $\overline{v_{s}^{\prime 2}}/u_{\ast ,0}^{2}$
and (f) normalized turbulent shear stress
$\overline{v_{s}^{\prime 2}}/u_{\ast ,0}^{2}$
and (f) normalized turbulent shear stress
 $\overline{v_{s}^{\prime }\,v_{z}^{\prime }}/u_{\ast ,0}^{2}$
. The measuring grid is indicated in (a). The white line delimits the zone of convex bank flow separation (§ 3.3). Same colour bars as in corresponding figures 4, 5, 7–9.
$\overline{v_{s}^{\prime }\,v_{z}^{\prime }}/u_{\ast ,0}^{2}$
. The measuring grid is indicated in (a). The white line delimits the zone of convex bank flow separation (§ 3.3). Same colour bars as in corresponding figures 4, 5, 7–9.

Figure 11. Secondary flow in the inner part of the cross-section. (a,c,e) at
 $135^{\circ }$
in the bend in the F11 experiment, and (b,d,f) at
$135^{\circ }$
in the bend in the F11 experiment, and (b,d,f) at
 $75^{\circ }$
in the bend in the F21 experiment. (a,b) streamwise vorticity
$75^{\circ }$
in the bend in the F21 experiment. (a,b) streamwise vorticity
 ${\it\omega}_{s,CRC}H/U$
related to the centre region cell of secondary flow, (c,d) streamwise vorticity
${\it\omega}_{s,CRC}H/U$
related to the centre region cell of secondary flow, (c,d) streamwise vorticity
 ${\it\omega}_{s,FS}H/U$
related to the convex bank flow separation, (e,f) vector representation (
${\it\omega}_{s,FS}H/U$
related to the convex bank flow separation, (e,f) vector representation (
 $v_{n,FS},v_{z,FS}$
) of secondary flow related to the convex bank flow separation. The black line delimits the zone of convex bank flow separation (§ 3.3). Same colour bar as in figure 6(f,h).
$v_{n,FS},v_{z,FS}$
) of secondary flow related to the convex bank flow separation. The black line delimits the zone of convex bank flow separation (§ 3.3). Same colour bar as in figure 6(f,h).
The zone of convex bank flow separation has a width at the water surface of
 $1H$
at the cross-section at
$1H$
at the cross-section at
 $75^{\circ }$
into the bend in the F21 experiment (figure 10), and of
$75^{\circ }$
into the bend in the F21 experiment (figure 10), and of
 $0.7H$
and
$0.7H$
and
 $1.5H$
in the cross-sections at
$1.5H$
in the cross-sections at
 $60^{\circ }$
and
$60^{\circ }$
and
 $90^{\circ }$
into the bend, respectively, in the F16 experiment (figure 4). The width of the separation zone in the F11 experiment at
$90^{\circ }$
into the bend, respectively, in the F16 experiment (figure 4). The width of the separation zone in the F11 experiment at
 $135^{\circ }$
into the bend is
$135^{\circ }$
into the bend is
 $2.4H$
(figure 9), and it increases from
$2.4H$
(figure 9), and it increases from
 $2.4H$
to
$2.4H$
to
 $2.8H$
in the F16 experiment from
$2.8H$
in the F16 experiment from
 $120^{\circ }$
to
$120^{\circ }$
to
 $150^{\circ }$
into the bend (figure 4). These observations indicate that the width of the zone of convex bank flow separation primarily scales with the flow depth. In the three experiments, the flow separation zone narrows from the water surface towards the bed (figures 4, 9, 10) and does not extend to the bed.
$150^{\circ }$
into the bend (figure 4). These observations indicate that the width of the zone of convex bank flow separation primarily scales with the flow depth. In the three experiments, the flow separation zone narrows from the water surface towards the bed (figures 4, 9, 10) and does not extend to the bed.
Vertical profiles of the streamwise velocity extending through the separation zone are strongly deformed (figures 4, 9
a, 10
a), with low velocities near the water surface and maximum values near the bed underneath the separation zone. In the three experiments, defining characteristics at the edge of the zone of convex bank flow separation are the occurrence of a shear layer, high velocity gradients and inflexion points in the velocity profiles (figures 4, 9, 10), a zone of reversed vorticity
 ${\it\omega}_{s}>0$
(figures 5, 9, 10), reversal of the vertical velocities (figures 6, 9, 10), enhanced tke that is mainly due to the streamwise turbulent normal stress
${\it\omega}_{s}>0$
(figures 5, 9, 10), reversal of the vertical velocities (figures 6, 9, 10), enhanced tke that is mainly due to the streamwise turbulent normal stress
 $\overline{v_{s}^{\prime 2}}$
(figures 8, 10) and high positive values of the shear stress
$\overline{v_{s}^{\prime 2}}$
(figures 8, 10) and high positive values of the shear stress
 $\overline{v_{s}^{\prime }v_{z}^{\prime }}$
(figures 8–10). The streamwise turbulent normal stress
$\overline{v_{s}^{\prime }v_{z}^{\prime }}$
(figures 8–10). The streamwise turbulent normal stress
 $\overline{v_{s}^{\prime 2}}$
and tke recover fastest to their background values, and do not show a clear signature of the convex bank flow separation in the cross-section at
$\overline{v_{s}^{\prime 2}}$
and tke recover fastest to their background values, and do not show a clear signature of the convex bank flow separation in the cross-section at
 $150^{\circ }$
in the F16 experiment (figure 7), and in the cross-section at
$150^{\circ }$
in the F16 experiment (figure 7), and in the cross-section at
 $135^{\circ }$
in the F11 experiment (figure 9). On the contrary, the streamwise vorticity
$135^{\circ }$
in the F11 experiment (figure 9). On the contrary, the streamwise vorticity
 ${\it\omega}_{s}$
(figures 5 and 9), vertical velocity
${\it\omega}_{s}$
(figures 5 and 9), vertical velocity
 $v_{z}$
(figure 9) and shear stress
$v_{z}$
(figure 9) and shear stress
 $\overline{v_{s}^{\prime }v_{z}^{\prime }}$
(figure 9) still clearly show the signature of the convex bank flow separation in these cross-sections. The position of the edge of the zone of convex bank flow separation has been estimated from these characteristics and indicated in all relevant figures. This estimation involves some ‘expert’ judgment, because the defining characteristics of flow separation associated with the different flow variables do not occur at exactly the same location. In the F21 experiment, for example, the inflexion point in the
$\overline{v_{s}^{\prime }v_{z}^{\prime }}$
(figure 9) still clearly show the signature of the convex bank flow separation in these cross-sections. The position of the edge of the zone of convex bank flow separation has been estimated from these characteristics and indicated in all relevant figures. This estimation involves some ‘expert’ judgment, because the defining characteristics of flow separation associated with the different flow variables do not occur at exactly the same location. In the F21 experiment, for example, the inflexion point in the
 $v_{s}$
profiles, the sign reversal in
$v_{s}$
profiles, the sign reversal in
 $v_{z}$
and the zone of reversed
$v_{z}$
and the zone of reversed
 ${\it\omega}_{s}$
are slightly offset (figure 10
a–c). Therefore the position of the edge of the separation zone should be considered approximate.
${\it\omega}_{s}$
are slightly offset (figure 10
a–c). Therefore the position of the edge of the separation zone should be considered approximate.
In a similar manner to the F16 experiment (figure 6), the secondary flow patterns in the F11 and F21 experiments can also be decomposed in a curvature-induced centre region cell and a co-rotating turbulence-induced cell related to the convex bank flow separation (figure 11). A zone of opposed vorticity,
 ${\it\omega}_{s,FS}>0$
, also occurs near the edge of the zone of convex bank flow separation. The maximum magnitude of the negative values of
${\it\omega}_{s,FS}>0$
, also occurs near the edge of the zone of convex bank flow separation. The maximum magnitude of the negative values of
 ${\it\omega}_{s,FS}$
in the core of the secondary flow cell related to the convex bank flow separation, and the maximum magnitude of the positive values of
${\it\omega}_{s,FS}$
in the core of the secondary flow cell related to the convex bank flow separation, and the maximum magnitude of the positive values of
 ${\it\omega}_{s,FS}$
near the edge of the separation zone are smallest in the F11 experiment, and similar in the F16 and F21 experiments (figures 6 and 11). The increasing value of the curvature ratio
${\it\omega}_{s,FS}$
near the edge of the separation zone are smallest in the F11 experiment, and similar in the F16 and F21 experiments (figures 6 and 11). The increasing value of the curvature ratio
 $H/R$
, and the different locations around the bend of the investigated cross-sections might be responsible for these different maximum vorticity magnitudes.
$H/R$
, and the different locations around the bend of the investigated cross-sections might be responsible for these different maximum vorticity magnitudes.
These results show that the main characteristics of the flow and turbulence in the zone of convex bank flow separation are similar for the three investigated flow depths. The F11 experiment is not appropriate for further analysis of convex bank flow separation because the signature of the flow separation on some turbulence characteristics has already weakened too much in the investigated cross-section at
 $135^{\circ }$
into the bend. Analysis of the physics underlying convex bank flow separation has yielded similar results for the F16 and F21 experiments; therefore only an analysis of the F16 experiment will be reported in the forthcoming sections.
$135^{\circ }$
into the bend. Analysis of the physics underlying convex bank flow separation has yielded similar results for the F16 and F21 experiments; therefore only an analysis of the F16 experiment will be reported in the forthcoming sections.
4. Momentum considerations and their relation to convex bank flow separation
4.1. Momentum equations
The depth-averaged momentum equations can be written in curvilinear coordinates in the following form (Jin & Steffler Reference Jin and Steffler1993):
 $$\begin{eqnarray}\displaystyle & \displaystyle \frac{\partial U_{i}h}{\partial t}=\text{GRAV}_{i}+\left(-\frac{{\it\tau}_{bi}}{{\it\rho}}\right)+\text{INERT}_{i}+\text{VERT}_{i}+\text{TURB}_{i}+O({\it\nu})\quad (i=s,n)\quad & \displaystyle\end{eqnarray}$$
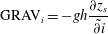 $$\begin{eqnarray}\displaystyle & \displaystyle \text{GRAV}_{i}=-gh\frac{\partial z_{s}}{\tilde{\partial i}} & \displaystyle\end{eqnarray}$$
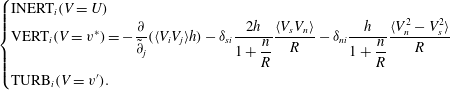 $$\begin{eqnarray}\left\{\begin{array}{@{}l@{}}\displaystyle \text{INERT}_{i}(V=U)\quad \\ \displaystyle \text{VERT}_{i}(V=v^{\ast })=-\frac{\partial }{\tilde{\partial }_{j}}(\langle V_{i}V_{j}\rangle h)-{\it\delta}_{si}\frac{2h}{1+\displaystyle \frac{n}{R}}\frac{\langle V_{s}V_{n}\rangle }{R}-{\it\delta}_{ni}\frac{h}{1+\displaystyle \frac{n}{R}}\frac{\langle V_{n}^{2}-V_{s}^{2}\rangle }{R}\quad \\ \displaystyle \text{TURB}_{i}(V=v^{\prime }).\quad \end{array}\right.\end{eqnarray}$$
Here
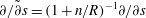 $\partial /\tilde{\partial }s=(1+n/R)^{-1}\partial /\partial s$
and
$\partial /\tilde{\partial }s=(1+n/R)^{-1}\partial /\partial s$
and
 $\partial /\tilde{\partial }n=\partial /\partial n$
,
$\partial /\tilde{\partial }n=\partial /\partial n$
,
 ${\it\delta}$
is the Kronecker symbol,
${\it\delta}$
is the Kronecker symbol,
 $\langle \,\rangle$
is the depth-averaging operator and the Einstein summation convention is applied. The elevation of the water surface is given by
$\langle \,\rangle$
is the depth-averaging operator and the Einstein summation convention is applied. The elevation of the water surface is given by
 $z_{s}$
and
$z_{s}$
and
 $h$
indicates the local flow depth. In (4.3), the local flow velocity
$h$
indicates the local flow depth. In (4.3), the local flow velocity
 $v_{i}~(i=s,n)$
has been decomposed into time- and depth-averaged values,
$v_{i}~(i=s,n)$
has been decomposed into time- and depth-averaged values,
 $\langle v_{i}\rangle =U_{i}$
, local time-averaged spatial deviations,
$\langle v_{i}\rangle =U_{i}$
, local time-averaged spatial deviations,
 $v_{i}^{\ast }$
and temporal fluctuations,
$v_{i}^{\ast }$
and temporal fluctuations,
 $v_{i}^{\prime }$
:
$v_{i}^{\prime }$
:
 $$\begin{eqnarray}v_{i}=\langle v_{i}\rangle +v_{i}^{\ast }+v_{i}^{\prime }=U_{i}+v_{i}^{\ast }+v_{i}^{\prime }.\end{eqnarray}$$
The examined experiments concern steady flow, but the unsteady term is retained in (4.1) to facilitate interpretation: positive/negative terms on the right-hand side tend to increase/decrease
 $U_{i}$
. The term GRAV in (4.1) represents the gravitational forcing of the flow, which occurs through water surface gradients in open channel flow. The bed shear stress
$U_{i}$
. The term GRAV in (4.1) represents the gravitational forcing of the flow, which occurs through water surface gradients in open channel flow. The bed shear stress
 ${\it\tau}_{b}$
opposes the flow. The term INERT mainly represents inertial effects related to the depth-averaged flow field. The term VERT represents the effect of the vertical structure of the flow, including momentum redistribution by the secondary flow and the term TURB represents turbulence effects. The terms in (4.3) multiplied by the Kronecker symbol appear due to the transformation from Cartesian to curvilinear coordinates. They include the centrifugal force in the term
${\it\tau}_{b}$
opposes the flow. The term INERT mainly represents inertial effects related to the depth-averaged flow field. The term VERT represents the effect of the vertical structure of the flow, including momentum redistribution by the secondary flow and the term TURB represents turbulence effects. The terms in (4.3) multiplied by the Kronecker symbol appear due to the transformation from Cartesian to curvilinear coordinates. They include the centrifugal force in the term
 $\text{INERT}_{n}$
. The term
$\text{INERT}_{n}$
. The term
 $O({\it\nu})$
represents viscous dissipation, and is known to be small.
$O({\it\nu})$
represents viscous dissipation, and is known to be small.
The terms GRAV, INERT, VERT and TURB can be estimated from the experimental data, which would in theory allow estimation of the magnitude of the bed shear stress from (4.1). Error propagation, however, prevents a reliable quantitative estimation of the bed shear stress. The streamwise and transverse components of the bed shear stress,
 ${\it\tau}_{bi}~(i=s,n)$
are of order of magnitude 1
${\it\tau}_{bi}~(i=s,n)$
are of order of magnitude 1
 ${\it\tau}_{bs,bend}/{\it\rho}$
, where
${\it\tau}_{bs,bend}/{\it\rho}$
, where
 ${\it\tau}_{bs,bend}$
is the bend-averaged bed shear stress. According to the experimental data investigated here, the terms GRAV, INERT and VERT are of order of magnitude 10
${\it\tau}_{bs,bend}$
is the bend-averaged bed shear stress. According to the experimental data investigated here, the terms GRAV, INERT and VERT are of order of magnitude 10
 ${\it\tau}_{bs,bend}/{\it\rho}$
, and TURB is of order of magnitude 1
${\it\tau}_{bs,bend}/{\it\rho}$
, and TURB is of order of magnitude 1
 ${\it\tau}_{bs,bend}/{\it\rho}$
. Blanckaert & de Vriend (Reference Blanckaert and de Vriend2004) estimated the experimental uncertainty in the term GRAV at about 2 %, and at about 20 % in the terms INERT, VERT and TURB. In absolute values, this means that the experimental uncertainty in the terms INERT and VERT is of order of magnitude 2
${\it\tau}_{bs,bend}/{\it\rho}$
. Blanckaert & de Vriend (Reference Blanckaert and de Vriend2004) estimated the experimental uncertainty in the term GRAV at about 2 %, and at about 20 % in the terms INERT, VERT and TURB. In absolute values, this means that the experimental uncertainty in the terms INERT and VERT is of order of magnitude 2
 ${\it\tau}_{bs,bend}/{\it\rho}$
, and the corresponding uncertainty in their sum of order of magnitude
${\it\tau}_{bs,bend}/{\it\rho}$
, and the corresponding uncertainty in their sum of order of magnitude
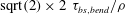 $\text{sqrt}(2)\times 2~{\it\tau}_{bs,bend}/{\it\rho}$
, which is considerably larger than the magnitude of the bed shear stress components. Hence, the magnitude of the bed shear stress will not be estimated from (4.1) but from near bed flow measurements performed with high spatial resolution. A term-by-term analysis of (4.1) based on the experimental data does provide insight in the relative importance of the different flow processes governing the velocity redistribution and convex bank flow separation.
$\text{sqrt}(2)\times 2~{\it\tau}_{bs,bend}/{\it\rho}$
, which is considerably larger than the magnitude of the bed shear stress components. Hence, the magnitude of the bed shear stress will not be estimated from (4.1) but from near bed flow measurements performed with high spatial resolution. A term-by-term analysis of (4.1) based on the experimental data does provide insight in the relative importance of the different flow processes governing the velocity redistribution and convex bank flow separation.
4.2. Streamwise bed shear stress
The bed shear stress is the most important flow parameter with respect to frictional energy losses and the morphologic development in loose boundary configurations. It is often represented by means of a Chézy-type dimensionless friction factor, which relates the bed shear stress to the depth-averaged velocity:
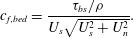 $$\begin{eqnarray}c_{f,bed}=\frac{{\it\tau}_{bs}/{\it\rho}}{U_{s}\sqrt{U_{s}^{2}+U_{n}^{2}}}.\end{eqnarray}$$

Figure 12. Friction coefficient 1000
 $c_{f,bed}$
based on high-resolution measurements in the indicated cross-sections. (a) F16 experiment. The black line approximately delimits the zone of convex bank flow separation at the water surface (§ 3.3); (b) experiments according to label in Figure; the horizontal lines of constant value represent the flume-averaged value of 1000
$c_{f,bed}$
based on high-resolution measurements in the indicated cross-sections. (a) F16 experiment. The black line approximately delimits the zone of convex bank flow separation at the water surface (§ 3.3); (b) experiments according to label in Figure; the horizontal lines of constant value represent the flume-averaged value of 1000
 $\tilde{C}_{f}$
(table 2).
$\tilde{C}_{f}$
(table 2).
Figure 12 shows the distribution around the bend of
 $c_{f,bed}$
, estimated from the velocity measurements. The estimation of
$c_{f,bed}$
, estimated from the velocity measurements. The estimation of
 $U_{s}$
and
$U_{s}$
and
 $U_{n}$
from the measured velocity patterns (figures 4, 9, 10) is straightforward. The estimation of
$U_{n}$
from the measured velocity patterns (figures 4, 9, 10) is straightforward. The estimation of
 ${\it\tau}_{bs}$
from the velocity measurements is more difficult. In straight uniform open channel flows, Nezu & Nakagawa (Reference Nezu and Nakagawa1993) have proposed a semi-theoretical logarithmic profile for the mean velocity, semi-theoretical exponential profiles for the turbulent normal stresses and the tke and a semi-theoretical linear profile for the streamwise vertical turbulent shear stress
${\it\tau}_{bs}$
from the velocity measurements is more difficult. In straight uniform open channel flows, Nezu & Nakagawa (Reference Nezu and Nakagawa1993) have proposed a semi-theoretical logarithmic profile for the mean velocity, semi-theoretical exponential profiles for the turbulent normal stresses and the tke and a semi-theoretical linear profile for the streamwise vertical turbulent shear stress
 $\overline{v_{s}^{\prime }v_{z}^{\prime }}$
, which all scale with the bed shear stress. Fitting of the measured vertical profiles to these semi-theoretical similarity solutions allows estimation of the bed shear stress in straight uniform flow. Nezu & Nakagawa (Reference Nezu and Nakagawa1993) report considerable differences between estimates based on the different flow quantities in straight uniform laboratory flows. Wilcock (Reference Wilcock1996), Biron et al. (Reference Biron, Lane, Roy, Bradbrook and Richards1998), Kim et al. (Reference Kim, Friedrichs, Maa and Wright2000), Biron et al. (Reference Biron, Robson, Lapointe and Gaskin2004) and Sime, Ferguson & Church (Reference Sime, Ferguson and Church2007) have compared and analysed the same methods in various configurations of quasi-straight, shallow open channel flow. Their findings indicate that the estimation based on the near bed tke is most reliable. For the estimation based on the logarithmic velocity profile, these investigations show that the inclusion of near bed measurements is crucial. Jamieson et al. (Reference Jamieson, Post and Rennie2010), Termini & Piraino (Reference Termini and Piraino2011) and Sukhodolov (Reference Sukhodolov2012) (for configurations with mobile bed topography) and Abad & Garcia (Reference Abad and Garcia2009) (for cases with flat immobile bed topography) have shown that the vertical profiles of the turbulent normal stresses, the turbulent shear stresses and the tke differ fundamentally in a curved open channel flow from their counterparts in straight open channel flow. This is confirmed by figures 7–10. These discrepancies invalidate Nezu & Nakagawa’s (Reference Nezu and Nakagawa1993) approach based on semi-theoretical similarity profiles for turbulent flow quantities in sharply curved open channel flows. Therefore, it can be inferred that the best estimation in such flows is obtained by fitting a logarithmic profile to the measured profile of the streamwise velocity in the inner 20 % of the boundary layer close to bed. The profiling capacity of the ADVP allowed measuring with high spatial resolution in the lower 20 % of the water column and resulted in a bed shear stress estimation with an uncertainty of approximately 20 % (Duarte Reference Duarte2008).
$\overline{v_{s}^{\prime }v_{z}^{\prime }}$
, which all scale with the bed shear stress. Fitting of the measured vertical profiles to these semi-theoretical similarity solutions allows estimation of the bed shear stress in straight uniform flow. Nezu & Nakagawa (Reference Nezu and Nakagawa1993) report considerable differences between estimates based on the different flow quantities in straight uniform laboratory flows. Wilcock (Reference Wilcock1996), Biron et al. (Reference Biron, Lane, Roy, Bradbrook and Richards1998), Kim et al. (Reference Kim, Friedrichs, Maa and Wright2000), Biron et al. (Reference Biron, Robson, Lapointe and Gaskin2004) and Sime, Ferguson & Church (Reference Sime, Ferguson and Church2007) have compared and analysed the same methods in various configurations of quasi-straight, shallow open channel flow. Their findings indicate that the estimation based on the near bed tke is most reliable. For the estimation based on the logarithmic velocity profile, these investigations show that the inclusion of near bed measurements is crucial. Jamieson et al. (Reference Jamieson, Post and Rennie2010), Termini & Piraino (Reference Termini and Piraino2011) and Sukhodolov (Reference Sukhodolov2012) (for configurations with mobile bed topography) and Abad & Garcia (Reference Abad and Garcia2009) (for cases with flat immobile bed topography) have shown that the vertical profiles of the turbulent normal stresses, the turbulent shear stresses and the tke differ fundamentally in a curved open channel flow from their counterparts in straight open channel flow. This is confirmed by figures 7–10. These discrepancies invalidate Nezu & Nakagawa’s (Reference Nezu and Nakagawa1993) approach based on semi-theoretical similarity profiles for turbulent flow quantities in sharply curved open channel flows. Therefore, it can be inferred that the best estimation in such flows is obtained by fitting a logarithmic profile to the measured profile of the streamwise velocity in the inner 20 % of the boundary layer close to bed. The profiling capacity of the ADVP allowed measuring with high spatial resolution in the lower 20 % of the water column and resulted in a bed shear stress estimation with an uncertainty of approximately 20 % (Duarte Reference Duarte2008).
Integration of the depth-averaged momentum equation (4.1) around the curved reach, indicated by the subscript bend, approximately yields:
 $$\begin{eqnarray}\frac{{\it\tau}_{bs,bend}}{{\it\rho}}\approx -gR_{h,bend}E_{s,bend},\end{eqnarray}$$
where
 $R_{h,bend}$
is the bend-averaged hydraulic radius, and
$R_{h,bend}$
is the bend-averaged hydraulic radius, and
 $E_{s,bend}$
is the energy slope in the bend obtained by a linear fit to the cross-sectionally-averaged energy levels
$E_{s,bend}$
is the energy slope in the bend obtained by a linear fit to the cross-sectionally-averaged energy levels
 $E=H+U^{2}/(2g)$
along the curved reach. In the F16 experiment, the bend-averaged bed shear stress
$E=H+U^{2}/(2g)$
along the curved reach. In the F16 experiment, the bend-averaged bed shear stress
 ${\it\tau}_{bs,bend}/{\it\rho}$
estimated from the velocity patterns,
${\it\tau}_{bs,bend}/{\it\rho}$
estimated from the velocity patterns,
 ${\it\tau}_{bs,bend}/{\it\rho}=1.08\times 10^{-3}~\text{m}^{2}~\text{s}^{-2}$
, is nearly identical to the value estimated from
${\it\tau}_{bs,bend}/{\it\rho}=1.08\times 10^{-3}~\text{m}^{2}~\text{s}^{-2}$
, is nearly identical to the value estimated from
 $R_{h,bend}$
and
$R_{h,bend}$
and
 $E_{s,bend}$
of
$E_{s,bend}$
of
 $-gR_{h,bend},E_{sbend}=1.07\times 10^{-3}~\text{m}^{2}~\text{s}^{-2}$
, which provides support for the general reliability of the estimated patterns of the friction factor
$-gR_{h,bend},E_{sbend}=1.07\times 10^{-3}~\text{m}^{2}~\text{s}^{-2}$
, which provides support for the general reliability of the estimated patterns of the friction factor
 $c_{f,bed}$
shown in figure 12.
$c_{f,bed}$
shown in figure 12.
The friction factor
 $c_{f,bed}$
increases around the bend in the F16 experiment (figure 12
a), which can mainly be attributed to the gradual deformation of the vertical profiles of the velocity. The maximum velocities are situated at the water surface near the bend entry, and then gradually move towards the lower part of the water column (figure 4). This deformation of the velocity profile increases the near bed velocity gradients and the bed shear stress without modifying the depth-averaged velocity, and therefore leads to an increase of
$c_{f,bed}$
increases around the bend in the F16 experiment (figure 12
a), which can mainly be attributed to the gradual deformation of the vertical profiles of the velocity. The maximum velocities are situated at the water surface near the bend entry, and then gradually move towards the lower part of the water column (figure 4). This deformation of the velocity profile increases the near bed velocity gradients and the bed shear stress without modifying the depth-averaged velocity, and therefore leads to an increase of
 $c_{f,bed}$
(4.5).
$c_{f,bed}$
(4.5).
The major feature in the patterns of
 $c_{f,bed}$
is, however, its pronounced increase beneath the zone of convex bank flow separation, with values that are enhanced by up to 50 %. This increase is most pronounced in the initial part of the zone of convex bank flow separation, and weakens in the downstream direction. Similar increased values of
$c_{f,bed}$
is, however, its pronounced increase beneath the zone of convex bank flow separation, with values that are enhanced by up to 50 %. This increase is most pronounced in the initial part of the zone of convex bank flow separation, and weakens in the downstream direction. Similar increased values of
 $c_{f,bed}$
are found beneath the zone of convex bank flow separation in the F11 and F21 experiments (figure 12
b). The velocity patterns shown in figures 4, 9 and 10 confirm that this increase is mainly due to the deformation of the profiles of the streamwise velocity, which have low values within the zone of convex bank flow separation situated in the upper part of the water column, and high values below the zone of convex bank flow separation near the bottom.
$c_{f,bed}$
are found beneath the zone of convex bank flow separation in the F11 and F21 experiments (figure 12
b). The velocity patterns shown in figures 4, 9 and 10 confirm that this increase is mainly due to the deformation of the profiles of the streamwise velocity, which have low values within the zone of convex bank flow separation situated in the upper part of the water column, and high values below the zone of convex bank flow separation near the bottom.
The pronounced transverse variation of
 $c_{f,bed}$
has important consequences for numerical modelling by means of depth-averaged flow models, which are typically used for long-time and large-scale morphological simulations. These models are inherently unable to resolve the three-dimensional nature of the zone of convex bank flow separation. They could be able, however, to resolve the deceleration of the depth-averaged streamwise velocities
$c_{f,bed}$
has important consequences for numerical modelling by means of depth-averaged flow models, which are typically used for long-time and large-scale morphological simulations. These models are inherently unable to resolve the three-dimensional nature of the zone of convex bank flow separation. They could be able, however, to resolve the deceleration of the depth-averaged streamwise velocities
 $U_{s}$
adjacent to the convex bank (figure 3
a) and the related outward depth-averaged transverse velocities
$U_{s}$
adjacent to the convex bank (figure 3
a) and the related outward depth-averaged transverse velocities
 $U_{n}$
(figure 3
d). Such models require the prescription of
$U_{n}$
(figure 3
d). Such models require the prescription of
 $c_{f,bed}$
as input parameter. The common choice of a constant value of
$c_{f,bed}$
as input parameter. The common choice of a constant value of
 $c_{f,bed}$
will lead to an underestimation of flow friction near the convex bank, and hence an underestimation of the deceleration of
$c_{f,bed}$
will lead to an underestimation of flow friction near the convex bank, and hence an underestimation of the deceleration of
 $U_{s}$
and the outward
$U_{s}$
and the outward
 $U_{n}$
, which will hamper the accurate simulation of the flow near the convex bank.
$U_{n}$
, which will hamper the accurate simulation of the flow near the convex bank.
4.3. Transverse momentum balance
As mentioned in § 3.1, the sign reversal of
 $U_{n}$
near the convex bank (figure 3
d) seems to be a good indicator for the onset of flow separation. The term-by-term analysis of the transverse momentum equation (4.1) provides insight into the relative importance of the flow processes governing the distribution of
$U_{n}$
near the convex bank (figure 3
d) seems to be a good indicator for the onset of flow separation. The term-by-term analysis of the transverse momentum equation (4.1) provides insight into the relative importance of the flow processes governing the distribution of
 $U_{n}$
. Figure 13 shows the different terms in the transverse momentum equation (4.1) normalized by the bend-averaged streamwise bed shear stress
$U_{n}$
. Figure 13 shows the different terms in the transverse momentum equation (4.1) normalized by the bend-averaged streamwise bed shear stress
 ${\it\tau}_{bs,bend}/{\it\rho}$
(4.6). The transverse bed shear stress has been estimated from the near bed velocity measurements as:
${\it\tau}_{bs,bend}/{\it\rho}$
(4.6). The transverse bed shear stress has been estimated from the near bed velocity measurements as:
 $$\begin{eqnarray}\frac{{\it\tau}_{bn}}{{\it\rho}}=\left[\frac{U_{n}}{U_{s}}+\left(\frac{v_{n}^{\ast }}{v_{s}}\right)_{near\text{-}bed,max}\right]\frac{{\it\tau}_{bs}}{{\it\rho}}.\end{eqnarray}$$
The second term represents the deviation between the direction of the depth-averaged velocity and the bed shear stress, due to the secondary flow. This deviation is estimated from the maximum value of
 $v_{n}^{\ast }/v_{s}$
near the bed.
$v_{n}^{\ast }/v_{s}$
near the bed.

Figure 13. Normalized terms in the transport equation for transverse momentum (4.1) based on high-resolution measurements in the indicated cross-sections in the F16 experiment. (a)
 $({\it\tau}_{bn}/{\it\rho})/({\it\tau}_{bs,bend}/{\it\rho})$
, (b)
$({\it\tau}_{bn}/{\it\rho})/({\it\tau}_{bs,bend}/{\it\rho})$
, (b)
 $\text{VERT}_{n}/({\it\tau}_{bs,bend}/{\it\rho})$
, (c)
$\text{VERT}_{n}/({\it\tau}_{bs,bend}/{\it\rho})$
, (c)
 $\text{TURB}_{n}/({\it\tau}_{bs,bend}/{\it\rho})$
, (d)
$\text{TURB}_{n}/({\it\tau}_{bs,bend}/{\it\rho})$
, (d)
 $(\text{GRAV}_{n}+\text{INERT}_{n})/({\it\tau}_{bs,bend}/{\it\rho})$
. The black line delimits the zone of convex bank flow separation at the water surface (§ 3.3).
$(\text{GRAV}_{n}+\text{INERT}_{n})/({\it\tau}_{bs,bend}/{\it\rho})$
. The black line delimits the zone of convex bank flow separation at the water surface (§ 3.3).
 ${\it\tau}_{bs,bend}/{\it\rho}$
is the bend-averaged streamwise bed shear stress (4.6).
${\it\tau}_{bs,bend}/{\it\rho}$
is the bend-averaged streamwise bed shear stress (4.6).
The evolution of
 ${\it\tau}_{bn}$
around the curved reach (figure 13
a) is similar to the evolution of the near bed transverse velocity (figure 3
c). Maximum values of
${\it\tau}_{bn}$
around the curved reach (figure 13
a) is similar to the evolution of the near bed transverse velocity (figure 3
c). Maximum values of
 ${\it\tau}_{bn}$
are larger than the bend-averaged streamwise bed shear stress
${\it\tau}_{bn}$
are larger than the bend-averaged streamwise bed shear stress
 ${\it\tau}_{bs,bend}/{\it\rho}$
and occur within and just outside the zone of convex bank flow separation. The term
${\it\tau}_{bs,bend}/{\it\rho}$
and occur within and just outside the zone of convex bank flow separation. The term
 $\text{VERT}_{n}$
(figure 13
b) is considerably larger than
$\text{VERT}_{n}$
(figure 13
b) is considerably larger than
 ${\it\tau}_{bn}$
. The positive values outside the zone of convex bank flow separation represent outward transport of momentum induced by the centre region cell of secondary flow. This process has been explained and modelled by Blanckaert & de Vriend (Reference Blanckaert and de Vriend2004). The term
${\it\tau}_{bn}$
. The positive values outside the zone of convex bank flow separation represent outward transport of momentum induced by the centre region cell of secondary flow. This process has been explained and modelled by Blanckaert & de Vriend (Reference Blanckaert and de Vriend2004). The term
 $\text{VERT}_{n}$
becomes negative near the convex bank. This change in sign can be attributed to the additional secondary flow cell related to the convex bank flow separation (figure 6
g). The term
$\text{VERT}_{n}$
becomes negative near the convex bank. This change in sign can be attributed to the additional secondary flow cell related to the convex bank flow separation (figure 6
g). The term
 $\text{TURB}_{n}$
(figure 13
c) is small and does not play an important role in the transverse momentum balance.
$\text{TURB}_{n}$
(figure 13
c) is small and does not play an important role in the transverse momentum balance.
The negative term
 $\text{GRAV}_{n}$
and positive term
$\text{GRAV}_{n}$
and positive term
 $\text{INERT}_{n}$
are dominant in the transverse momentum balance; they attain maximum magnitudes larger than 20
$\text{INERT}_{n}$
are dominant in the transverse momentum balance; they attain maximum magnitudes larger than 20
 ${\it\tau}_{bs,bend}/{\it\rho}$
. Due to inertia, flow tends to move along a straight path at the bend entry, as represented by
${\it\tau}_{bs,bend}/{\it\rho}$
. Due to inertia, flow tends to move along a straight path at the bend entry, as represented by
 $\text{INERT}_{n}$
in the transverse momentum equation written in curvilinear coordinates. Mass accumulation at the outer side of the bend leads to the generation of a transverse tilting of the water surface, and an inward pressure gradient that causes the flow to follow the bend, represented by
$\text{INERT}_{n}$
in the transverse momentum equation written in curvilinear coordinates. Mass accumulation at the outer side of the bend leads to the generation of a transverse tilting of the water surface, and an inward pressure gradient that causes the flow to follow the bend, represented by
 $\text{GRAV}_{n}$
. Figure 13(d) shows the resulting effect
$\text{GRAV}_{n}$
. Figure 13(d) shows the resulting effect
 $\text{GRAV}_{n}+\text{INERT}_{n}$
, The magnitude of
$\text{GRAV}_{n}+\text{INERT}_{n}$
, The magnitude of
 $\text{GRAV}_{n}+\text{INERT}_{n}$
increases just downstream of the bend entry, attains maximum values between
$\text{GRAV}_{n}+\text{INERT}_{n}$
increases just downstream of the bend entry, attains maximum values between
 $30^{\circ }$
and
$30^{\circ }$
and
 $90^{\circ }$
into the bend and subsequently decreases. A core of high positive values of
$90^{\circ }$
into the bend and subsequently decreases. A core of high positive values of
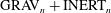 $\text{GRAV}_{n}+\text{INERT}_{n}$
at the convex bank between
$\text{GRAV}_{n}+\text{INERT}_{n}$
at the convex bank between
 $30^{\circ }$
and
$30^{\circ }$
and
 $60^{\circ }$
into the bend seems to be the major cause of the flow separation. Further downstream, values of
$60^{\circ }$
into the bend seems to be the major cause of the flow separation. Further downstream, values of
 $\text{GRAV}_{n}+\text{INERT}_{n}$
remain positive just outside the zone of convex bank flow separation, and are close to zero within the separation zone. In the outer half of the cross-section,
$\text{GRAV}_{n}+\text{INERT}_{n}$
remain positive just outside the zone of convex bank flow separation, and are close to zero within the separation zone. In the outer half of the cross-section,
 $\text{GRAV}_{n}+\text{INERT}_{n}$
is negative. These results highlight and quantify the inertial lag between centrifugal and pressure gradient forces that causes the flow to separate from the convex bank in sharp bends. In the investigated experiments, the flow separation is in the first stage (figure 1).
$\text{GRAV}_{n}+\text{INERT}_{n}$
is negative. These results highlight and quantify the inertial lag between centrifugal and pressure gradient forces that causes the flow to separate from the convex bank in sharp bends. In the investigated experiments, the flow separation is in the first stage (figure 1).
5. Transfer of kinetic energy between mean flow and turbulence and its relation to convex bank flow separation
Van Balen et al. (Reference Van Balen, Blanckaert and Uijttewaal2010) and Koken et al. (Reference Koken, Constantinescu and Blanckaert2013) accurately simulated the process of convex bank flow separation in the F16 experiment examined here with eddy resolving numerical models, whereas RANS models did not provide satisfactory results. The failure of the RANS models is related to their incapacity to resolve the additional turbulence induced secondary flow cell related to the convex bank flow separation (figures 6 and 11). Blanckaert & de Vriend (Reference Blanckaert and de Vriend2004) and Blanckaert et al. (Reference Blanckaert, Duarte, Chen and Schleiss2012) have shown that the transfer of kinetic energy between the mean flow and the turbulence,
 $\mathscr{P}$
, plays an essential role with respect to the generation of turbulence-induced secondary flow cells near concave outer banks.
$\mathscr{P}$
, plays an essential role with respect to the generation of turbulence-induced secondary flow cells near concave outer banks.
 $\mathscr{P}$
is often called the production rate of turbulence, and defined as (Hinze Reference Hinze1975):
$\mathscr{P}$
is often called the production rate of turbulence, and defined as (Hinze Reference Hinze1975):
 $$\begin{eqnarray}\displaystyle \mathscr{P} & = & \displaystyle -\left[\vphantom{\frac{1}{2}}\left(\overline{v_{s}^{\prime 2}}-{\textstyle \frac{2}{3}}k\right)e_{ss}+\left(\overline{v_{n}^{\prime 2}}-{\textstyle \frac{2}{3}}k\right)e_{nn}+\left(\overline{v_{z}^{\prime 2}}-{\textstyle \frac{2}{3}}k\right)e_{zz}\right.\nonumber\\ \displaystyle & & \displaystyle +\,2\left.\overline{v_{s}^{\prime }v_{n}^{\prime }}e_{sn}+2\overline{v_{s}^{\prime }v_{z}^{\prime }}e_{sz}+2\overline{v_{n}^{\prime }v_{z}^{\prime }}e_{nz}\vphantom{\frac{1}{2}}\right]\nonumber\\ \displaystyle & = & \displaystyle \mathscr{P}_{ss}+\mathscr{P}_{nn}+\mathscr{P}_{zz}+\mathscr{P}_{sn}+\mathscr{P}_{sz}+\mathscr{P}_{nz}.\end{eqnarray}$$
The definition of the strain rates
 $e_{ij}~(i,j=s,n,z)$
in the curvilinear reference system are reported in Batchelor (Reference Batchelor1970, p. 600). Blanckaert & de Vriend (Reference Blanckaert and de Vriend2004) and Blanckaert et al. (Reference Blanckaert, Duarte, Chen and Schleiss2012) argued that a kinetic energy transfer from the mean flow to the turbulence,
$e_{ij}~(i,j=s,n,z)$
in the curvilinear reference system are reported in Batchelor (Reference Batchelor1970, p. 600). Blanckaert & de Vriend (Reference Blanckaert and de Vriend2004) and Blanckaert et al. (Reference Blanckaert, Duarte, Chen and Schleiss2012) argued that a kinetic energy transfer from the mean flow to the turbulence,
 $\mathscr{P}>0$
, tends to dissipate turbulence-induced secondary flow cells. They particularly pointed to the role of the kinetic energy transfer via the cross-sectional Reynolds stresses,
$\mathscr{P}>0$
, tends to dissipate turbulence-induced secondary flow cells. They particularly pointed to the role of the kinetic energy transfer via the cross-sectional Reynolds stresses,
 $\mathscr{P}_{nn}+\mathscr{P}_{zz}$
and
$\mathscr{P}_{nn}+\mathscr{P}_{zz}$
and
 $\mathscr{P}_{nz}$
. The present section investigates the role of
$\mathscr{P}_{nz}$
. The present section investigates the role of
 $\mathscr{P}$
and its constituents in the generation of the turbulence-induced secondary flow cell related to the convex bank flow separation, and by extension to the generation of the flow separation. The analysis is performed for the cross-section at
$\mathscr{P}$
and its constituents in the generation of the turbulence-induced secondary flow cell related to the convex bank flow separation, and by extension to the generation of the flow separation. The analysis is performed for the cross-section at
 $90^{\circ }$
into the bend in the F16 experiment. This cross-section is selected because the zone of convex bank flow separation and the shear layer at its edge are well developed and discernible in the measured flow patterns (figures 3–8), and because additional measurements were performed in this cross-section close to the convex bank (figure 4). Measurements in the cross-section at
$90^{\circ }$
into the bend in the F16 experiment. This cross-section is selected because the zone of convex bank flow separation and the shear layer at its edge are well developed and discernible in the measured flow patterns (figures 3–8), and because additional measurements were performed in this cross-section close to the convex bank (figure 4). Measurements in the cross-section at
 $75^{\circ }$
arc length in the bend in the F21 experiment, and at
$75^{\circ }$
arc length in the bend in the F21 experiment, and at
 $60^{\circ }$
and
$60^{\circ }$
and
 $120^{\circ }$
in the F16 experiments, yielded similar results.
$120^{\circ }$
in the F16 experiments, yielded similar results.
Figure 14 shows the patterns of
 $\mathscr{P}$
and the normalized constituents
$\mathscr{P}$
and the normalized constituents
 $\mathscr{P}_{sz}$
,
$\mathscr{P}_{sz}$
,
 $\mathscr{P}_{sn}$
,
$\mathscr{P}_{sn}$
,
 $\mathscr{P}_{nn}+\mathscr{P}_{zz}$
and
$\mathscr{P}_{nn}+\mathscr{P}_{zz}$
and
 $\mathscr{P}_{nz}$
estimated from the experimental data. According to Blanckaert & de Vriend (Reference Blanckaert and de Vriend2004), the uncertainty in the terms
$\mathscr{P}_{nz}$
estimated from the experimental data. According to Blanckaert & de Vriend (Reference Blanckaert and de Vriend2004), the uncertainty in the terms
 $\mathscr{P}_{ij}$
is smaller than 35 %. The zone of convex bank flow separation and the shear layer at its edge leave a clear footprint in the patterns of all presented terms. Values of the term
$\mathscr{P}_{ij}$
is smaller than 35 %. The zone of convex bank flow separation and the shear layer at its edge leave a clear footprint in the patterns of all presented terms. Values of the term
 $\mathscr{P}$
are considerably smaller in the zone of convex bank flow separation than outside this zone. The smallest values of
$\mathscr{P}$
are considerably smaller in the zone of convex bank flow separation than outside this zone. The smallest values of
 $\mathscr{P}$
are found near the core of the turbulence-induced secondary flow cell related to the convex bank flow separation (figure 6
h). Even when taking the high experimental uncertainty into account, they include negative values,
$\mathscr{P}$
are found near the core of the turbulence-induced secondary flow cell related to the convex bank flow separation (figure 6
h). Even when taking the high experimental uncertainty into account, they include negative values,
 $\mathscr{P}<0$
, indicating that turbulent kinetic energy is transmitted from the turbulence to the mean flow, i.e. the secondary flow cell is fed by kinetic energy provided by the turbulence. The normalized terms
$\mathscr{P}<0$
, indicating that turbulent kinetic energy is transmitted from the turbulence to the mean flow, i.e. the secondary flow cell is fed by kinetic energy provided by the turbulence. The normalized terms
 $\mathscr{P}_{sz}$
,
$\mathscr{P}_{sz}$
,
 $\mathscr{P}_{sn}$
,
$\mathscr{P}_{sn}$
,
 $\mathscr{P}_{nn}+\mathscr{P}_{zz}$
are all of order of magnitude one inside the zone of convex bank flow separation, and reach higher magnitudes in the shear layer at the edge of the zone of convex bank flow separation. There, the terms
$\mathscr{P}_{nn}+\mathscr{P}_{zz}$
are all of order of magnitude one inside the zone of convex bank flow separation, and reach higher magnitudes in the shear layer at the edge of the zone of convex bank flow separation. There, the terms
 $\mathscr{P}_{sn}$
, and
$\mathscr{P}_{sn}$
, and
 $\mathscr{P}_{nn}+\mathscr{P}_{zz}$
provide the negative contributions, whereas the term
$\mathscr{P}_{nn}+\mathscr{P}_{zz}$
provide the negative contributions, whereas the term
 $\mathscr{P}_{sz}$
provides the dominant positive contribution.
$\mathscr{P}_{sz}$
provides the dominant positive contribution.

Figure 14. (a) Normalized kinetic energy transfer between the mean flow and the turbulence
 $\mathscr{P}{\it\kappa}H/u_{\ast ,0}^{3}$
(5.1) in the cross-section at
$\mathscr{P}{\it\kappa}H/u_{\ast ,0}^{3}$
(5.1) in the cross-section at
 $90^{\circ }$
in the bend in the F16 experiment, and its constituents: (b)
$90^{\circ }$
in the bend in the F16 experiment, and its constituents: (b)
 $\mathscr{P}_{sz}{\it\kappa}H/u_{\ast ,0}^{3}$
, (c)
$\mathscr{P}_{sz}{\it\kappa}H/u_{\ast ,0}^{3}$
, (c)
 $\mathscr{P}_{sn}{\it\kappa}H/u_{\ast ,0}^{3}$
, (d)
$\mathscr{P}_{sn}{\it\kappa}H/u_{\ast ,0}^{3}$
, (d)
 $(\mathscr{P}_{nn}+\mathscr{P}_{zz}){\it\kappa}H/u_{\ast ,0}^{3}$
, (e)
$(\mathscr{P}_{nn}+\mathscr{P}_{zz}){\it\kappa}H/u_{\ast ,0}^{3}$
, (e)
 $\mathscr{P}_{nz}{\it\kappa}H/u_{\ast ,0}^{3}$
(
$\mathscr{P}_{nz}{\it\kappa}H/u_{\ast ,0}^{3}$
(
 ${\it\kappa}$
is the Karman constant). The white line delimits the zone of convex bank flow separation (§ 3.3).
${\it\kappa}$
is the Karman constant). The white line delimits the zone of convex bank flow separation (§ 3.3).
According to the energy cascade concept, tke is mainly produced through the interaction of the time-averaged flow with large anisotropic turbulence structures, whereas tke is mainly dissipated by quasi-isotropic small turbulent structures. Eddy resolving numerical models directly resolve the large anisotropic turbulence structures, and therefore reproduce accurately the turbulence production rate
 $\mathscr{P}$
and its constituents
$\mathscr{P}$
and its constituents
 $\mathscr{P}_{ij}~(i,j=s,n,z)$
, leading to accurate simulations of the turbulence-induced secondary flow cell near the convex bank, and by extension the process of convex bank flow separation in the experiment reported here. 3-D RANS models with isotropic turbulence closure do not compute the turbulent stresses, but relate them to the strain rates by means of an eddy viscosity (
$\mathscr{P}_{ij}~(i,j=s,n,z)$
, leading to accurate simulations of the turbulence-induced secondary flow cell near the convex bank, and by extension the process of convex bank flow separation in the experiment reported here. 3-D RANS models with isotropic turbulence closure do not compute the turbulent stresses, but relate them to the strain rates by means of an eddy viscosity (
 ${\it\nu}_{t}$
) approach:
${\it\nu}_{t}$
) approach:
 $$\begin{eqnarray}-(\overline{v_{j}^{\prime }v_{k}^{\prime }}-2/3{\it\delta}_{jk}k)=2{\it\nu}_{t}e_{jk}\quad (j,k=s,n,z).\end{eqnarray}$$
This approach leads to strictly positive values of
 $\mathscr{P}$
and all its constituents
$\mathscr{P}$
and all its constituents
 $\mathscr{P}_{ij}$
(5.1), which does not conform with the negative values observed in the zone of convex bank flow separation. These results indicate that the key to understanding and accurately simulating the process of convex bank flow separation resides in the accurate description of the turbulence production rate
$\mathscr{P}_{ij}$
(5.1), which does not conform with the negative values observed in the zone of convex bank flow separation. These results indicate that the key to understanding and accurately simulating the process of convex bank flow separation resides in the accurate description of the turbulence production rate
 $\mathscr{P}$
, which critically depends on the accurate description of all turbulent stresses. Besides eddy resolving models, 3D RANS models that include a transport equation for each of the turbulent stresses should resolve accurately convex bank flow separation.
$\mathscr{P}$
, which critically depends on the accurate description of all turbulent stresses. Besides eddy resolving models, 3D RANS models that include a transport equation for each of the turbulent stresses should resolve accurately convex bank flow separation.
6. Discussion and generalization of results
The laboratory experiments revealed several interrelated flow processes near the convex bank when a sudden change of bankline curvature occurs. First, due to inertia, flow tends to move along a straight path as mainly represented by the outward inertial force. Second, this leads to mass accumulation at the opposite concave bank, and the generation of a transverse tilting of the water surface that provides the inward pressure gradient force required to impose a change of direction on the flow. Third, the development of a transverse tilting of the water surface is accompanied by considerably increased streamwise water surface gradients at the convex bank, and considerably reduced streamwise water surface gradients at the concave bank. As a result, flow accelerates at the convex bank and decelerates at the concave bank. Due to mass conservation, this flow redistribution requires mass transport towards the convex bank that opposes flow separation. Fourth, a curvature-induced secondary flow cell that covers the entire width of the cross-section develops, with velocities away from the convex bank that promote flow separation in the upper part of the water column, and velocities towards the convex bank that oppose flow separation in the lower part of the water column. The secondary flow velocities are largest in the centre of the cross-section, and relatively small near the convex bank. Fifth, a turbulence-induced secondary flow cell develops near the convex bank, with velocities that promote flow separation in the upper part of the water column, and velocities towards the convex bank that oppose flow separation in the lower part of the water column.
The main features and underlying processes related to the convex bank flow separation observed in the investigated schematized laboratory configuration are very similar to observations in natural and engineered open channels and river bends (e.g. Bagnold Reference Bagnold1960; Leeder & Bridges Reference Leeder and Bridges1975; Ferguson et al. Reference Ferguson, Parsons, Lane and Hardy2003; Frothingham & Rhoads Reference Frothingham and Rhoads2003; Nanson Reference Nanson2010; Rhoads & Massey Reference Rhoads and Massey2012; Schnauder & Sukhodolov Reference Schnauder and Sukhodolov2012), as well as other configurations where the flow laterally separates from the banks due to a change in streamline curvature such as confluences (e.g. Best & Reid Reference Best and Reid1984; Rhoads & Kenworthy Reference Rhoads and Kenworthy1995; Rhoads & Sukhodolov Reference Rhoads and Sukhodolov2001; Yang et al. Reference Yang, Wang, Lu and Wang2009) and bifurcations (e.g. Bulle Reference Bulle1926; Neary & Odgaard Reference Neary and Odgaard1993; Dargahi Reference Dargahi2004 and Zinger et al. Reference Zinger, Rhoads, Best and Johnson2014). Numerous previous studies of bends, confluences and bifurcations have indicated that in all these configurations, a complex amalgamation of time-averaged and turbulence processes, including the pressure gradient force and secondary flow associated with the change in flow direction, may or may not lead to flow separation. These similar observations in a variety of configurations indicate that the process of flow separating laterally from the banks of rivers and open channels is a general one that probably occurs similarly in different contexts.
Whether or not convex bank flow separation occurs, the location of its occurrence, and the patterns of the flow variables within the separation zone will depend on the magnitude of these flow processes and the spatial lag between them. In the examined laboratory experiments, mass transport towards the convex bank is dominant near the bend entrance (figure 3 d), which explains why flow does not separate where the largest change in curvature occurs but further downstream (figure 3 a). Flow separation mainly occurs because the inward pressure gradient force spatially lags behind the outward inertial forces (figure 13 d). Outward transport of momentum by inertial forces results in a momentum deficit along the convex bank that leads to flow separation. Numerical simulations by Ottevanger (Reference Ottevanger2013) have shown that the turbulence-induced secondary flow cell near the convex bank (figures 6 and 11) is not the result of convex bank flow separation (see § 3.1), indicating that it is a flow process that contributes to the onset of flow separation. The pattern of secondary flow controls the spatial extent and shape of the zone of convex bank flow separation. The secondary flow velocities away from the convex bank in the upper part of the water column and towards the convex bank in the lower part of the water column (figure 3 b,c) explain why the zone of convex bank flow separation is restricted to the upper part of the water column (figure 4). As a result, velocity gradients are increased beneath the zone of flow separation near the bed (figure 4), leading to a considerably enhanced friction coefficient beneath the zone of convex bank flow separation (figure 12). This enhanced friction coefficient is not a cause of the flow separation, however, but rather a result of it. The width and shape of the separation zone seem to be conditioned by the size of the turbulence-induced secondary flow cell at the convex bank (figures 6 and 11), which scales with the flow depth.
These results indicate important differences between separation of a 2-D boundary layer flow (figure 1 a) and separation of a 3-D flow from a convex bank (figure 1 c). Separation from the boundary develops as turbulent flow moves rapidly into a region of imbalanced forces acting on the flow, leading to a momentum deficit near the boundary. In a 2-D boundary layer, the imbalanced forces are due to an adverse pressure gradient. In convex bank flow separation, the imbalanced forces are due to the inward pressure gradient force that lags spatially behind the outward inertial forces. In 2-D boundary layer separation, the fluid within the separation zone is isolated from the main flow outside the internal shear layer. Only turbulent eddies along the internal shear layer cause momentum transport between the separation zone and the main flow. In convex bank flow separation, secondary flow induced by streamline curvature (figures 5, 6 and 11) enhances momentum transport between the separation zone and the main flow. This additional mechanism of momentum exchange might explain the relatively small difference between the low streamwise velocities within the separation zone and the high free stream velocities (figure 4), which hampers the onset of flow recirculation in the separation zone (second stage of flow separation) (figure 1 d).
An important outstanding question regards when flow may be expected to separate at convex banks in open channel configurations, such as bends, confluences and bifurcations. The outward centrifugal force and inward pressure gradient force scale with
 $B/R$
(Chow Reference Chow1959). This parameter is commonly used to parameterize open channel bends (e.g. Hickin Reference Hickin1974; Markham & Thorne Reference Markham, Thorne, Billi, Hey, Thorne and Tacconi1992; Hooke Reference Hooke2003), but can also be defined in confluences and bifurcations. However, this parameter can only account for the magnitude of these flow processes and not for the spatial lag in their development that was found to be crucial for the onset of flow separation. This spatial lag may be expected to depend on how the curvature varies,
$B/R$
(Chow Reference Chow1959). This parameter is commonly used to parameterize open channel bends (e.g. Hickin Reference Hickin1974; Markham & Thorne Reference Markham, Thorne, Billi, Hey, Thorne and Tacconi1992; Hooke Reference Hooke2003), but can also be defined in confluences and bifurcations. However, this parameter can only account for the magnitude of these flow processes and not for the spatial lag in their development that was found to be crucial for the onset of flow separation. This spatial lag may be expected to depend on how the curvature varies,
 $\partial R^{-1}/\partial s$
, and on the shallowness of the channel, defined by the ratio
$\partial R^{-1}/\partial s$
, and on the shallowness of the channel, defined by the ratio
 $B/H$
. In general, rapid changes in curvature, such as occur in sharply-curved bends and compound loops, or confluences and bifurcations with sharp angles between the branches, should promote separation. Flow separation should also be favoured in shallower rivers, because full establishment of the inward pressure gradient force will require a longer distance through the bend than in deep rivers. This is confirmed by flow visualization (not shown), which revealed that the flow separates from the convex bank at about
$B/H$
. In general, rapid changes in curvature, such as occur in sharply-curved bends and compound loops, or confluences and bifurcations with sharp angles between the branches, should promote separation. Flow separation should also be favoured in shallower rivers, because full establishment of the inward pressure gradient force will require a longer distance through the bend than in deep rivers. This is confirmed by flow visualization (not shown), which revealed that the flow separates from the convex bank at about
 $30^{\circ }$
,
$30^{\circ }$
,
 $40^{\circ }$
and
$40^{\circ }$
and
 $45^{\circ }$
for the F11, F16 and F21 experiments, respectively, which have
$45^{\circ }$
for the F11, F16 and F21 experiments, respectively, which have
 $B/H$
ratios of 12.1, 8.2 and 6.1 (table 2). The location where the flow separates from the convex bank in bends was found to be conditioned by the inward mass transport occurring in regions of increasing curvature. According to Blanckaert & de Vriend (Reference Blanckaert and de Vriend2010, equation (32)), this inward mass transport in bends scales with
$B/H$
ratios of 12.1, 8.2 and 6.1 (table 2). The location where the flow separates from the convex bank in bends was found to be conditioned by the inward mass transport occurring in regions of increasing curvature. According to Blanckaert & de Vriend (Reference Blanckaert and de Vriend2010, equation (32)), this inward mass transport in bends scales with
 $\partial R^{-1}/\partial s$
. This parameter can also be applied to confluences and bifurcations. In sharp bends, the magnitude of the centre region cell of secondary flow scales with the friction coefficient
$\partial R^{-1}/\partial s$
. This parameter can also be applied to confluences and bifurcations. In sharp bends, the magnitude of the centre region cell of secondary flow scales with the friction coefficient
 $c_{f}$
and with the curvature ratio
$c_{f}$
and with the curvature ratio
 $H/R=(H/B)\times (B/R)$
, where
$H/R=(H/B)\times (B/R)$
, where
 $H/B$
represents the shallowness of the flow (Blanckaert & de Vriend Reference Blanckaert and de Vriend2010). Because the secondary flow in confluences and bifurcations is the result of a similar interplay between the centrifugal force and the pressure gradient force, the same control parameters are relevant. It is at present not clear what parameters control the turbulence-induced secondary flow cell near the convex bank. Similar to turbulence-induced secondary flow cells near the concave bank (Blanckaert Reference Blanckaert2011; Blanckaert et al.
Reference Blanckaert, Duarte, Chen and Schleiss2012), the magnitude and size of the turbulence-induced secondary flow cell near the convex bank can be expected to depend on the roughness and inclination of the bank, and the shallowness. In particular, flow separation will be promoted near rougher banks. The importance of inertia in the investigated laboratory experiments suggests that momentum input also plays an important role with respect to convex bank flow separation. In open channel bends and bifurcations, inertial effects are parameterized by the Froude number. Flow obviously does not separate from convex banks for the limiting case
$H/B$
represents the shallowness of the flow (Blanckaert & de Vriend Reference Blanckaert and de Vriend2010). Because the secondary flow in confluences and bifurcations is the result of a similar interplay between the centrifugal force and the pressure gradient force, the same control parameters are relevant. It is at present not clear what parameters control the turbulence-induced secondary flow cell near the convex bank. Similar to turbulence-induced secondary flow cells near the concave bank (Blanckaert Reference Blanckaert2011; Blanckaert et al.
Reference Blanckaert, Duarte, Chen and Schleiss2012), the magnitude and size of the turbulence-induced secondary flow cell near the convex bank can be expected to depend on the roughness and inclination of the bank, and the shallowness. In particular, flow separation will be promoted near rougher banks. The importance of inertia in the investigated laboratory experiments suggests that momentum input also plays an important role with respect to convex bank flow separation. In open channel bends and bifurcations, inertial effects are parameterized by the Froude number. Flow obviously does not separate from convex banks for the limiting case
 $\mathit{Fr}\rightarrow 0$
, and flow separation is common in supercritical flows
$\mathit{Fr}\rightarrow 0$
, and flow separation is common in supercritical flows
 $\mathit{Fr}>1$
. In confluences, the dominant control parameter is the relative momentum input of both confluent river branches, as parameterized by the momentum flux ratio. An increase in the momentum-flux ratio will promote flow separation (Best & Reid Reference Best and Reid1984; Yang et al.
Reference Yang, Wang, Lu and Wang2009).
$\mathit{Fr}>1$
. In confluences, the dominant control parameter is the relative momentum input of both confluent river branches, as parameterized by the momentum flux ratio. An increase in the momentum-flux ratio will promote flow separation (Best & Reid Reference Best and Reid1984; Yang et al.
Reference Yang, Wang, Lu and Wang2009).
The investigated configuration of an open channel bend with a flat bed is representative of engineered channels. The author has performed 32 additional experiments (not shown) in the same laboratory flume with a flat bed, with flow depths in the range 0.065–0.26 m, Froude number in the range 0.1–0.5 and equivalent bed roughness heights of 0.002 and 0.06 m. In none of these experiments was the second stage of flow separation (figure 1) reached, i.e. the internal shear layer did not reattach to the convex bank, and no flow recirculation occurred in the separation zone. On the contrary, the second stage of flow separation is typically reached in natural alluvial open channel bends, confluences and bifurcations, which are characterized by zones of deposition and zones of scour. Blanckaert (Reference Blanckaert2011) and Blanckaert et al. (Reference Blanckaert, Kleinhans, McLelland, Uijttewaal, Murphy, van de Kruijs, Parsons and Chen2013) compared convex bank flow separation in open channel bends with an immobile flat bed to their counterparts in an experiment with a mobile bed under comparable hydraulic conditions. Blanckaert (Reference Blanckaert2011) investigated the experiments in this paper, whereas Blanckaert et al. (Reference Blanckaert, Kleinhans, McLelland, Uijttewaal, Murphy, van de Kruijs, Parsons and Chen2013) considered a different configuration with two opposing bends. These investigations indicate that the interaction between the flow, the sediment transport and the mobile bed topography lead to considerable modifications in the process of convex bank flow separation which reaches the second stage of separation (figure 1). In the investigated mobile bed experiments, flow also separates from the convex bank downstream of the location of maximum curvature change. This indicates that the inward mass transport related to the abrupt change of curvature is also dominant for the case of mobile beds. The secondary flow induced by streamline curvature transports sediment towards the convex bank, and leads to the development of a point bar near the convex bank and scour at the opposite bank. Flow generally tends to go around bars and concentrate in the deepest part of the cross-section. This process, which is commonly called topographic steering (Nelson Reference Nelson1988; Dietrich & Whiting Reference Dietrich, Whiting, Ikeda and Parker1989; Blanckaert Reference Blanckaert2010), causes outward mass transport over the point bar near the convex bank that favours the onset of flow separation. Instead of covering the entire width of the cross-section, the secondary flow cell induced by streamline curvature is restricted over the deepest part of the cross-section. As a result, this secondary flow cell no longer contributes to the momentum exchange between the separation zone and the free stream, which should lead to a larger difference between velocities inside and outside the separation zone. Moreover, the flow is rather homogeneous over the entire water column near the convex bank, and the zone of convex bank flow separation is no longer restricted to the upper part of the water column. It can therefore be expected that the pronounced near bed velocity gradients and enhanced friction factor observed in the experiments in this paper are characteristics of convex bank flow separation over flat beds only. The bathymetry-induced modifications to the flow field lead to a widening of the zone of convex bank flow separation. The reduced flow depth near the convex bank further reduces flow velocities, which favours the onset of flow recirculation, and the reattachment of the internal shear layer at the convex bank. Because the turbulence-induced secondary flow cell scales with the flow depth, its importance can be expected to be minor in mobile bed configurations due to the reduced flow depth over the point bar. The roughness and inclination of the convex bank should also exert less control due to the reduced flow depth near the bank. Comparison of observations in confluences and bifurcations with flat immobile bed, moderate morphological gradients, and pronounced morphological gradients suggest that these considerations can be generalized (e.g. Best & Reid Reference Best and Reid1984; Neary & Odgaard Reference Neary and Odgaard1993; De Serres et al. Reference De Serres, Roy, Biron and Best1999; Rhoads & Sukhodolov Reference Rhoads and Sukhodolov2001; Boyer, Roy & Best Reference Boyer, Roy and Best2006; Yang et al. Reference Yang, Wang, Lu and Wang2009; Hardy, Lane & Yu Reference Hardy, Lane and Yu2011; Leite Ribeiro et al. Reference Leite Ribeiro, Blanckaert, Roy and Schleiss2012; Kleinhans et al. Reference Kleinhans, Ferguson, Lane and Hardy2013).
It follows from the discussion above that convex bank flow separation depends on multiple parameters. The question regarding when flow may be expected to separate at convex banks in open channels cannot be answered with a discriminative value of one simple control parameter. The dominant controls can be divided into three groups. First, the geometry of the open channel reach, as parameterized by the minimum value of the curvature ratio
 $R/B$
, the shallowness
$R/B$
, the shallowness
 $H/B$
and especially the streamwise variation of the curvature,
$H/B$
and especially the streamwise variation of the curvature,
 $\partial R^{-1}/\partial s$
. Second, sedimentologic parameters that will determine how pronounced the bed morphology gradients are, and what values the friction coefficients for the bed and the banks take. Third, the Froude number or momentum-flux ratio, which are the main flow characteristic.
$\partial R^{-1}/\partial s$
. Second, sedimentologic parameters that will determine how pronounced the bed morphology gradients are, and what values the friction coefficients for the bed and the banks take. Third, the Froude number or momentum-flux ratio, which are the main flow characteristic.
The abrupt change of curvature at the bend entrance, uniform radius of curvature in the bend, and the immobile flat bed in the investigated single bend configuration eliminate
 $\partial R^{-1}/\partial s$
and morphologic gradients as control parameters. This configuration is therefore appropriate to investigate in isolation the effect of the control parameters
$\partial R^{-1}/\partial s$
and morphologic gradients as control parameters. This configuration is therefore appropriate to investigate in isolation the effect of the control parameters
 $R/B$
,
$R/B$
,
 $H/B$
,
$H/B$
,
 $c_{f}$
and Fr on the convex bank flow separation. Such a widening of the investigated parameter space can be done by means of numerical models that include a turbulence closure model that accurately resolves the turbulence production rate, which was found to be the key to accurately simulating convex bank flow separation. The validation of such numerical models requires benchmark experimental data, as well as analyses of these data. The reported experiments fill a useful place in the list of required benchmark cases.
$c_{f}$
and Fr on the convex bank flow separation. Such a widening of the investigated parameter space can be done by means of numerical models that include a turbulence closure model that accurately resolves the turbulence production rate, which was found to be the key to accurately simulating convex bank flow separation. The validation of such numerical models requires benchmark experimental data, as well as analyses of these data. The reported experiments fill a useful place in the list of required benchmark cases.
7. Conclusions
The process of flow separation at the convex (inner) bank of sharply curved open channels was successfully reproduced in a schematic laboratory bend with transversally flat bed and smooth vertical banks. This paper documents patterns of mean and turbulent flow quantities in the zone of convex bank flow separation, measured with unprecedented detail and accuracy.
The edge of the zone of convex bank flow separation is characterized by the occurrence of a shear layer, high velocity gradients (figures 4, 9, 10), a zone of reversed vorticity
 ${\it\omega}_{s}>0$
(figures 5, 9, 10), reversal of the vertical velocities (figures 6, 9, 10), enhanced tke that is mainly due to the streamwise turbulent normal stress
${\it\omega}_{s}>0$
(figures 5, 9, 10), reversal of the vertical velocities (figures 6, 9, 10), enhanced tke that is mainly due to the streamwise turbulent normal stress
 $\overline{v_{s}^{\prime 2}}$
(figures 7, 8, 10) and high positive values of the shear stress
$\overline{v_{s}^{\prime 2}}$
(figures 7, 8, 10) and high positive values of the shear stress
 $\overline{v_{s}^{\prime }v_{z}^{\prime }}$
(figures 8–10). The streamwise turbulent normal stress
$\overline{v_{s}^{\prime }v_{z}^{\prime }}$
(figures 8–10). The streamwise turbulent normal stress
 $\overline{v_{s}^{\prime 2}}$
and tke recover faster to their background values than the streamwise vorticity
$\overline{v_{s}^{\prime 2}}$
and tke recover faster to their background values than the streamwise vorticity
 ${\it\omega}_{s}$
(figures 5, 7–10), vertical velocity
${\it\omega}_{s}$
(figures 5, 7–10), vertical velocity
 $v_{z}$
(figures 6, 9, 10) and shear stress
$v_{z}$
(figures 6, 9, 10) and shear stress
 $\overline{v_{s}^{\prime }v_{z}^{\prime }}$
(figures 8–10). The width of the zone of convex bank flow separation primarily scales with the flow depth. The flow separation zone narrows from the water surface towards the bed (figures 4, 9, 10), and does not reach onto the bed. Velocity profiles in the separation zone are strongly deformed with maximum values near the bed and low velocities near the water surface (figures 4, 9, 10), which leads to considerably enhanced bed friction coefficients below the zone of convex bank flow separation (figure 12). Velocities remain positive, i.e. flow is still moving in downstream direction, indicating that the flow separation is in the first stage (figure 1). The secondary flow influences the shape of the zone of convex bank flow separation and the patterns of the flow variables. The pattern of secondary flow can be decomposed into a component induced by streamline curvature, and an additional turbulence-induced component near the convex bank (figures 6, 11).
$\overline{v_{s}^{\prime }v_{z}^{\prime }}$
(figures 8–10). The width of the zone of convex bank flow separation primarily scales with the flow depth. The flow separation zone narrows from the water surface towards the bed (figures 4, 9, 10), and does not reach onto the bed. Velocity profiles in the separation zone are strongly deformed with maximum values near the bed and low velocities near the water surface (figures 4, 9, 10), which leads to considerably enhanced bed friction coefficients below the zone of convex bank flow separation (figure 12). Velocities remain positive, i.e. flow is still moving in downstream direction, indicating that the flow separation is in the first stage (figure 1). The secondary flow influences the shape of the zone of convex bank flow separation and the patterns of the flow variables. The pattern of secondary flow can be decomposed into a component induced by streamline curvature, and an additional turbulence-induced component near the convex bank (figures 6, 11).
Similar flow characteristics occur in a variety of configurations, including bends, confluences and bifurcations, indicating that the process of flow separating laterally from the banks of rivers and open channels is a general one that probably occurs similarly in different contexts. A term-by-term analysis of the depth-averaged transverse momentum equation ((4.1), figure 13) indicates that the inertial adaptation of the flow to the change in curvature plays a major role with respect to convex bank flow separation. When streamline curvature abruptly increases, flow tends to move along a straight path as represented by the inertial forces, including centrifugal effects, in the transverse momentum balance written in curvilinear coordinates. Mass accumulation at the opposite bank leads to the generation of a transverse tilting of the water surface, and a pressure gradient force towards the convex bank that cause the flow to change direction. The pressure gradient force lags spatially behind the inertial forces, which promotes flow separation. An abrupt increase in bankline curvature leads to water surface gradients that cause local flow redistribution towards the convex bank that opposes flow separation (figure 3 d). As a result, flow separation typically occurs downstream of the location of maximum change in bankline curvature (figure 3 a). The zone of convex bank flow separation is shaped by the secondary flow induced by streamline curvature and turbulence (figures 5, 6, 9–11). The key to understanding and to accurately resolving the secondary flow pattern, and by extension the process of convex bank flow separation, is the accurate description of the production rate of tke, and especially the transfer of kinetic energy between the mean flow and the large-scale turbulence structures, which crucially depend on the accurate description of the turbulent normal and shear stresses ((5.1), figure 14).
The dominant control parameters for convex bank flow separation are the geometry of the open channel reach, as parameterized by the minimum value of the curvature ratio
 $R/B$
, the shallowness
$R/B$
, the shallowness
 $H/B$
and especially the streamwise variation of the curvature,
$H/B$
and especially the streamwise variation of the curvature,
 $\partial R^{-1}/\partial s$
, sedimentologic parameters that will determine how pronounced bed morphology gradients are and the Froude number or momentum-flux ratio that represent the momentum input of the flow. The multiple control parameters make the definition of a simple criterion for the onset of flow separation impossible. In general, convex bank flow separation is promoted by rapid changes in curvature, wider rivers and higher Froude numbers or momentum-flux ratios.
$\partial R^{-1}/\partial s$
, sedimentologic parameters that will determine how pronounced bed morphology gradients are and the Froude number or momentum-flux ratio that represent the momentum input of the flow. The multiple control parameters make the definition of a simple criterion for the onset of flow separation impossible. In general, convex bank flow separation is promoted by rapid changes in curvature, wider rivers and higher Froude numbers or momentum-flux ratios.
The reported data are appropriate benchmarks for the validation of numerical models. The data can be obtained from the author.
Acknowledgements
The author thanks B. Rhoads for constructive comments and input. The reported research was funded by the Swiss National Science Foundation under grants SNF 20020-103932 and SNF 200020-119835/1. The author was partially supported by the Chinese Academy of Sciences Visiting Professorship for Senior International Scientists, grant no. 2011T2Z24, and by the Sino-Swiss Science and Technology Cooperation for the Institutional Partnership Project, grant no. IP13_092911.


