


1. INTRODUCTION
Since the earliest times, sailing has been an activity of permanent insecurity. The history of navigation shows that the need for safety has been a matter of concern and, as a result, prevention rules, strict legislation and administrative penalties have been established to reduce the risk at sea. Technical advances introduced in the shipping industry by the industrial revolution brought more efficiency to sea transport but they also gave rise to an increasing number of accidents. During the 20th century, especially after the International Maritime Organization (IMO) was set up, continuous attempts to achieve more safety in the world fleet were made. Since the 1970s, the IMO has displayed a prolific activity creating safety technical standards. During the same period, development of navigational aids, computer technologies and automatisms aboard ships have produced substantial improvements in safetyReference Philippe1.
Despite these evident advances, shipping accidents have been a recurrent problem, a paradoxical fact that some theorists associate with the increasing complexity of the maritime industryReference Charles2. Information obtained from the marine insurance field seems to reflect that the safer the ships are, the more risk they assume. Thus, the marine insurance market was surprised by an unexpected series of shipping casualties in 1998, in spite of the fact that this year, assumed by the experts as a probable one-off and described as an annus horribilis, was just the beginning of a string of casualties and total losses which lasted for the next five years. Hull and machinery insurers initiated substantial premium increases to cover the series of large claims which followed the casualties that were continuously happening 3.
When discussing statistics, we may find figures which are likely to surprise us. If we observe in Figure 1 the evolution of the incidents which the world fleet has suffered, we notice that the number of serious incidents and total losses has had an upward trend since the end of the 1990s4. Surprisingly, it is since this decade that the IMO and ILO have achieved an unprecedented level of effectiveness in the generation of technical safety standards. For the last 20 years numerous conventions, codes and compulsory resolutions have come into force and have been applied to the cargo carrying fleet. In spite of the continuous application of rules designed to prevent accidents at sea and the technological and educational advances, the frequency of casualties does not show a downward trend, as expected.

Figure 1. Serious casualties and total losses 1994–2008 (vessels >500 GT).
In 1982 the first regional Memorandum on Port State Control was signed in Paris and, since then, more memoranda have appeared all over the world with the target of eliminating the operation of substandard ships. It is believed that the more substandard a ship is, the more prone she is to an accident. This observation seems to be contradicted by facts, since losses of ships also happen to respectable owners and operators; that is why important executives from the marine insurance industry say there is no relationship between shipping casualties and the standard of the vessels involved5.
The above mentioned facts make it difficult to understand why the visible progress in the safety of navigation, accident prevention rules and prohibitive laws enforced by regional port state controls have no influence on the rate of marine incidents. These controversial observations may be explained by the theory that considers that those engaged in the operation of a cargo carrying vessel, when facing uncertainty, accept a certain level of subjectively estimated risk in exchange for the benefits they expect to obtain from the transportation.
The risk homeostasis theory 6, applied to maritime transportation, maintains that, in the managing of a particular cargo-carrying vessel, the human conduct of those engaged in the activity will consist of continuously checking the amount of risk they consider the operation of the vessel is exposed toReference Trimpop and Bernhard7. They compare this to the amount of risk they are prepared to tolerate and then try to reduce the difference between the perceived and the accepted risk to zero. If the perceived risk is lower than the tolerated one, those in the activity tend to engage in riskier actions but, if the perceived risk is higher than acceptable, they engage in more cautious alternatives.
Successful results of these daily activities decrease the level of the perceived risk and, during the next cycle, the subsequent adjustment to minimize the difference with the tolerated risk will engage the operation in an even riskier action. On the contrary, unprofitable results increase the amount of subjectively experienced risk and the adjustment with the accepted risk will lead to a cautious activity next timeReference Wilde and Gerald8.
Nowadays, nearly fifty thousand cargo-carrying vessels are moving goods or passengers from one port to another and each particular adjusting action has a probability of risk of incident. Thus, the sum of all the daily operations of the world fleet in a long period of time will determine the rate of maritime accidents. This rate and the particular experiences of those engaged in the ship operations modify the amount of risk they associate to maritime transportation. The actions taken to adapt the perceived to the accepted risk will produce the subsequent rate of incidents for the next period of time.
2. SHIPPING MARKET AND RISK ACCEPTANCE
Pleasure, fighting boredom, adventure or curiosity are not the reasons why the cargo-carrying ships move from one port to another. Only economic interests lead ship operators to carry goods or passengers over the sea. It is a way of making money and obtaining profit and so, the more mobility the ship has in a period of time, the more profit the operator can get. Thus, sailing fast, reducing the time in port or shortening programmed maintenance periods become the usual objective for those engaged in the operation of a cargo carrying ship. The maritime economic theory considers that cargo vessels are operated today in a global sea transport system carrying different commodities and working basically in two segments, liner and tramp shippingReference Starkey, David and Gelina9.
In liner services ships provide a fixed service for small quantities of cargo at regular intervals between named ports with prices determined by competition; liner companies charge prices that cover their cost. When there is less cargo than shipping space, liner companies compete for the available cargo by undercutting one another and whenever one of them cannot operate properly, it ceases to operate.
Tramp shipping operates in the freight market for large quantities, ship-owners negotiate to establish a freight rate which will be low if there are a lot of ships and will be high if there are few ships. When the freight rate falls below the level at which one particular ship can operate, the ship-owner puts her into lay-up, into dry dock or fixes a storage contract. If the freight rate rises reaching such a level that it equals the marginal cost, the ship-owner puts the ship in operation at the lowest speed; when the freight rate is higher, ship operators increase the speed of the ship. The lay-up point depends on the operating costs of the ship. Thus, more specialized, newer or bigger ships have lower operating costs per ton of cargo than the others and, as a result, they have a lower lay-up pointReference Stopford10.
According to the economic theory, the degree of activity of the world cargo carrying fleet is regulated by the shipping market which provides different levels of activity for different types of vessels and, consequently, different levels of profit for ship-owners. As a result of the interest of the individual ship operators in moving their vessels among the competitors, some cargo carrying vessels are involved in accidents in some parts of the oceans every day. Damage to machinery, hull or cargo, collisions, contacts, groundings, etc. are recurring incidents which prove that maritime transportation is a risky activity. A common feature of these mishaps is that they do not usually take place during lay-ups or dry docking periods, but as a consequence of the motion of ships. As we can observe in Figure 2, statistics repeatedly reflect that shipping incidents are associated to the movement of vessels.
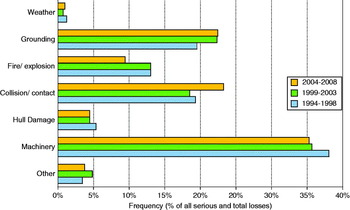
Figure 2. Serious and total losses 1994–2008 by cause (all vessel type >500 GT).
Risk seems to be the result of human decisions and facts show that every cargo-carrying ship in activity may have an accident, either due to the behaviour of those engaged in her operation, or to the behaviour of othersReference Ulrich11. Because of economic reasons, risky actions may be sometimes deliberately pursued, but most of the time passive acceptance of risk is a typical conduct in the ship operation. Ship mobility is a synonym of risk, but also of profit. Thus, the more risk there is, the more benefits the ship-owners could obtain. Therefore, zero risk alternatives do not appear to be a plausible policy in the shipping businessReference Maynard and Alan12.
Choosing safer routes due to bad weather or other perils, keeping dangerous speeds to maintain schedules, sailing with defective equipment or machinery to avoid delays, postponing routine maintenance, etc., are multiple alternatives in shipping operation and a particular amount of risk is associated to each of them. Basically, economic factors determine the amount of risk that those engaged in the operation of a cargo carrying vessel are willing to accept during a given transportation time. High benefits and low costs linked to a particular risky behaviour will lead operators to higher risk acceptanceReference Trimpop and Bernhard13. According to the risk homeostasis theory, the higher the expected advantages of risky behaviour alternatives are, the stronger the desire for risk is. Nevertheless, this desire will be weaker as the expected benefits of safe behaviour alternatives and the costs of risky behaviour alternatives rise. For every particular action, maximization of the difference between benefits and costs becomes the natural goal in the routine cargo carrying vessel operation.
In this commercial scenery where risk and benefit are part of the shipping business, international organizations, such as IMO and ILO, and maritime administrations have been introducing safety and pollution prevention rules in order to reduce the occurrence of maritime accidents. Depending on the needs of the shipping market, many vessels have been sent to scrap and have been replaced by new ones with improved safety standards; the natural consequence of this process is that new ships are safer than old ones. Economic theorists accept that during the last century the development of the economic efficiency of the world cargo carrying fleet has been spectacular; this implies that new ships are also much more efficient than old ones14. Both facts suggest that the drafts on safety and pollution regulations prepared by international organizations only get an acceptable consensus when the effect of the rules does not reduce the economic efficiency of the ships. Since this efficiency is proportional to the amount of risk assumed in transportation, safety standards are not directed to alter excessively the riskiness of the way maritime transport users behave in their hunt for benefits.
Maritime casualties associated to substandard practices which have taken place off the coast of industrialized countries during the last decades have led to the creation of controls in some regions to fight against unsafe practices with more stringent inspections, detentions in port and commercial prohibitions. In the Paris MOU region, for instance, discriminatory surveys against certain flags, recognised organizations and vessels of certain type, size and age are stimulating the operation of newer vessels, classed by high performance societies and registered by white list countries. Since international standards are the relevant instruments used by regional port State controls to improve safety at sea, the beneficial action of this activity has the same limitation as the rules used to get this objective. Consequently, the elimination of the substandard will promote the operation of higher standard ships in a region. This substitution will improve the economic efficiency without altering the rate of marine incidents.
From the point of view of those engaged in the operation of a particular cargo-carrying vessel, the amount of risk they are willing to assume due to the coercive action of port or flag State controls will be reduced to a limited extent where the cost of the reduction does not exceed the benefit that can be obtained from transportation. Benefits and costs of the risky way in which maritime transport actors behave concerning routine ship operations depend mainly on the shipping market and the marine insurance industry policies. Insurers are takers of commercial risk and they provide protection against the costs of the accidents that happen to their customers. Thus, offering protection against the consequences of risky behaviour encourages those engaged in ship management to maintain the riskiness of the operation.
Despite the action of the disciplining force of flag and port State control and the faultlessness of maritime accident prevention rules, it is reasonable to think that shipping operators will try to optimize the level of accepted risk for the purpose of maximizing the economic benefits of transportation. New ships incorporate improved designs, better technology, more accurate machinery and more automatisms than old ones. New ships are safer, but they are also more efficient than older ones and this economic advantage gives ship operators the opportunity of greater productivity, thanks to higher speeds of mobility, fewer lay-up periods and less numerous crews to manage the vessels. The potential safety advantages of new vessels will be consumed as they are used in riskier and more efficient activity.
To assume that high safety standard vessels are operated in a more risky way than low safety standard vessels implies that the occurrence of accidents in both groups during a long period of time should not show evidence of appreciable differences. To verify this assumption is the target of this research.
3. ANALYSIS OF THE RELATIONSHIP BETWEEN THE LEVEL OF THE SAFETY STANDARDS OF CARGO-CARRYING VESSELS AND THEIR PROPENSITY TO HAVE AN ACCIDENT
For the purpose of investigating the association between the occurrence of marine incidents in the ships of the cargo carrying fleet and their safety standard level, we have examined all maritime incidents reported by the Lloyd's Marine Intelligence Unit which have happened to ships of 100 gt or above in the world cargo-carrying fleet during the years 2005 and 2006. The number of incidents recorded is 2,584 and the types of vessels used in the present work are only those defined as cargo-carrying vessels in the Lloyd's Register-Fairplay publication World Fleet Statistics. Therefore, accidents of other type of ships such as fishing vessels, tugs, supplies, dredgers, etc. have not been included. All types of incidents have been recorded, from less serious maritime incidents such as engine failures, minor contacts or damages, etc. to serious and very serious casualties including the total loss of the ship.
The criteria used by the Paris MOU to identify the substandard shipping have been used in this analysis to show the level of safety standard of the vessels involved in the incidents. Since its creation in 1982, this Memorandum has identified the degree of compliance of the ships with the international safety and pollution prevention standards using the results of thousands of inspections carried out on ships visiting the ports of the region. The large number of ships inspected15, and the fact that most of them are engaged in worldwide trade, let us extrapolate regional observations to incidents which have occurred all over the world. Annually, the Paris MOU Secretariat updates the details of the generic factor which can be used to identify the level of safety standard taking into consideration the flag, the classification society, the age, the size and the type of the vessels. These variables have been obtained for every ship involved in an incident during the years 2005 and 2006 and have been used in the present work to investigate with statistical methods if a relationship can be established between the mentioned level of safety standard and the occurrence of accidents to the ships of the world cargo carrying fleet16.
The period of observation of the maritime incidents covered two years and the number of ships in the market continuously changed due to losses, demolitions and new builds. To obtain ratios or percentages in the present work, the number of cargo-carrying ships registered at the middle of the period (31st December 2005) has been taken.
4. THE FLAG OF THE SHIPS AND THE OCCURRENCE OF MARINE INCIDENTS
Taking into account the percentages of ships detained in the ports of the region by each country of registration, the Paris MOU Secretariat publishes three lists in which it classifies the flag States: white, grey and black. Ships registered in the black list countries are assumed to have the lowest safety standard level and those registered in the white list countries to have the highest safety standard level.
For the present analysis, twelve countries have been selected from the black, grey and white lists during 2005 and 2006. Taking the number of cargo carrying ships registered in each country on December 31st 2005 and the number of vessels that suffered an incident during the two years period, we obtain a ratio shown in Table 1. If a perceptible association between the standard of the ships and their proneness to suffer an accident is assumed, it should also be expected to find significant differences in ratios between the three groups of countries. The average ratio (expressed as a percentage) for each group of countries is shown in Figure 3. The rate of incidents in the group of ships registered in countries of the black list of the Paris MOU is lower than those in the other two groups.

Figure 3. Average percentage of maritime incidents per flag group (2005–2006).
Table 1. Cargo carrying fleet of 100 gt or above registered in each country on 31st December 2005 and the ratio of maritime incidents during 2005–006.

The results differ widely from what we had expected; nevertheless, if we want to know whether the differences in the mean ratios of incidents observed are statistically significant, we will have to use techniques of one-way analysis of variance to compare the mean levels in the three groups of flags. We are interested in the effect that the three different types of countries of registration have on the proneness of their ships to have an accident. Table 2 displays descriptive statistics for each combination of factors in the model obtained with the aid of the computer. There does not seem to be a list effect. The N column in the table shows that there are equal cell sizes. Although the standard deviations appear to be relatively homogenous, we check Levene's test to be sure. In Table 3 we test the null hypothesis that the error variance term is constant across the cells defined by the combination of factor levels. Since the significance value of the test, 0·400, is greater than 0·10, there is no reason to believe that the equal variance assumption is violated. Thus, the small differences in the group standard deviations observed in the descriptive statistics table are the consequence of random variation.
Table 2. One-way ANOVA descriptive statistics.

Table 3. Levene's test of equality of error variances.

In Table 4, the tests of between-subjects effects, which help us to determine the significance of a factor, are obtained. We observe that the p-value for F=1·496 is 0·239. Therefore, it is not statistically significant and the hypothesis that the ratios are equal for all groups of countries of registration must be accepted. One-way ANOVA is, to some extent, robust to small and moderate violations of the assumptions of the model, such us homogeneity of variance and normality of distribution. To avoid any risk of error in the conclusions, we use the Kruskal-Wallis test, which is a nonparametric alternative to one-way ANOVA. In this test, the scores are ranked regardless of their group membership. The results of this test are shown in Table 5. N identifies the distribution of cases across groups and mean rank lists the average rank for each group. If the groups do not differ from one another, the mean ranks will be similar. The p-value associated with a chi-square value of 3·215 is greater than 0·1. The test is not significant at a 10% level, which means that the Kruskal Wallis test coincides with the parametric test which shows that the countries of the three lists of flags have the same ratio of accidents. The rate of accidents in the group of ships of lower safety standard is the same as in those of higher standard.
Table 4. Tests of Between-Subjects Effects.

* R Squared=0·083 [Adjusted R Squared=0·028].
Table 5. Kruskal-Wallis Test [grouping variable: Flag code].

5. THE CLASSIFICATION SOCIETY OF THE SHIPS AND THEIR PRONENESS TO SUFFER ACCIDENTS
Since its creation in the 19th century, the role of classification societies has been associated to the maritime insurers, who guarantee the safety and suitability of the ships for the transport of goods or passengers. Traditional societies have great experience in the survey and certification of ships, they have inspectors and branch offices that provide a worldwide service. For this reason, nowadays class societies certify the compliance of ships with the international safety and pollution prevention standards on behalf of many administrations.
A close relationship between the level of performance of the duties of the class societies and the level of compliance with international safety standards of the ships classed is expected. That is why the Paris MOU takes this parameter into consideration to identify substandard shipping. According to the annual reports of this Memorandum, year after year the traditional classification societies get a higher level of performance than the others, and we should expect the occurrence of incidents in ships classed by those societies to be lower than that in ships classed by other recognized organizations.
In the sample of the cargo-carrying vessels which had an accident in 2005 and 2006, the class they belonged to at the time of the event has been recorded17. The result is shown in Figure 4. As can be seen, most of the incidents happened to vessels classed in traditional societies. This fact makes us think that there is some kind of relationship between the level of implantation of each classification society in the maritime industry and the number of accidents that occurred to ships classed in that society.

Figure 4. Number of incidents occurred during 2005–2006 to cargo carrying ships by Class.
In Table 6 each class has been ordered considering the percentage of world cargo-carrying fleet (number of ships of 100 gt or above) classed on December 31st 2005 and the number of accidents that occurred during the period 2005–2006 has also been reflected. Small societies have been ordered in groups of two. Since the variables are quantitative, the Pearson correlation can be used as a suitable method to measure the association between both data. We obtain the correlation table of Table 7, which displays the Pearson correlation coefficient [correlation is significant at the 0·01 level (2-tailed)], significance value, and the number of cases with non-missing values.
Table 6. Number of incidents during 2005–2006 and percentage (by number of ships classed) of world cargo-carrying fleet per class at 31.12.2005.

Table 7. Correlation table displaying the Pearson correlation coefficient, the sig (2-tailed) and the number of cases with non-missing values.

The correlation coefficient obtained between the number of incidents and the percentage of world fleet classed is 0·864. This value indicates that both variables are positively correlated. The significance of the correlation coefficient is also displayed in the correlation table. This significance level (or p-value) is the probability of obtaining results as extreme as the one observed. In this case the two-tailed p-value is very small (less than 0·01) then the correlation is significant and the two variables are linearly related.
To confirm the result, we obtain other measures of agreement between both variables, considering them expressed as ordinal data. For this purpose, the non-parametric correlations Spearman's rank and the Kendall's tau-b- coefficients [in both cases, correlation coefficient is significant at the 0·01 level (2-tailed)], the significance values and the number of cases with non-missing values are displayed in Table 8. In this non-parametric correlation table, information of Kendall's tau-b and Spearman's rho can be seen. Both coefficients use the ranks of the data to calculate the level of association. Spearman's rho is a rank-order correlation coefficient which measures the association at ordinal level. These are non-parametric versions of the Pearson correlation based on the ranks of the data rather than on the actual values.
Table 8. Non parametric correlations, the significance values and the number of cases with non-missing values.
Since the Spearman's correlation coefficient is 0·943 and the Kendall's tau-b is 0·845 a strong relationship between the variables must be assumed. The significance of each correlation coefficient (or p-value) is also displayed in the correlation table. In both cases the significance level is smaller than 0·01 then the correlation is significant and the two variables are linearly related. This confirms the result obtained before with the Pearson coefficient.
The significant value of the correlation coefficients observed indicates that the more ships a society has classed, the higher number of accidents it will have to account for. Such association leads us to reject any kind of relationship between the levels of performance of the class societies, measured by the Paris MOU, and the occurrence of marine incidents.
6. THE AGE OF SHIPS AND THE OCCURRENCE OF MARITIME INCIDENTS
The association between the age of the vessels and their proneness to have an accident is an old topic in the maritime industry. The Paris MOU influenced by European regulations, has considered the age of the vessels an important variable to spot the substandard ships. The directive 2001/106/EC of the European Parliament and of the Council of December 19th 2001 clearly accepts the potential risk of old ships by expressing that most deficiencies leading to detention involve ships above 15 years18. If the correlation between the age of the ships and the occurrence of maritime accidents is accepted, old ships should be expected to have more incidents than new ones. To investigate this matter we will make inferences about the mean of the age of the world cargo carrying fleet with the sample of ships that suffered an incident during the years 2005 and 2006.
According to the world fleet statistics published by Lloyd's Register-Fairplay, the average age of the world cargo carrying fleet during 2005 and 2006 was 20 years. Since we know the mean of the population, the objective is to find out if the sample of ships which suffered an incident in that period is obtained randomly from this population.
The histogram of the data is shown in Figure 5. The mean of the age obtained from the sample is 19·55, which is very close to the mean of the age of the world cargo carrying fleet. It can be seen that the distribution of the data values differs from normal; nevertheless, this drawback can be avoided if we consider the size of the sample (2,584 vessels). It can be accepted that the distribution of the sample mean is normal as a consequence of the Central Limit Theorem. For this reason, the parametric one-sample T procedure can be used to know if the mean of the age of the cargo carrying ships that were involved in an incident during 2005 and 2006 differs from the mean of the age of the world cargo carrying fleet.

Figure 5. Histogram of the age of the ships involved in incidents during 2005 and 2006.
In Table 9, the observed t value is so small that the significance level is more than 0·05. Considering this observation we can conclude that there is no significant difference between the test value (20 years) and the observed mean of the age of the ships which suffered any kind of incident during 2005 and 2006. It can also be deduced from the previous output that the 95% confidence interval for the mean difference contains zero. This fact indicates that the difference between the test value and the observed mean is not significant. The result of the previous one-sample T-test leads us to accept the idea that the incidents in the ships of the world cargo carrying fleet happen at random.
Table 9. The parametric one-sample T procedure.

To confirm this conclusion, we use the alternative non parametric runs test, a statistic procedure that examines consecutive occurrences of a variable, in the present case, the age of the ships engaged in an accident during 2005 and 2006. The runs test classifies the values of the age of the ships depending on whether they are above or below a test value. In this case, as can be seen in Table 10, the median (20 years) is selected. The test employs the total number of runs in the transformed data. The large significance value (p=0·726) obtained suggests that the order of the new and the old ships on the roster does not deviate significantly from randomness.
Table 10. The runs test.

The conclusion of this analysis is that there is no evidence which proves that old ships are involved in more accidents than new ones. This corresponds to the marine insurance industry information that considers that old ships are not more prone to structural failure than new ones19.
7. THE SIZE OF SHIPS AND THE OCCURRENCE OF MARITIME ACCIDENTS
The bigger the ship, the more economic values there are in motion; therefore, safety rules for bigger vessels have been traditionally more stringent than for smaller ones and, as a result, bigger ships are safer and they should be expected to have fewer incidents. If we take the tonnage gt, an indicator of the size, of the 2,584 ships that had an incident during the period 2005 and 2006, the average tonnage obtained is 16,310·57 gt. The frequency distribution can be observed in Figure 6. The histogram with the normal curve superimposed indicates that the distribution of the data differs significantly from a normal distribution. The same conclusion is obtained if we analyze the QQ plot in Figure 7, where the normal QQ plot reflects that there are big differences between the observed values of the tonnage of the ships involved in an incident and the expected normal value represented by the line.

Figure 6. Histogram showing the frequency distribution between of the size of the ships involved in an incident during 2005–2006.

Figure 7. The QQ plot shows the differences between the observed values of tonnage of the ships involved in an incident and the expected normal value.
To investigate the relationship between the size of the ships and their proneness to suffer an accident, we will make inferences about the mean of the tonnage of the world cargo-carrying fleet on December 31st 2005, which was 13,267 gt as shown in Table 11. We suppose that this mean is the average tonnage of the world fleet in activity during 2005–2006. We try to discover whether the mean of the tonnage of the ships involved in an accident in that period differs significantly from the mean of the world fleet.
Table 11. World cargo carrying fleet on 31st December 2005. Source: Lloyd's Register-Fairplay.

Deviations from normality observed in Figures 6 and 7 indicate that parametric tests are not recommended. A bootstrap confidence interval for the mean can be used as an alternative to the classic methods. For this purpose, we obtain a random sample of 100 ships from the 2,584 incidents occurred during the period, to be used in the re-sampling bootstrap method. Bootstrap-t and bias-corrected and accelerated bootstrap (BCa) methods are used to generate bootstrap confidence intervals of the mean. The results are shown in Table 12.
Table 12. Confidence intervals for the mean of the tonnage of the world cargo carrying fleet with a sample of 100 ships which had an incident during 2005 and 2006.

As can be seen, the actual average tonnage of the world fleet is within all the intervals obtained. This means that accidents happen randomly to the cargo carrying ships despite their size. This result seems to correspond to the analysis of the maritime insurance industry which indicates that most of the major claims involved ships between 10,000 and 30,000 gt20.
8. THE TYPE OF SHIP AND THE OCCURRENCE OF MARITIME ACCIDENTS
According to the Paris MOU annual reports, the type of ship is a significant variable associated to a determined level of safety standard. As is shown in Figure 8, general cargo, refrigerated cargo and other cargo ships register a higher average detention percentage every year than any other type of cargo carrying ships (twice as high as tankers, passenger ships, containers, etc.).

Figure 8. Detention percentages per ship type and average detention in the Paris MoU region during 2004, 2005 and 2006.
The repeated evidence of the differences in safety standards depending on the types of ship leads us to analyze whether the low safety standard types of the world cargo-carrying fleet (general cargo, refrigerated cargo and other cargo ships) suffer more incidents than other types of ships of higher safety standard.
In Table 13 we have the number of ships of the world cargo-carrying fleet of 100 gt or more at the end of 2005 according to type and divided into two groups following the Paris MOU information. Thus, during 2005 and 2006 a low safety standard fleet of 18,677 ships was operating in the world, as opposed to 29,765 ships belonging to the high safety standard types. The number of reported incidents occurred to both groups are included in the table.
Table 13. World cargo carrying fleet by type of ships on 31st December 2005 and number of incidents during 2005–2006. Source: Lloyd's Register-Fairplay and LMIU.

If we consider that, despite their level of safety, the marine incidents occur to the ships of the world cargo carrying fleet randomly then, the ratios for both groups of ship types should be similar; this seems to be true taking the results into account. To analyze if the differences in the ratios obtained are statistically significant, we take them as percentages. 5·14% would be the percentage for general, refrigerated cargo ships, etc. and 5·45% for the rest (tankers, container ships, bulk carriers, passengers, etc.). Is this difference so small that we can confirm that both percentages are equal? To know this, we try to contrast the hypothesis H 0:p 1=p 2 where p 1 is the percentage of incidents occurred to the type of ships with low safety standard performance and p 2 to the group of type of ships with high performance. We use the statistic z to compare the differences in the proportions and we calculate z with the following formula:

Taking into account that the absolute value obtained of |z|=1·46518 less than 1·96, we can accept the null hypothesis that confirms that the differences in percentages of incidents between the two groups of ships are not statistically significant, so we can conclude that, despite the type of ship, maritime accidents happen to the vessels of the cargo-carrying fleet randomly.
9. CONCLUSIONS
The efforts of the maritime community to make accident prevention rules and the actions of port and flag State control to eliminate substandard shipping have helped to improve the safety level of the cargo carrying vessels and their economic efficiency; nevertheless, these activities are hardly ever directed to alter the level of risk that the ship operators are willing to incur.
The Risk homeostasis theory presumes that, under the conditions of the shipping market, those engaged in the operation of a particular ship will behave in such a way as to optimize the difference between the benefits and the costs of their risky alternatives. Safer ships are more efficient in dangerous situations, which allows their operators to maximize the benefits of their risky behaviour more effectively than those managing vessels of lower safety standard. From an economic point of view, the impulse to operate high safety standard ships recklessly and low standard ones carefully appears to be a reasonable behaviour; this conduct reduces the potential benefits of safety improvements equalizing the probability of suffering an incident for both types of ships; therefore, maritime accidents, observed over a long period of time, will happen to the vessels of the cargo carrying fleet randomly, regardless of their level of safety standard. This theoretical presumption has been empirically confirmed in the present work.
It is a known fact that the demand of sea transport depends on the international economic circumstances, so the number of ships and the level of activity of the world cargo carrying fleet will fluctuate according to these circumstances. In this context, to accept that marine accidents happen by chance implies, on the one hand, that the higher the maritime commercial activity in a region is, the higher the occurrence of maritime accidents will be and, on the other hand, that a direct correlation between the freight rates and the frequency of marine mishaps will be expected. Both assumptions appear to be happening nowadays.
It is clear from this work that the occurrence of maritime accidents does not only depend on the suitability of the safety standards, but also on the desire of those engaged in the operation of the vessels to be safe. This does not mean that the efforts made by the industry and Institutions to prevent accidents at sea are failing, but that such efforts are intentionally limited due to economic reasons and directed, not to reduce the frequency of incidents, but their seriousness. This aspect has not been dealt with in the present work and it could be the subject of another paper.


