Introduction
Soybean (Glycine max) is widely cultivated and consumed in Indonesia, even though it is not a native plant of this country. The earliest written record mentioning soybean cultivation in Indonesia is dated around the 13th century (Shurtleff and Aoyagi, Reference Shurtleff and Aoyagi2010). Another manuscript has indicated that tempeh made from soybean had been consumed in the early 17th century (Santoso and Pringgoharjono, Reference Santoso and Pringgoharjono2013). Soybean-derived food products remain popular to this day, and the current domestic demand for soybean consistently exceeds the quantity that can be produced locally, partly because the average yield of Indonesian soybean farms is relatively low, ranking 66th worldwide in 2011 (FAOSTAT, 2011). It seems that centuries of domestication have not produced outstanding cultivars and improvements via breeding programmes are needed to produce varieties that perform well in the Indonesian climate.
Newer techniques that utilize DNA-based tools such as marker-assisted selection and genomic selection should be explored to improve the speed and efficiency of local breeding programmes. The use of next-generation sequencing can assist in designing a large number of DNA markers, which would be useful for fine-mapping, genome-wide association studies and genomic selection (Chagne et al., Reference Chagne, Crowhurst, Troggio, Davey, Gilmore, Lawley, Vanderzande, Hellens, Kumar, Cestaro, Velasco, Main, Rees, Iezzoni, Mockler, Wilhelm, Van de Weg, Gardiner, Bassil and Peace2012). This study was carried out with the intention to assist future soybean breeding programmes in Indonesia by characterizing the genome of local soybean cultivars. Whole-genome sequencing was performed for five selected local cultivars to (1) assess their genetic diversity and relationship with Chinese cultivars, (2) identify genetic mutations that underlie phenotypic variations, (3) identify allelic variation for the development of DNA markers for future soybean breeding activities in Indonesia.
Materials and methods
Plant materials consisted of five soybean cultivars from Indonesia, namely B3292, Davros, Grobogan, Malabar and Tambora. The five varieties were selected based on several criteria, such as the presence of useful traits, their utilization in breeding programmes, and genetic diversity according to a previous phylogenetic study using simple sequence repeat markers (Santoso et al., Reference Santoso, Utami and Septiningsih2006). Sequencing was performed using an Illumina Hiseq 2000 sequencing system, according to the manufacturer's instructions. Sequence data were aligned to the Williams 82 reference sequence (Schmutz et al., Reference Schmutz, Cannon, Schlueter, Ma, Mitros, Nelson, Hyten, Song, Thelen, Cheng, Xu, Hellsten, May, Yu, Sakurai, Umezawa, Bhattacharyya, Sandhu, Valliyodan, Lindquist, Peto, Grant, Shu, Goodstein, Barry, Futrell-Griggs, Abernathy, Du, Tian, Zhu, Gill, Joshi, Libault, Sethuraman, Zhang, Shinozaki, Nguyen, Wing, Cregan, Specht, Grimwood, Rokhsar, Stacey, Shoemaker and Jackson2010), which was downloaded from Phytozome (www.phytozome.net), using Bowtie2 (Langmead and Salzberg, Reference Langmead and Salzberg2012) followed by single-nucleotide polymorphism (SNP) calling using mpileup in SAMtools (Li et al., Reference Li, Handsaker, Wysoker, Fennell, Ruan, Homer, Marth, Abecasis and Durbin2009). Annotation of the locations and predicted effects of the SNPs was performed using SnpEff (Cingolani et al., Reference Cingolani, Platts, Wang le, Coon, Nguyen, Wang, Land, Lu and Ruden2012). The resultant data were compared with sequencing data from 31 Chinese accessions (Lam et al., Reference Lam, Xu, Liu, Chen, Yang, Wong, Li, He, Qin, Wang, Li, Jian, Wang, Shao, Wang, Sun and Zhang2010) downloaded from the SoyKB database (soykb.org). Phylogenetic analysis and tree construction were carried out using DARwin (Perrier and Jacquemoud-Collet, Reference Perrier and Jacquemoud-Collet2006). Tree drawing was generated in Dendroscope (Huson and Scornavacca, Reference Huson and Scornavacca2012).
Results and discussion
The average sequence coverage depth for all the loci was 34 reads, and more than 95% of the genome was sequenced at least ten times. In total, we identified 3,150,869 sequence changes, an average of one sequence change per 308 bases. Among these changes, 2,692,193 were SNPs, 257,625 were insertions, and the remaining 201,051 were deletions.
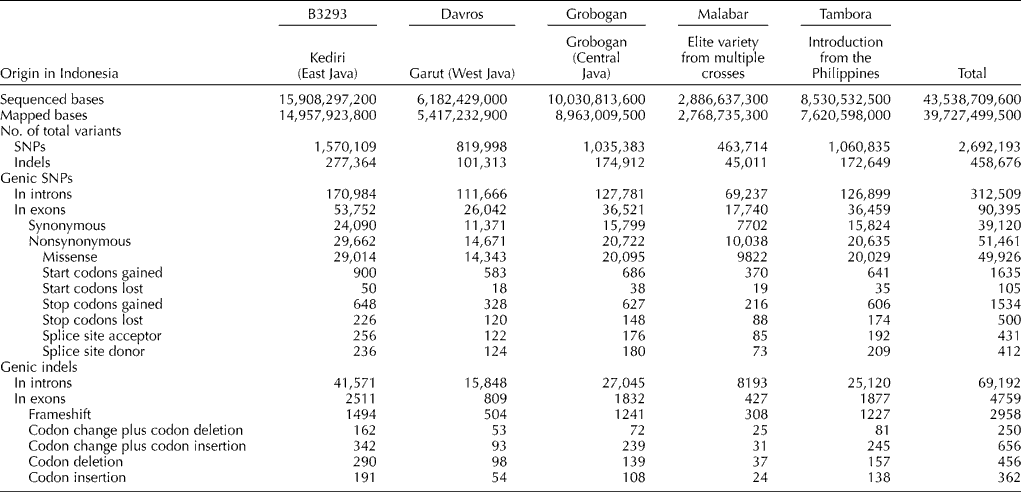
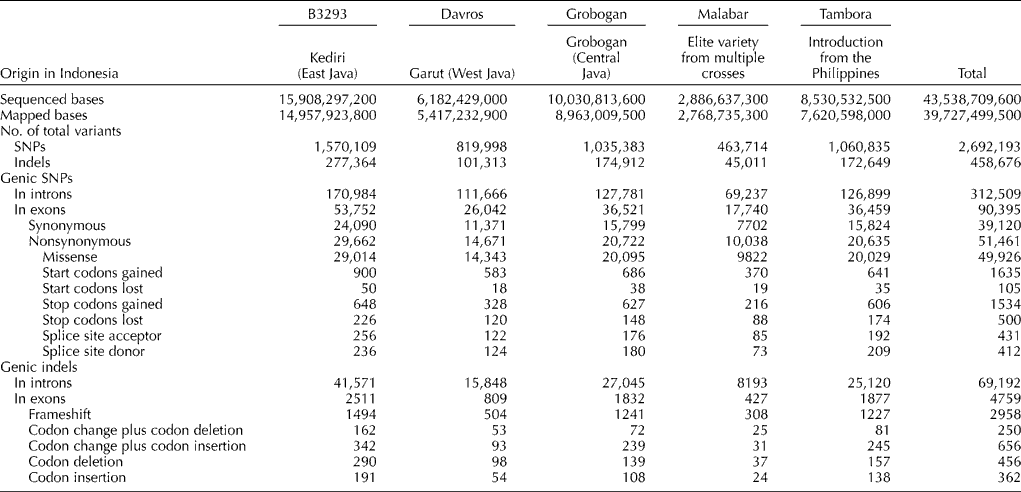
To assist future research in fine-mapping and gene identification using quantitative trait locus mapping and association studies, sequence changes in exon regions were further characterized. A total of 95,154 sequence changes were located in exons. More than half of these changes (49,926 mutations) were missense mutations, while 1535 were nonsense mutations. Table 1 categorizes the non-silent mutations according to their effect on mRNA/protein composition and lists the number of mutations of each type.
Table 1 Number and types of sequence variations detected among the five Indonesian cultivars

SNPs, single-nucleotide polymorphisms.
To investigate whether some of the exon sequence changes are unique to Indonesian accessions, data on 80,630 SNPs that could be mapped to the 20 soybean chromosomes were compared with SNP data obtained from resequencing 31 Chinese accessions (Lam et al., Reference Lam, Xu, Liu, Chen, Yang, Wong, Li, He, Qin, Wang, Li, Jian, Wang, Shao, Wang, Sun and Zhang2010). There were 57,009 SNPs that matched the SNPs from the Chinese accessions, while 23,621 were unique to the five Indonesian cultivars. These mutation data could comprise a valuable resource for dissecting genetic adaptation to the tropical climate of Indonesia.
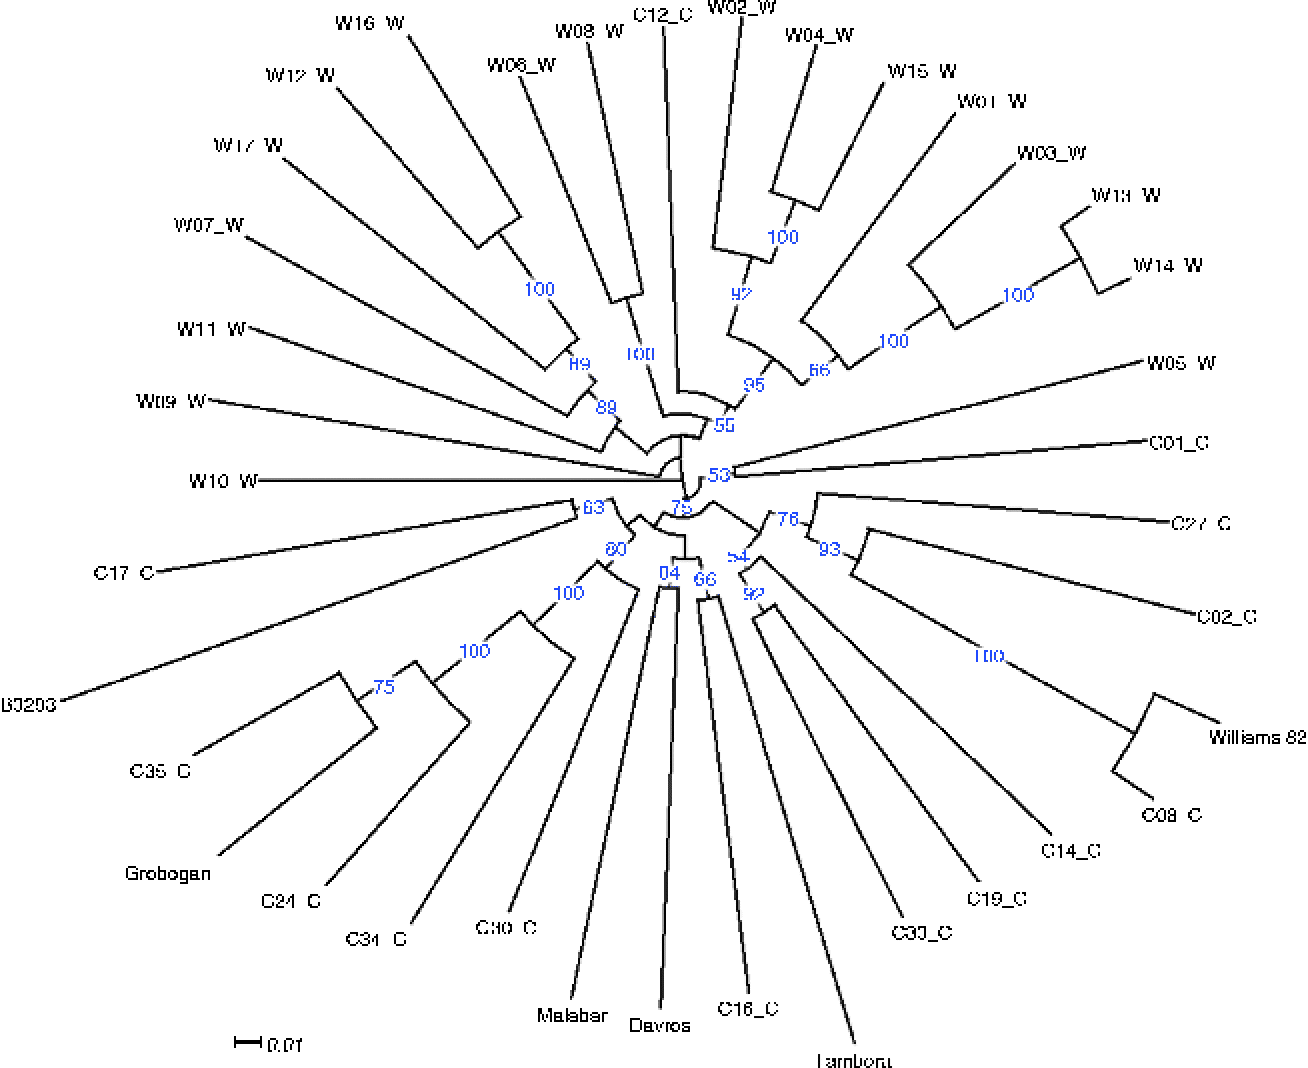
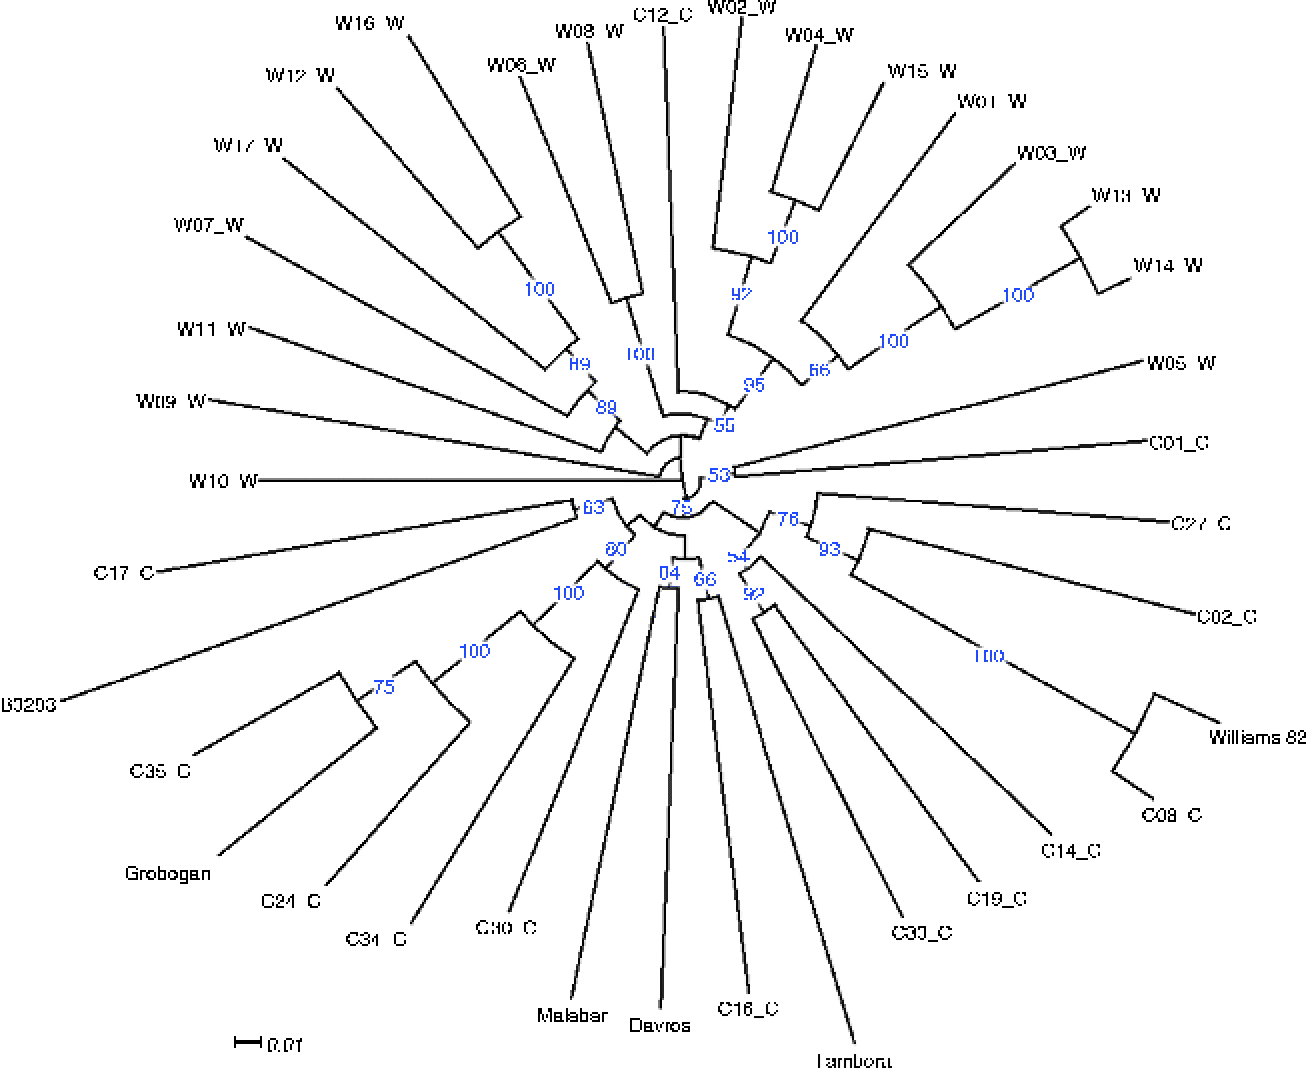
Using these mutation data, we then assessed the genetic diversity of the five cultivars compared with the Chinese accessions, which were expected to have greater diversity as they originated in the area where soybean was initially domesticated and some wild accessions were also present among these 31 accessions. A neighbour-joining tree based on 1000 bootstrap replicates was then constructed from the polymorphism data of 1400 genic SNPs that exhibited polymorphism among the Chinese and Indonesian accessions and had a sequencing depth of at least three reads in all the five Indonesian cultivars (Fig. 1). As expected, the five Indonesian accessions were clustered relatively close to each other within the cluster of cultivated accessions from China, even in the case of the Tambora cultivar, which is a recent introduction from the Philippines. The closest relative to Tambora is C16, a Taiwanese cultivar that originated from a Japanese cultivar and is also the closest relative to two other Indonesian cultivars, Malabar and Davros. Malabar is the result of a recent breeding programme that crossed superior local cultivars, while Davros was purified from landraces commonly planted in Garut District (West Java). B3293, a landrace from Kediri (East Java), belongs to a different group and was shown to be most similar to C17, a landrace from Sichuan, in Southwest China.

Fig. 1 Phylogenetic relationship between the five Indonesian cultivars and 31 wild and cultivated soybean accessions from China. Accessions labelled with C represent cultivated varieties, while those labelled with W represent wild varieties. Full description of the accessions can be found in the supplementary material section of Lam et al. (Reference Lam, Xu, Liu, Chen, Yang, Wong, Li, He, Qin, Wang, Li, Jian, Wang, Shao, Wang, Sun and Zhang2010). Blue numbers at the nodes represent the percentage of bootstrap values for 1000 replications and values less than 50 are not displayed in the tree. Scale indicates substitutions per site.
An unexpected grouping can be observed in the case of Grobogan. Similar to Davros, Grobogan was purified from landraces that are popular in the District of Grobogan, Central Java. It was originally thought to be a variant of Malabar, due to their similar flowering time. Nevertheless, Grobogan is most genetically similar to a landrace from Guangdong (C35), a coastal region located in Southeast China. Grobogan is clearly genetically distinct from Malabar, and its origin might be closer to the original soybean that was introduced from China to Indonesia.
It is unlikely that Indonesian soybeans are derived from a single introduction event that later spread throughout the country, as even accessions derived from traditional landraces exhibit similarities to cultivars that originated from different regions in China and Japan. Contact between the two countries had been recorded since the 7th century (Müller and Takakusu, Reference Müller and Takakusu1896), and Khubilai Khan even sent an expedition to invade Java in the 13th century (Marshall, Reference Marshall1993). Such a long history of interactions could present many opportunities for different types of soybean to be introduced.
Nevertheless, the phylogenetic analysis indicated that the breeding programmes could benefit from more genetic materials. This study identified genetic variations and polymorphisms in local soybean cultivars, which could comprise a useful resource for marker development in breeding programmes for soybean in Indonesia. Nonsynonymous mutations were also catalogued to faciitate their use as potential candidates for fine-mapping of useful traits in local cultivars. These genetic data have also given us a glimpse of the overall picture of Indonesian soybean diversity, as well as serve as a starting point for investigations into the origin of Indonesian cultivars.
Acknowledgements
This study was funded by an Indonesian Government grant from the Indonesian Agency for Agricultural Research and Development – Ministry of Agriculture. The authors thank Dr Joshi Trupti for her assistance in accessing the SNP data in SoyKB.


