


Introduction
Mass-casualty incidents (MCIs) present an imbalance of patient needs and available resources; there are limited first responders, transportation vehicles, and medical equipment to treat an overwhelming number of injured. Triage algorithms work to optimize the allocation of resources and prioritize delivery of care to the patients who would most benefit. An important characteristic of a triage algorithm is consistency of categorizations between users. In short, excellent inter-rater reliability (IRR) should be maintained across a variety of scenarios, including fluctuations in victim number.
In 2008, a Centers for Disease Control and Prevention (CDC; Atlanta, Georgia USA)-sponsored panel proposed a new national standard for mass-casualty triage called Sort-Assess-Life-saving intervention-Treatment/Transport (SALT) triage.Reference Lerner, Schwartz and Coule1 This MCI model fits the Model Uniform Core Criteria.Reference Lerner, Cone and Weinstein2 The first step of SALT triage involves a global assessment of victims using voice commands to determine prioritization of individual assessment. After the order of individual assessment is determined, a basic life-saving intervention such as controlling major hemorrhage, opening the airway, providing a chest decompression, or administering an auto-injector antidote can be performed, if needed. Then, the first responder assesses patients utilizing the series of questions shown in Figure 1 to determine triage categorization. A unique aspect of the model is that there are two subjective questions. The first - “Minor injuries only?”- is used to differentiate a “Minimal” from a “Delayed” categorization; the second question - “Likely to survive given current resources?” is used to differentiate an “Immediate” to “Expectant” categorization. For the purposes of this paper, these categories will be referred to by their colors, with “Minimal” termed “Green,” “Delayed” termed “Yellow,” “Immediate” termed “Red,” and “Expectant” and “Dead” termed “Black” (Figure 1).

Figure 1. SALT Algorithm Flowchart.Reference Lerner, Cone and Weinstein2
Although there have been some accuracy data published on SALT and evaluation of whether paramedics can accurately apply SALT, there have been no published studies focused on the IRR of SALT across scenarios of varying sizes.Reference Heffernan, Lerner and McKee3,Reference Jones, White and Tofil4 In particular, triage of pediatric patients using SALT presents a unique, and insufficiently studied, challenge. The hypothesis of this study was that, because of the subjectivity of the model, the IRR would decrease as the number of victims increased, particularly driven by patients triaged as Minor and Expectant. This study aimed to clarify trends with changing victim number, as well as to determine the IRR of SALT across different victim-number pediatric scenarios.
Methods
This is a prospective application of different triage tools, stratified by different categories of numbers of victims. An exemption of informed consent or full committee review was granted by the US San Diego Institutional Review Board (San Diego, California USA; protocol reference number 170467).
Selection of Patients for Dataset Creation
A previously prepared and de-identified collection of trauma activation patients under 14 years of age transported by ambulance from July 2010 through November 2013 to a single Level 1 pediatric trauma center in Los Angeles (California USA) was used for this study. The dataset as a whole includes prehospital field information, emergency department (ED) data, procedures, diagnoses, and outcomes; however, the raters were blinded to outcomes information. Only the following patient-level information was provided to the raters for the purposes of performing patient triage: gender, age, weight, prehospital exam notes, prehospital treatment notes, ability to walk, level of consciousness, field Glasgow Coma Scale score, pulse quality, field pulse rate, respiratory distress, field respiratory rate, and perfusion quality as defined by capillary refill time or notation of cool, mottled extremities. Trauma severity information including injury mechanism, Injury Severity Score (ISS), length of stay (LOS), procedures, diagnostics, and dispositions were collected but not shared with the study personnel performing triage. The SALT triage criteria were applied to this retrospective data set, using these trauma patients to represent MCI patients. The list of the information available on “patients” which was furnished to the raters is included in Appendix 1 (available online only).
Participants/Study Design and Measurements
Training
Three independent raters were then trained on the SALT algorithm by a pediatric emergency medicine and Emergency Medical Services fellowship-trained attending physician utilizing a one-on-one introduction to the algorithm followed by a question-and-answer session via internet teleconferencing. They were aware that the research centered on the use of different triage algorithms for pediatric MCI patients. Possible categorizations included “Green” for patients needing minimal care, “Yellow” for patients needing delayed care, “Red” for patients needing immediate care, and “Black” for patients deemed dead or expectant. Although SALT labels Expectant categorizations “Gray” and provides a separate categorization for “Dead,” given an anticipated small number of Expectant and Dead categorizations, both of these were combined into a “Black” designation.
Preparation
Each rater was asked to triage the same 25 sample patients from the set of 253 utilizing the SALT algorithm. Upon review of these sample triage categorizations, each independent rater was required to demonstrate a 90% agreement with the attending physician. This took one pass for each rater.
Triage Designation
Each rater was then provided an Excel document (Microsoft Corp.; Redmond, Washington USA) with the information detailed above (Appendix 1; available online only) on the 253 patients and independently triaged each patient chart using SALT in the three scenarios described. They were given the normal resources of an ED receiving patients from an MCI. Initially, they triaged each patient without considering the size of the MCI. The raters were then asked to triage each patient as if that patient had been involved in a 10-victim, 100-victim, and 1,000-victim disaster. No specific scenario was suggested, other than the number of victims. There was no specific time limit for each triage designation and raters had access to the algorithms, as needed. Patients were presented in the same order for each rater and each victim number scenario.
Outcomes
The primary outcome was the IRR for application of the SALT triage algorithm assuming an MCI victim number of 10, 100, or 1,000 patients. The secondary outcome was the change in number of patients placed in each of the triage designation categories as the victim number changed.
Analysis
Descriptive statistics were used to evaluate the change in total categorizations by triage level (Green, Yellow, Red, or Black) across the different victim-number scenarios. Cohen’s kappa was then used to evaluate the IRR between two raters in each victim-number scenario; because three raters were used for this study, a total of three duo-rater comparisons were performed for each victim number scenario. A weighted 95% confidence interval was used to assess the reliability in each of the different victim-number scenarios. The following scale of Cohen’s kappa was used to evaluate the reliability: 0 to 0.20 as “poor;” 0.21-0.40 as “fair;” 0.41-0.60 as “moderate;” 0.61-0.80 as “substantial;” and 0.81-1.00 as “near perfect.”
Results
Characteristics of Study Subjects
The raters were provided 253 patients with four triage scenarios each. Six victims were removed in analysis due to incomplete triage across all scenarios by one or more raters. This led to a total of 988 triage designations. Table 1 provides demographic information of the patients in the retrospective dataset.
Table 1. Demographic Table

Abbreviations: ISS, Injury Severity Score; LOS, length of stay.
a 14 patients did not have ISS documented.
Main Results
Table 2 presents the total categorizations by category for all three raters combined. As victim count increased, so did Green categorizations, from 32.8% in the 10-victim scenario up to 67.6% in the 1,000-victim scenario. Both the Red and Yellow categories decreased as the victim count increased, the Yellow more pronouncedly than the Red. The number of victims categorized Black only saw a very small increase as victims increased, from 3.5% to 4.2%.
Table 2. Total Categorizations of All Raters Across Three Victim-Size Scenarios

Table 3 details the change in triage categories across the various victim scenarios. The largest change in triage was from Yellow to Green as the number of victims in the scenarios increased, with 27.8% increase from 10-to-100 victims and 37.8% increase from 10-to-1,000 victims. No patient initially triaged Green or Black changed categorizations as victim number increased. There was a small change in the patients initially categorized as Red, with some changing to Yellow and a very few changing to Black, as victim number increased.
Table 3. Triage Changes Made

Table 4 presents these categorizations by individual rater. For rater one, there was no difference in Black categorizations across the three scenarios (3.2% of total categorizations in each of the three scenarios), but there was an increase in categorizations of Green patients as victim number increased (21.9% in the 10-victim, 83.8% in the 100-victim, and 87.0% in the 1,000-victim scenario). For rater two, each exponential increase in estimated victim number resulted in one additional Black categorization (3.2% in the 10-victim, 3.6% in the 100-victim, and 4.1% in the 1,000-victim scenario). Rater two also had a trend of increasing Green categorization as victim size increased (26.3% in the 10-victim, 32.8% in the 100-victim, and 41.7% in the 1,000-victim scenario). Rater three had an increase of three Black categorizations from the 10- to 100-victim scenario but no increase from 100- to 1,000-victim scenario (4.1% in the 10-victim, 5.3% in the 100-victim, and 5.3% in the 1,000-victim scenario) and an increased proportion of Green categorizations as the victim size increased (50.2% in the 10-victim, 65.2% in the 100-victim, and 74.1% in the 1,000-victim scenario).
Table 4. Categorizations by Rater Across Three Victim-Size Scenarios

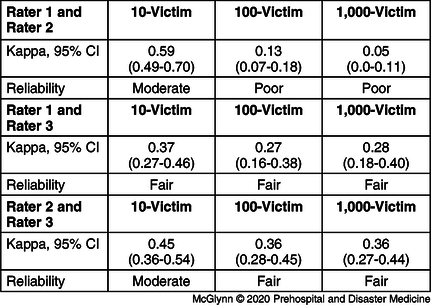
The IRR was consistently poor-to-moderate across the different scenarios, with decreasing agreement as the number of victims increased. In the 10-victim scenario, kappa coefficient ranged from 0.37-0.59. In the 100-victim scenario, kappa coefficient ranged between 0.13 and 0.36. In the 1,000-victim scenario, kappa coefficient ranged from 0.05-0.36. Table 5 provides each of the kappa coefficients between each rater and another as well as 95% confidence intervals for the value.
Table 5. Kappa Coefficient between Raters in Each Scenario
Discussion
Previous simulation studies using adult victims have found SALT favorable or comparable to other modes of triage with regards to accuracy, ease of use, and speed.Reference Lerner, Schwartz, Coule and Pirrallo5,Reference Silvestri, Field and Mangalat6 One study by Jones found similar rates of accuracy, over-triage, and under-triage in a simulated pediatric MCI to JumpSTART (Simple Triage and Rapid Treatment), a pediatric-specific triage algorithm.Reference Jones, White and Tofil4 Another study by Heffernan comparing SALT, JumpSTART, Triage Sieve, and Careflight in pediatric trauma cases at a Level 1 trauma center found SALT to be as accurate as the other three, but also with a substantial rate of under-triage.Reference Heffernan, Lerner and McKee3 These studies only analyze SALT in the context of a single MCI; this paper demonstrates that SALT provides inconsistent results across different victim-number scenarios. Furthermore, there are few published data on the IRR of the algorithm. This study advances the literature by demonstrating that IRR in the application of SALT to a group of pediatric trauma victims is consistently poor-to-moderate and decreases as MCI casualty numbers increase.
The hypothesis of this study, that as victim numbers increased, the IRR would decline and that providers would change their definition of “minor” injuries and “what was likely to survive,” causing an increased number of patients to be considered “minor,” thus offsetting the number of victims being transferred to the hospital, was substantiated. Both the Green and Black categorizations increased, with Green categorizations increased to a much greater extent than Black categorizations. This trend raises the possibility that the question “are injuries minor?” (the branch point between a Green and Yellow categorization) causes more inconsistency in the model than “likely to survive given current resources?” (the branch point between a Black and Red categorization). As would be expected with increasing Green categorizations, there was a trend towards decreasing Yellow categorizations as size increased. Interestingly, however, there was a moderate movement into the Yellow category from Red categorizations, which cannot entirely be explained by these two subjective branch points. Whether these findings would bear out in a true mass-casualty situation is unclear for several reasons. Certainly, perception impairment may occur if a provider’s attention is overloaded with stimuli. This pitfall was not recreated here, as the providers were merely to assume the size of the incident, but still triaged each patient individually.Reference Dubrowski7 Additionally, while the idea of declaring patients Expectant is not clearly studied as a factor in post-MCI provider depression and anxiety,Reference Ke, Chen and Lin8 one might imagine that providers would find the labeling of children as Expectant to be stressful. Previous literature has demonstrated that SALT is prone to affective error and has shown that first responders may upgrade a triage status against protocol because the victim is a child.Reference Jones, White and Tofil4 The degree to which this differs between a tabletop exercise and true MCI is unknown. Certainly, more study is needed to evaluate both the origin of these findings and whether they can be generalized to a true MCI.
Limitations
There are several limitations of this study. First are the limitations of a tabletop exercise in providing psychological fidelity comparable to an actual disaster. Second, the patients involved in this study were not actually involved in an MCI; they were involved in individual traumas- primarily motor vehicle collisions or falls. An MCI with 100 or 1,000 victims is far more likely to involve a natural disaster, chemical or biological warfare, or explosive, limiting the generalizability of this injury mechanism. Because relevant data points for the patients were presented to the raters, any added variability due to accuracy of data acquisition was not accounted for in the results.
Another important limitation is that the raters were not blinded to the hypothesis by nature of the study design. Asking raters to triage the same patient in three victim-number scenarios number would make it challenging to blind them to the hypothesis that categorizations will change based on victim number. Further, each rater was aware of how they categorized the patient in prior triage categorizations; although, they were blinded to the scoring of the other raters. Additionally, the raters in this study were all training as physicians. A replica of this study utilizing raters of various medical fields from emergency medical technicians and paramedics to trauma and emergency medicine physicians should be considered to evaluate if and how performance changes based on education and experience. A trauma surgeon’s interpretation of a “minor” injury or “likely to survive given resources” may be vastly different than a basic emergency medical technician. Given SALT is applicable in the field for first responders and at the time of re-triage at the ED, it is important to know whether and how use of the algorithm changes based on number of victims and who is utilizing the algorithm.
Conclusion
Results show that SALT demonstrated poor-to-moderate IRR in this study of increasing casualty counts while triaging pediatric patients. Increased casualty counts in the scenarios led to a higher proportion of Green, but not Black, categorizations. More studies are needed to evaluate the reliability and consistency of the SALT triage algorithm.
Conflicts of interest
none
Supplementary Material
To view supplementary material for this article, please visit https://doi.org/10.1017/S1049023X20000163


