I. INTRODUCTION
Coal gangue (CG) produced from coal mining and coal processing is one of the largest amounts of industrial solid wastes in China (Liu and Liu, Reference Liu and Liu2010). More than 700 million tons of CG is generated annually in China and its resource utilization attracts many researchers’ attention (Bian et al., Reference Bian, Dong, Lei, Leng, Mu and Wang2009; National Development and Reform Commission, 2014). Currently, CG has been widely used in landfill, paving, power generation, etc. (Querol et al., Reference Querol, Izquierdo, Monfort, Alvarez, Font, Moreno, Alastuey, Zhuang, Lu and Wang2008; Bian et al., Reference Bian, Dong, Lei, Leng, Mu and Wang2009; Liu and Liu, Reference Liu and Liu2010). The utilization efficiency, however, is only about 65% owing to the limited utilization technology (Guo et al., Reference Guo, Yan, Cui, Cheng and Lou2014a, Reference Guo, Zhao, Yan, Cheng and Lou2014b; National Development and Reform Commission, 2014). It is of great importance to develop the new utilization ways to increase the utilization efficiency of CG.
CG is a heterogeneous mixture with various crystalline minerals and organic matter (Vassilev and Vassileva, Reference Vassilev and Vassileva1996; Jabłońska, Reference Jabłońska2012). As one of the main compositions, crystalline minerals in CG can be used to produce high value-added products, such as architectural and chemical materials (Liu and Liu, Reference Liu and Liu2010; Guo et al., Reference Guo, Yan, Cui, Cheng and Lou2014a, Reference Guo, Zhao, Yan, Cheng and Lou2014b; Tian et al., Reference Tian, Zhang, Zhao and Guptab2014). Comprehensive understanding of the crystalline minerals in CG plays an important role in its added-value utilization. Generally, the crystalline minerals in CG mainly include quartz, clay minerals (kaolinite, illite, montmorillonite, chlorite, and feldspar), carbonate (calcite, siderite, and dolomite), etc. (Palmer and Lyons, Reference Palmer and Lyons1996; Vassilev and Tascón, Reference Vassilev and Tascón2003; Chakravarty et al., Reference Chakravarty, Mohanty, Banerjee, Tripathy, Mandal, Basariya and Sharma2015). In addition to the qualitative analysis of the crystalline minerals, the high added-value utilization also depends on the relative contents of each crystalline mineral in CG. Therefore, the quantitative analysis of crystalline minerals in CG is absolutely critical for its high added-value utilization (Ward, Reference Ward2002).
The polycrystalline diffraction full-pattern-fitting method, commonly referred as the Rietveld method, based on X-ray diffraction (XRD) technology can be used to determine the relative contents of each crystalline mineral in mineralogical mixture (Rietveld, Reference Rietveld1967, Reference Rietveld1969). It is a pattern modeling procedure in which the Rietveld parameters causing the variation of diffraction intensity in the XRD pattern are adjusted theoretically, by non-linear least squares, in order to fit a calculated pattern to the corresponding measured pattern. The Rietveld parameters include structural parameters (i.e. space group, atomic positions, site occupancies, and lattice parameters), pattern background function coefficients, profile parameters (peak widths and shape), crystallite size and microstrain, etc. (Izumi and Yong, Reference Izumi and Young1993; Gan et al., Reference Gan, Taylor, Xu, Arie, Robert, Wang and Peter2013). Compared with the other quantitative analysis methods, the Rietveld method has long been established as a definitive method for the quantitative analysis of crystalline minerals in geological materials, especially for those containing significant proportion of clay minerals.
The Rietveld method has been commonly applied for the quantitative analysis of crystalline minerals in organic-rich rocks, such as coal and oil shale. A generalized flow-sheet is shown in Figure 1. During the analysis process, the organic matter is normally removed before the Rietveld quantitative analysis of crystalline minerals, because the organic matter produces a background noise, or named “organic hump” in the XRD pattern (Mandile and Hutton, Reference Mandile and Hutton1995). Many researchers have tried to eliminate or weaken the “organic hump” in the Rietveld quantitative analysis of crystalline minerals in organic-rich rocks (Mandile and Hutton, Reference Mandile and Hutton1995; Ward et al., Reference Ward, Taylor, Matulis and Dale2001; Ruan and Ward, Reference Ruan and Ward2002; Ural, Reference Ural2007). Ward et al. compared the XRD patterns of low-temperature ash (LTA), coal ash prepared at 370 °C, and the raw Argonne Premium coal (North American) using an interactive data processing system (SIROQUANT™) based on the Rietveld method. Although the “organic hump” in the XRD pattern can be eliminated by heating the coal to 370 °C, the effect could also be distinguished, compared with the raw coal or the LTA, through changes in components such as pyrite and clay minerals (Ward et al., Reference Ward, Taylor, Matulis and Dale2001). The low-temperature oxygen-plasma ashing procedure, by contrast, can be regarded as a useful method to isolate crystalline minerals, which are intimately distributed in organic-rich rocks. However, it is a tedious and time-consuming process (Tian et al., Reference Tian, Zhang, Zhao and Guptab2014). The decrease of operation steps and the increase of analysis efficiency are both important for the Rietveld quantitative analysis of crystalline minerals in organic-rich rocks. In another study, Mandile and Hutton introduced a method to directly determine the relative contents of organic matter and each crystalline mineral in Tertiary Duaringa oil shale (Queensland, Australia). The organic matter could be quantified by the different size of “organic hump” area in the XRD patterns and the crystalline minerals could be quantified by the Rietveld method. The influence of organic matter on the Rietveld quantitative result can be partly overcome through an “organic hump” correction coefficient (Mandile and Hutton, Reference Mandile and Hutton1995). However, this method cannot be directly used for the quantitative analysis of crystalline minerals in CG since the size of “organic hump” area is dependent on the type of organic matter. And the type of organic matter in CG is different from that in oil shale (Li and Xu, Reference Li and Xu2008). Hence, it is necessary to investigate the effect of organic matter on the Rietveld quantitative analysis of crystalline minerals in CG.
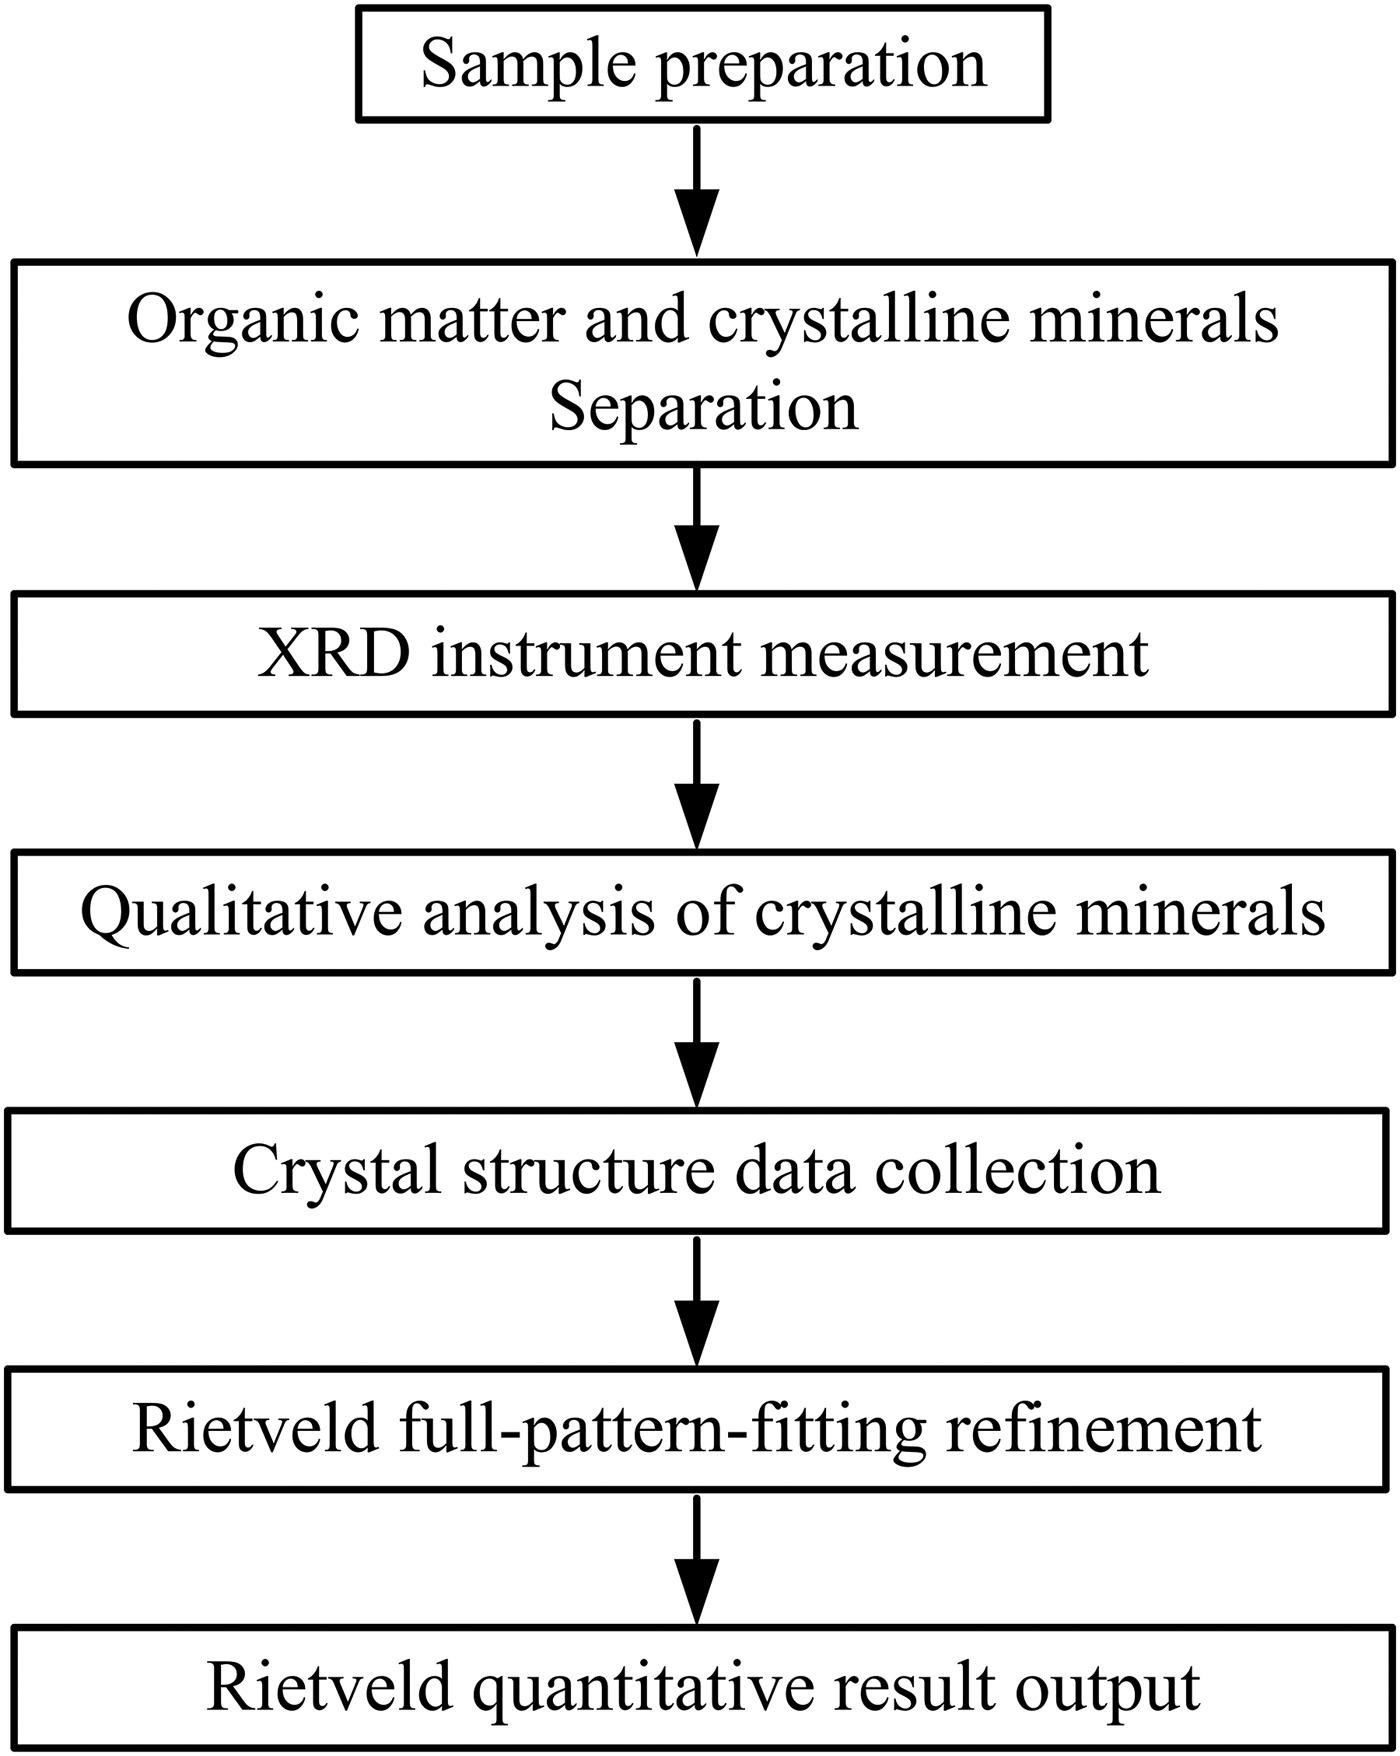
Figure 1. A generalized flow-sheet for the Rietveld quantitative analysis of crystalline minerals in organic-rich rocks.
In this work, the mixed samples of organic matter and crystalline minerals at given proportions were prepared to investigate the effect of organic matter. The effect of organic matter on the precision and accuracy of the Rietveld quantitative analysis of crystalline minerals in CG was discussed in detail. This work is hopeful to provide an approximate and efficient method for the Rietveld quantitative analysis of crystalline minerals in CG.
II. EXPERIMENTAL
A. Materials and reagents
CG samples in the present study were collected from Qinshui coalfield in Shanxi Province, China. The bulk samples were air-dried and ground to fine powder (≤75 µm) using a planetary ball mill (Instrument Plant of Nanjing University, QM-3SP2). The pulverized samples were stored in ziplock bag and labeled as Samples 1, 2, 3, 4, and 5.
Zinc oxide, as an internal standard, was an analytical reagent purchased from Beichen Reagent Factory, Tianjin, China.
B. Samples preparation
The low-temperature oxygen-plasma ashing procedure was implemented to obtain relatively unaltered crystalline minerals which are intimately distributed in CG (Winburn et al., Reference Winburn, Griera, McCarthya and Petersona2000; Ma et al., Reference Ma, Bai, Li, Bai and Kong2013; Tian et al., Reference Tian, Zhang, Zhao and Guptab2014). The ashing procedure was performed using a K1050X low-temperature oxygen-plasma asher (Quorum Technologies Ltd.) and the residue was named as LTA. About 1 g of the pulverized sample in a corundum crucible was put in the low-temperature oxygen-plasma asher, and the radiofrequency powder was set at 70 W. After ashing at 120–150 °C for about 1 h, the corundum crucible was taken out, and then the sample was stirred to make a new surface. The previous step was repeated for several times until the weight loss after the run was negligible. The total ashing time for 1 g sample was typically 6–8 h. About 5 g of LTA was needed for one of the samples, to provide sufficient material for the follow-up study.
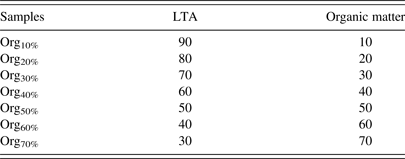
To investigate the effect of organic matter on the Rietveld method, the mixed samples of organic matter and crystalline minerals (organic–mineral mixtures) at given proportions were prepared. The demineralization procedure in accordance with the Chinese Standard Method GB/T 7560-2001 (2001) was applied to obtain organic matter, during which most crystalline minerals, such as quartz, clay minerals, and carbonate in CG are removed (Starck et al., Reference Starck, Burg, Cagniant, Tascón and Martinez-Alonso2004; Liu et al., Reference Liu, Jiang, Huang, Shen and Wu2011, Reference Liu, Jiang, Han, Shen and Zhang2014). Approximately 10 g of the pulverized sample and 80 ml of 5 mol/L hydrochloric acid (HCl) solution were placed in a glass beaker, and then the mixture was stirred and heated to 60 °C for 60 min. The mixtures were filtered through a medium porosity sand-core funnel. The filter residue was transferred to a Teflon beaker, and 80 ml of 33 mol/L hydrofluoric acid (HF) solution was added. The mixtures were stirred and heated to 60 °C for 60 min again. The mixtures were diluted, filtered, and washed with warm distilled water, and then dried to a constant weight. The HCl/HF washed residue was known as organic matter in this study. The obtained LTA and organic matter were mixed in an agate mortar for 30 min at various proportions as shown in Table I.
Table I. Blending proportions of LTA and organic matter in organic–mineral mixtures (wt.%).
C. Experimental methods
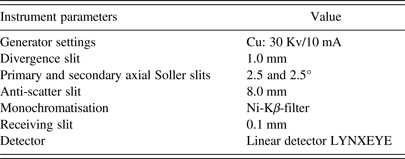
All samples (CG, LTA, and organic–mineral mixtures) were carefully homogenized with 10 wt.% zinc oxide in an agate mortar for 30 min (Ibáñez et al., Reference Ibáñez, Font, Moreno, Elvira, Alvarez and Querol2013). The XRD patterns of the homogenized samples were recorded using a Bruker D2 Advance X-ray diffractometer. The instrumental parameters for the Bragg–Brentano system were listed in Table II. The fine powder was packed into a sample holder having a circular shape with an area of 3.14 cm2 and a depth of 1 mm. The surface of the packed powder was pressed and smoothed with a piece of flat glass. The weight of loaded sample was kept between 0.40 and 0.45 g, which was sufficient to make a compact sample with correct height and smooth surface. This sample holder was rotated at a rate of 1 rpm to avoid preferential orientation effects. The scans were performed between 5–80° and 5–130° (2θ) with a 0.01° step size and a counting time of 0.1 s step−1 (Chen et al., Reference Chen, Liang and Wang1995).
Table II. Instrumental parameters for Bragg–Brentano system.
Using Bruker Diffracplus EVA software in combination with ICDD Powder Diffraction File (PDF2 2004 edition), the crystalline minerals in LTA, CG, and organic–mineral mixtures were identified. Then the Rietveld quantitative analysis was carried out with Bruker TOPAS program (2003–2009). The detailed fitting procedures about this software were described elsewhere (Izumi and Yong, Reference Izumi and Young1993; Gan et al., Reference Gan, Taylor, Xu, Arie, Robert, Wang and Peter2013). The crystal structures of the analyzed crystalline minerals were extracted from the FIZ Karlsruhe Inorganic Crystal Structure Database (ICSD 2009/2) in the form of crystallographic information files (.cif).
The elemental compositions of LTA were measured using an Inductively Coupled Plasma-Optical Emission Spectroscopy (ICP-OES, Optima 7000DV, Perkin-Elmer). The instrumental parameters and operating conditions were optimized to ensure sufficient precision and accuracy. The chosen wavelengths of Al, Si, Fe, K, Ca, Mg, and Ti were 308.2, 251.6, 259.9, 766.4, 317.9, 285.2, and 336.1 nm, respectively (Low and Zhang, Reference Low and Zhang2012).
D. Statistical methods
Statistical parameters including the average (AVG), standard dispersion (SD), relative standard deviation (RSD), and absolute error (AE) were used to describe the Rietveld quantitative result. All these statistical parameters were calculated according to the results of three parallel measurements. The AVG ± SD represents the average content of each crystalline mineral and its variable range among different parallel measurements. The calculation and notation for AVG ± SD are as follows:
 $${\rm AVG} = \sum\limits_{i = 1}^n {\displaystyle{{{x_i}} \over n}}, $$
 $${\rm SD} = \sqrt {\sum\limits_{i = 1}^n {\displaystyle{{{{({x_i} - \sum {{x_i}/n} )}^2}} \over n}}}, $$
where x i is the Rietveld measured content of each individual measurement, and n is the number of parallel measurements. The RSD, calculated from SD divided by AVG and then multiplied by 100%, is a simple metric for assessing the precision of the Rietveld quantitative result. The AE, which is equal to the absolute difference between the measured content and the real content, is used to evaluate the accuracy of the Rietveld quantitative result.
III. RESULTS AND DISCUSSION
A. Analysis of crystalline minerals in LTA
The results of qualitative and quantitative analysis of crystalline minerals in LTA were used as a reference in this study. Figure 2 showed that the crystalline minerals in LTA were quartz, kaolinite, illite, chlorite, muscovite, siderite, pyritic, anatase, calcite, and dolomite. The relative contents of each crystalline mineral can be quantitatively measured by the Rietveld-based TOPAS software and the results were presented in Figure 3. Three parts were observed from the TOPAS output: measured and calculated XRD patterns (top), difference plot between them (middle), and diffraction peak positions of each crystalline mineral (bottom). The measured and calculated patterns showed a good agreement, observed in the difference plot and low-weighted profile (R wp = 13.10). The Rietveld quantitative result showed that the illite (35.5 wt.%), quartz (18.7 wt.%), kaolinite (17.9 wt.%), and muscovite (10.7 wt.%) were the major crystalline minerals in LTA. In addition, the LTA also contained some minor crystalline minerals, such as chlorite (2.6 wt.%), anatase (2.4 wt.%), siderite (1.4 wt.%), dolomite (1.3 wt.%), calcite (0.5 wt.%), pyrite (0.3 wt.%), etc.
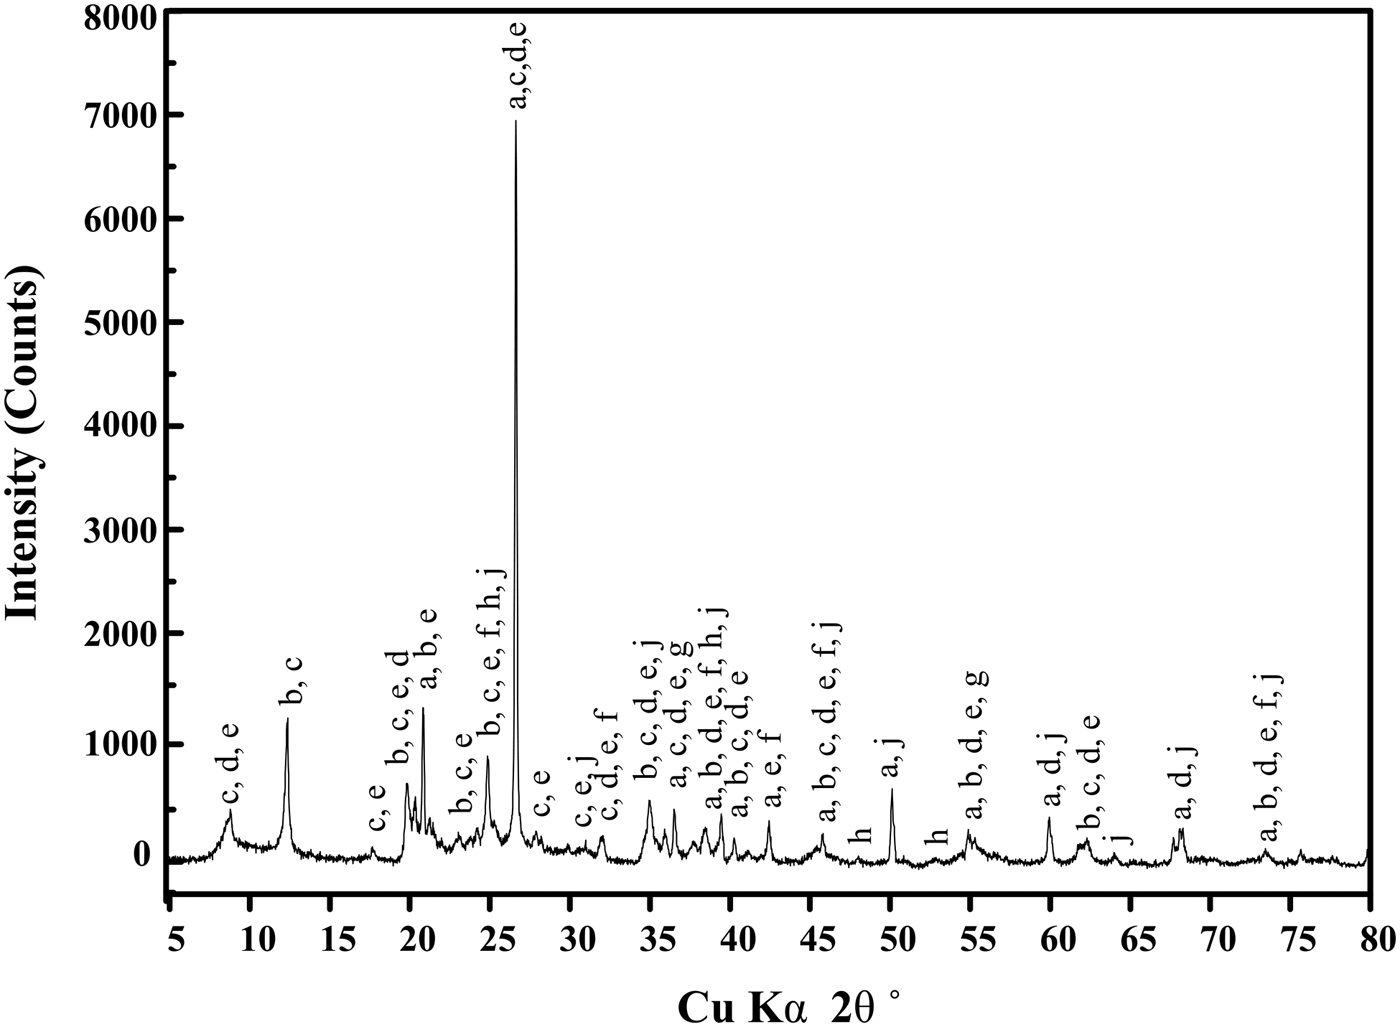
Figure 2. The XRD pattern of LTA obtained from CG. (a) quartz, (b) kaolinite, (c) illite, (d) chlorite, (e) muscovite, (f) siderite, (g) pyrite, (h) anatase, (i) calcite, (j) dolomite.
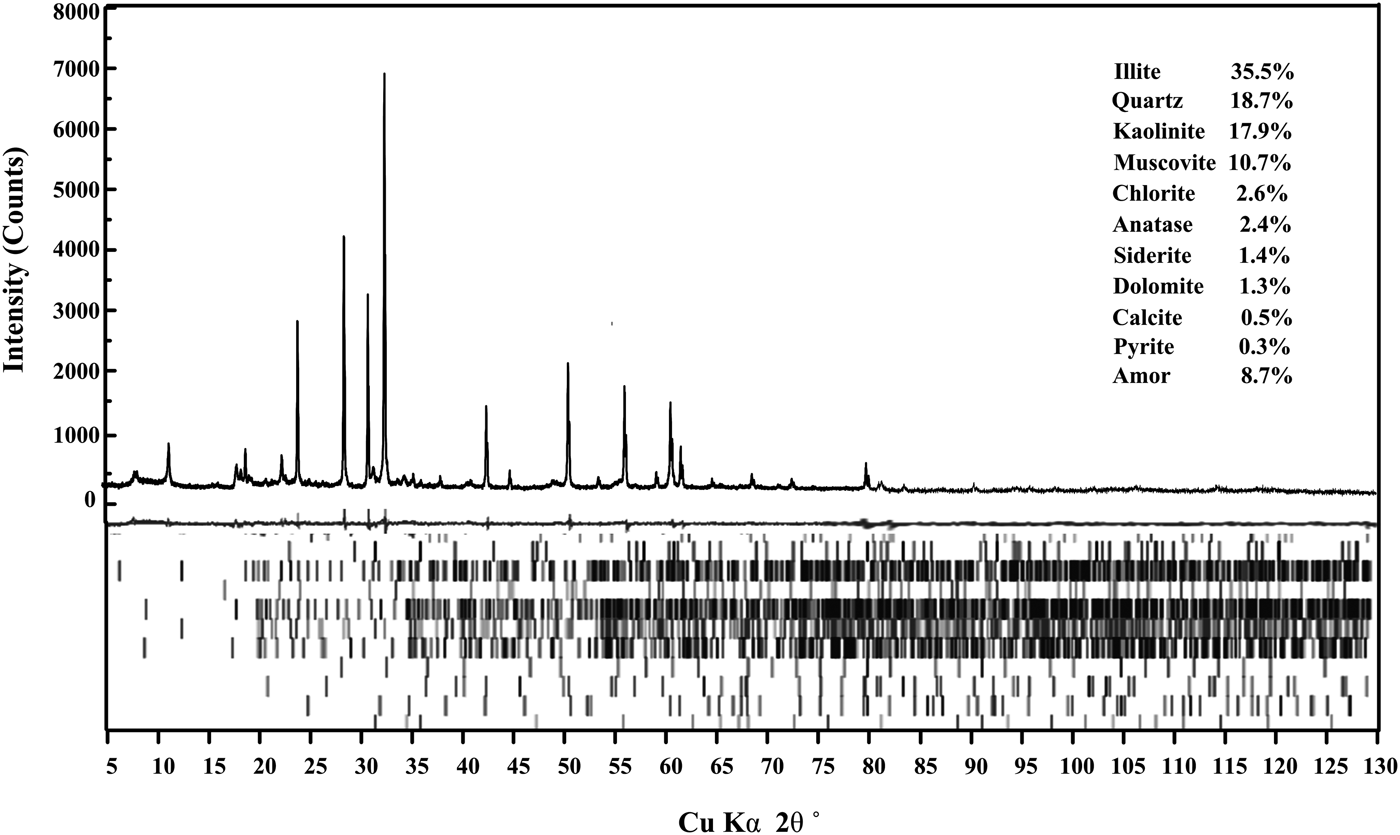
Figure 3. The Rietveld quantitative result of LTA spiked with 10 wt.% ZnO. The TOPAS output showed three parts: the measured and calculated XRD patterns (top), difference plot between them (middle), and diffraction peak positions of each crystalline mineral (bottom).
Based on the Rietveld quantitative result, the elemental compositions of LTA were calculated according to the relative contents and stoichiometric compositions of each crystalline mineral (Ward et al., Reference Ward, Taylor, Matulis and Dale2001).The stoichiometric compositions of the related crystalline minerals were listed in Table III. The elemental compositions of LTA calculated from the Rietveld quantitative result were showed in Table IV. For comparison, the relative contents of each element measured by ICP-OES were also showed in Table IV. The results obtained from these two methods were consistent, which indicated that the Rietveld quantitative analysis had a high credibility on the assessment of crystalline mineral contents in LTA.
Table III. Stoichiometric compositions of crystalline minerals in LTA.

a The dolomite, illite, and chlorite were assumed to have equal atomic proportions of Ca/Mg or Mg/Fe, to facilitate the aspect in this study.
Table IV. Elemental compositions of LTA determined from the Riveted method and ICP-OES method (wt.%).

B. Effect of organic matter on the Rietveld quantitative analysis
1. Precision and accuracy
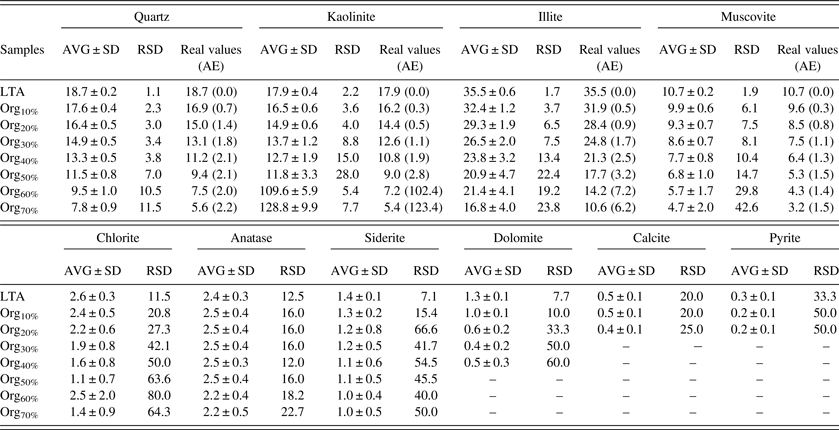
Both the precision and accuracy are important for the Rietveld quantitative analysis of crystalline minerals in CG. The high precision requires that the results of multiple parallel measurements are relatively close; and the high accuracy requires that the difference between measured value and real value is small. In general, the RSD and AE were used to evaluate the precision and accuracy of quantitative analysis result. The RSD within the range of 10% may be acceptable for a semi-quantitative method and the AE should be small as possible (Kidd et al., Reference Kidd, Varlashkin and Li1993). It should be specially explained that the real values of each crystalline mineral in organic–minerals mixtures were calculated according to the contents of each crystalline mineral in LTA (as shown in Section III Part A) and the added organic matter contents in organic–mineral mixtures.
Table V showed the statistical parameters of each crystalline mineral in LTA and organic–minerals mixtures with different organic matter contents. The RSD of minor crystalline minerals, such as chlorite, siderite, pyrite, anatase, calcite, and dolomite, in LTA were about 10%, which indicated that the variation of multiple parallel measurements of these crystalline minerals in LTA was unremarkable. The RSD of these minor crystalline minerals in organic–minerals mixtures, by contrast, were significantly higher than that in LTA. It implied that the determined contents of these minor crystalline minerals were negatively affected by the presence of organic matter. For the major crystalline minerals, the RSD of kaolinite, illite, muscovite, and quartz increased with the increasing of organic matter content. The RSD of major crystalline minerals were less than 10% when the organic matter content is within the range of 30%. However, the RSD of these major crystalline minerals were more than 10% when the organic matter content is beyond the range of 30%. The RSD of kaolinite even were more than 100% when the organic matter content is higher than 60 wt.%. The significant loss of precision might be attributed to the presence of organic matter in organic–minerals mixtures (Mandile and Hutton, Reference Mandile and Hutton1995). On the premise that the precision was acceptable, the accuracy of the Rietveld quantitative analysis of major crystalline minerals can be further investigated. The AE of kaolinite, illite, muscovite, and quartz were within the range of 2% when the organic matter content is <30 wt.%. Hence, it can be concluded that the RSD and AE were within the range of 10% and 2% respectively when the organic matter content is <30 wt%. That is, the Rietveld quantitative analysis of major crystalline minerals in organic–mineral mixtures were credible to a certain extent when the organic matter content is <30 wt.%.
Table V. Statistical parameters of each crystalline mineral in LTA and organic–minerals mixtures with different organic matter contents (wt.%).
2. Influencing mechanism
To clarify the effect of organic matter on the Rietveld quantitative method, the XRD patterns of organic matter, LTA, and CG were compared in Figure 4. It can be seen that the peak intensities of crystalline minerals in CG were weaker than that in LTA, especially in the region of 5–30° (2θ). The presence of organic matter, as an amorphous material, caused the appearance of “organic hump” in the XRD pattern. Figure 5 further showed that the “organic hump” area increased with the increasing of organic matter content. The same phenomenon was found in the research of oil shale by Mandile and Hutton (Reference Mandile and Hutton1995). This phenomenon explained why the precision and accuracy of the Rietveld quantitative analysis of crystalline minerals in organic–minerals mixtures declined with the increasing content of organic matter. Because the organic–minerals mixtures with different organic matter contents can produce varied areas of “organic hump” in XRD patterns. A correlated curve between the organic matter content and “organic hump” area was shown in Figure 6. The interference degree of organic matter to the XRD pattern was effectively reflected in the area ratio of “organic hump” between which in LTA and organic–minerals mixtures. It can be seen that the area ratio of “organic hump” was lower than 1.23 when the organic matter content is <30 wt.%. As a result, the effect of organic matter on the XRD pattern was unapparent and the Rietveld quantitative result of crystalline minerals were credible to a certain extent when the organic matter content is <30 wt.%.

Figure 4. The XRD patterns of organic matter, LTA and CG with 10 wt.% ZnO. The inset showed an expanded view of the corresponding samples in 2θ = 5–30°. (a) quartz, (b) kaolinite, (c) illite, (e) muscovite, (h) anatase, (k) zinc oxide.

Figure 5. (Color online) The XRD patterns of organic-minerals mixtures with different organic matter contents in 2θ = 5–30°.
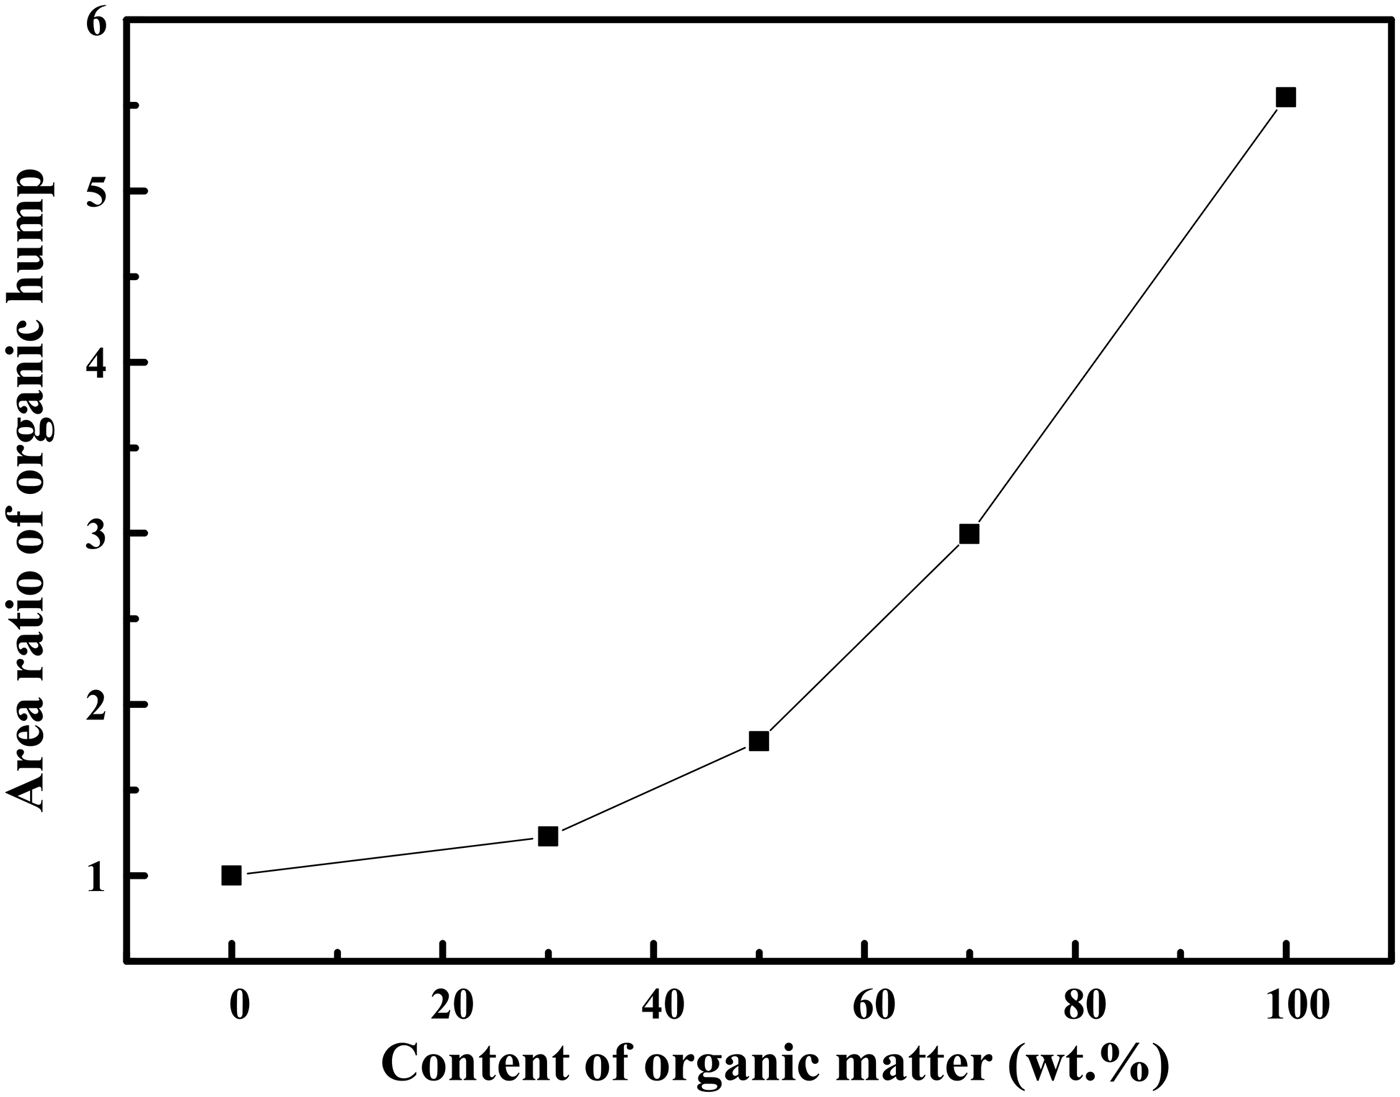
Figure 6. The area ratios of “organic hump” in LTA and organic-minerals mixtures.
C. An approximate method for quantitative analysis of crystalline minerals in CG
From Section III Part B, an approximate method for quantitative analysis of crystalline minerals in CG without the separating of organic matter and crystalline minerals can be proposed when the organic matter content is <30 wt.%. To verify the reliability and applicability of this method, it was performed in other CG samples with different organic matter contents. As a reference, the relative contents of crystalline minerals in the corresponding LTA were also measured by the Rietveld method.
As shown in Table VI, the AE of major crystalline minerals, such as quartz, illite, kaolinite, and muscovite, were within the range of 2% when the organic matter content is <30 wt.% (such as Samples 1, 2, and 3). The AE of these major crystalline minerals were beyond the range of 2% when the organic matter content is >30 wt.% (such as Samples 4 and 5). It reinforced the fact that the Rietveld method without the separating of organic matter and crystalline minerals could be used to the quantitative analysis of major crystalline minerals in CG when the organic matter content is <30 wt.%. In fact, in many cases, the CG with a relatively large component of organic matter would be used in combustion to generate electricity. The high added-value utilization always would choose the CG with more crystalline minerals and less organic matter. Hence, this method can be mostly used for the quantitative analysis of crystalline minerals in CG during its high added-value utilization.
Table VI. Relative contents of major crystalline minerals in CG and the corresponding LTA (wt.%).

IV. CONCLUSION
The Rietveld quantitative analysis of crystalline minerals in CG was affected by the presence of organic matter. For the minor crystalline minerals, the presence of organic matter led to a significant loss of precision and accuracy of the Rietveld quantitative result. With respect to the major crystalline minerals, the precision and accuracy of the Rietveld quantitative result declined with the increase in the organic matter content. The decrease of precision and accuracy can be attributed in part to the presence of organic matter, which can produce an increased background noise in the XRD pattern, especially appeared in the region of 5–30° (2θ).
The effect of organic matter on the Rietveld quantitative analysis of major crystalline minerals was unremarkable to a certain extent when the organic matter content is <30 wt%. The RSD and AE were within the range of 10% and 2%, respectively. As a result, an approximate and efficient method for the quantitative analysis of crystalline minerals in CG was established without the separating of organic matter and crystalline minerals when the organic matter content in CG is <30 wt.%.
ACKNOWLEDGEMENTS
This work was supported by the National Hi-Tech Research and Development Program of China (863 Program, 2011AA06A103) and National Natural Science Foundation of China (Grant no. 21506121).


