


1. Introduction
The Nile Delta and East Mediterranean basins have experienced extensive exploration and production of gas, condensate and light oil in the last three decades. Those activities resulted in large-scale discoveries with estimated resources and reserves of more than 62 trillion cubic feet of gas (Niazi & Dahi, Reference Niazi and Dahi2004). Most of that gas was discovered in the shallower reservoirs of the Pliocene and Miocene sands (Dolson et al. Reference Dolson, Shann, Matbouly, Harwood, Rashed, Hammouda, Downey, Threet and Morgan2001). According to the last resources estimation done by the US Geological Survey in 2010, those basins still have more than 150 trillion cubic feet of unexplored hydrocarbons, especially in the deeper targets of the Oligocene and Cretaceous. British Petroleum has taken up the challenge to explore the Oligocene deep water and discovered 1–3 trillion cubic feet of gas in the Satis field (Abdullayev, Reinprecht & Villinski, Reference Abdullayev, Reinprecht and Villinski2011). Recently, the Oligocene reservoir plays have become an important exploration target in the Nile Delta, especially in the onshore East Nile Delta. The study area covers about 155*90km2 representing the onshore East Nile Delta and northern part of the Eastern Desert (Fig. 1). Most of the geological studies have focused on upper Miocene (Messinian) and Pliocene reservoirs in the onshore–offshore Nile Delta. However, some studies dealing with the regional context from the Oligocene to Pliocene have focused on the West Nile Delta and offshore East Nile Delta (Dolson et al. Reference Dolson, Shann, Matbouly, Harwood, Rashed, Hammouda, Downey, Threet and Morgan2001, Reference Dolson, Boucher, Dodd and Ismail2002 a,b, Reference Dolson, Boucher, Siok, Heppard, Doré and Vining2005, Reference Dolson, Atta, Blanchard, Sehim, Villinski, Loutit, Romine, Marlow, Kendall and Yose2014; Boucher et al. Reference Boucher, Dolson, Siok and Heppard2004; Whaley, Reference Whaley2008; Kellner et al. Reference Kellner, El Khawaga, Brink, Brink-Larsen, Hesham, Abu El Saad, Atef, Young and Finlayson2009; Abdullayev, Reinprecht & Villinski, Reference Abdullayev, Reinprecht and Villinski2011). The objectives of the present paper are to describe and interpret the sedimentary facies and depositional architecture of the Oligocene sequences within the onshore East Nile Delta through including a description and interpretation of different lithologies and stratal geometries; precise correlation and sequential evolution of the different sand units; and a discussion on the role of global and local controlling factors on the Oligocene sedimentation.
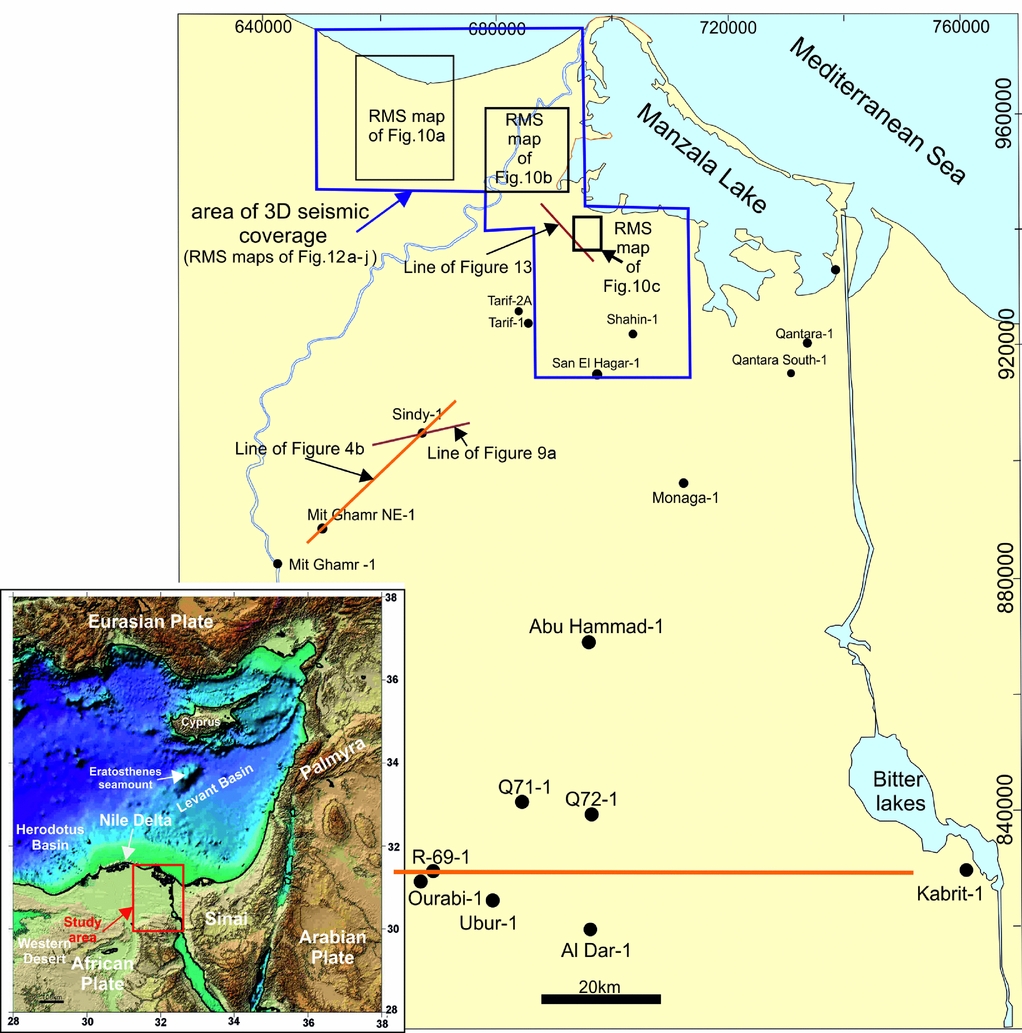
Figure 1. Map of the eastern onshore Nile Delta showing the seismic and well data used in this study. Blue polygon outlines large merged 3D seismic surveys. The location of the seismic lines shown in Figures 4b, 9a, 13, and locations of Figures 10a–c and 12 are indicated. The inset shows a regional map of the Eastern Mediterranean showing the tectonic plates and basins present.
2. Geologic setting
Oligocene sequences in the Nile Delta overlie the Cretaceous/Eocene rocks and underlie thick Miocene deposits (Moussa & Matbouly, Reference Moussa and Matbouly1994). The Oligocene succession has been described as a succession of marine siliciclastic sediments and marly limestones to the north (El-Heiny & Enani, Reference El-Heiny and Enani1996; Ouda, Reference Ouda1998; Soliman & Orabi, Reference Soliman and Orabi2000) and fluviatile sands and gravels to the south (Said, Reference Said and Said1990). The Oligocene deposits were sourced from the south via an up to 300m deep canyon with about 12 entry points (Dolson et al. Reference Dolson, Shann, Matbouly, Harwood, Rashed, Hammouda, Downey, Threet and Morgan2001). The palaeogeographical maps of the Oligocene system in northern Egypt are presented in Salem (Reference Salem1976) and Dolson et al. (Reference Dolson, Boucher, Siok, Heppard, Doré and Vining2005, Reference Dolson, Atta, Blanchard, Sehim, Villinski, Loutit, Romine, Marlow, Kendall and Yose2014). The Oligocene sequences were deposited at a time of marine regression (Sestini, Reference Sestini, Whately and Pickering1989) with complete subaerial exposure of the South Nile Delta (Dolson et al. Reference Dolson, Shann, Matbouly, Harwood, Rashed, Hammouda, Downey, Threet and Morgan2001). The Oligocene sequences can be divided into two major units: the lower (upper Eocene–Oligocene) Dabaa shale (Sheikh & Faris, Reference Sheikh and Faris1985; Ouda, Reference Ouda1998) and the upper (upper Oligocene) Tineh Formation (Rossi, Biffi & El Sharaby, Reference Rossi, Biffi and El Sharaby1983).
The Nile Delta region experienced rifting and extension in Jurassic and Early Cretaceous times with development of E–W-trending basins (Mosconi et al. Reference Mosconi, Rebora, Venturino, Bocc and Khalil1996; Loutit et al. Reference Loutit, Allard, Dolson, Schruers and Laura2001). This was followed by general post-rift thermal cooling and subsidence with shelf-margin formation (Dolson et al. Reference Dolson, Shann, Matbouly, Harwood, Rashed, Hammouda, Downey, Threet and Morgan2001, Reference Dolson, Boucher, Siok, Heppard, Doré and Vining2005, Reference Dolson, Atta, Blanchard, Sehim, Villinski, Loutit, Romine, Marlow, Kendall and Yose2014). During Late Cretaceous–Miocene times, the Jurassic–Early Cretaceous rift basins were inverted with development of the Syrian arc series of large NE–SW-oriented folds south of the Nile Delta and Eastern Mediterranean regions (Moustafa & Khalil, Reference Moustafa and Khalil1989, Reference Moustafa, Khalil and Said1990, Reference Moustafa and Khalil1994; Chaimov et al. Reference Chaimov, Barazangi, Al-Saad, Sawaf and Khaddouri1993; Shahar, Reference Shahar1994; Ayyad & Darwish, Reference Ayyad and Darwish1996; Abd El-Motaal & Kusky, Reference Abd El-Motaal and Kusky2003; Abd-Allah, Reference Abd-Allah2008). The tectonostratigraphic evolution of the East Nile Delta is shown in Figure 2. The ‘hingeline’ (Figs 3, 4) is an Upper Cretaceous carbonate shelf edge that forms the southern boundary of the thick Neogene sediments in the Nile Delta. It is an important feature that affected the overall stratigraphic and tectonic evolution of the Nile Delta basins (Said, Reference Said1981; Orwig, Reference Orwig1982; Harms & Wray, Reference Harms, Wray and Said1990). Sarhan & Hemdan (Reference Sarhan and Hemdan1994) indicated that the hinge zone is characterized by a remarkable increase in dip rates of the northern component for seismically mappable Cretaceous and Eocene horizons. This is evidenced by the WNW–ESE-trending basement fault throwing to the north. A following rift phase (Gulf of Suez rift) occurred during Oligo-Miocene time with a dominant extension orientated in NW-trending faults owing to divergence of the African plate away from the Arabian plate (e.g. Bosworth, Reference Bosworth1994; Patton et al. Reference Patton, Moustafa, Nelson, Abdine and London1994). The Oligo-Miocene or older E–W- and NW-trending faults in the Nile Delta were suggested to be related to the initial rifting phases of the Gulf of Suez (Hussein & Abd-Allah, Reference Hussein and Abd-Allah2001; Abd-Allah, Abdel Aal & Ghandour Reference Abd-Allah, Abdel Aal and Ghandour2012; Fig. 3). This tectonic activity resulted in the thickening of the Oligocene sediments in a NW–SE direction across the East Nile Delta (Abdel Aal et al. Reference Abdel Aal, Shrallow, Nada and Shaarawy1996). The Oligocene sequences were deposited during a phase of general rift initiation and intermittent transpression along the Syrian arc. The reactivation of the Tethyan E–W-oriented deep-seated Mesozoic faults was enhanced by both gravitational sliding of the Oligocene shales over the pre-Oligocene carbonate rocks in the hinge zone and Syrian arc transpression mechanisms (Hussein & Abd-Allah, Reference Hussein and Abd-Allah2001). The majority of the E–W-oriented deep-seated faults were reactivated to form highs in the south and lows to the north with extrusion of basaltic flows (Hussein & Abd-Allah, Reference Hussein and Abd-Allah2001). A regional cross-section (Fig. 4) demonstrates the gradual basinward thinning of the Nile Delta wedge (Sestini, Reference Sestini, Whately and Pickering1989).
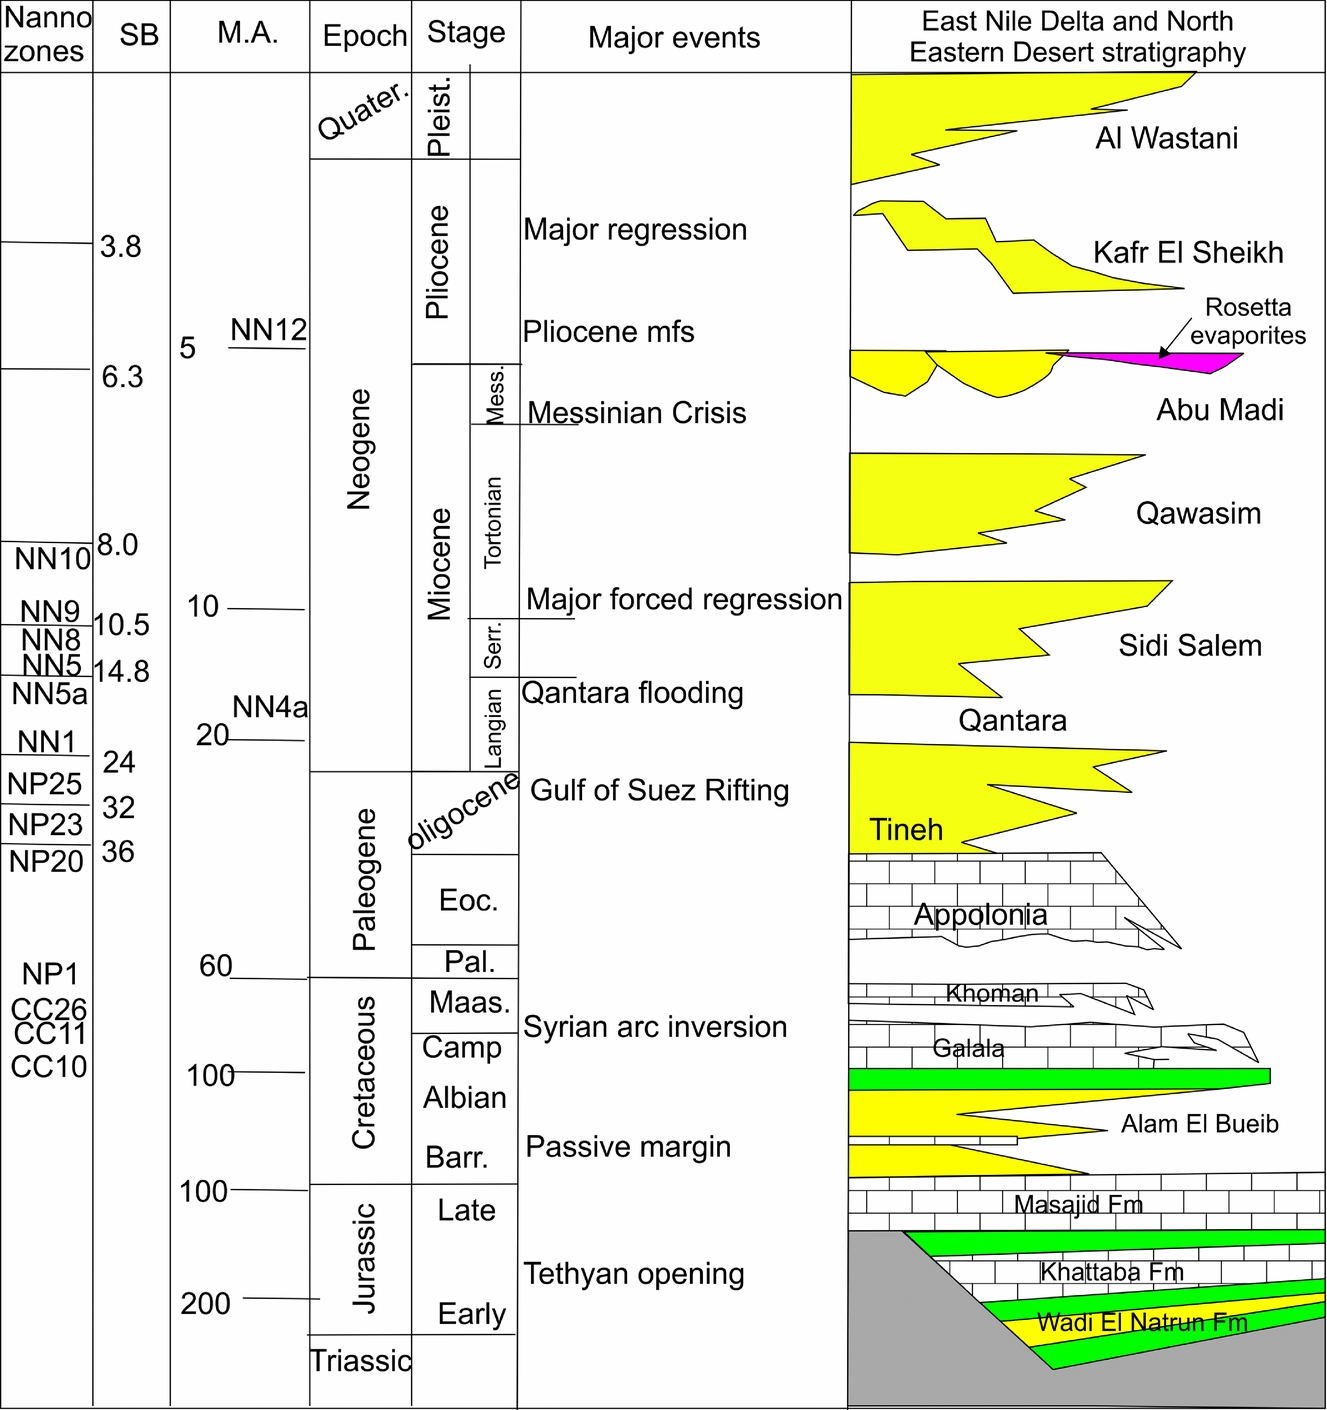
Figure 2. Tectonostratigraphic framework of the Nile Delta and the southern extension in the North Eastern Desert (modified after Dolson et al. Reference Dolson, Boucher, Siok, Heppard, Doré and Vining2005).

Figure 3. Regional structural domain map of northern Egypt compiled after Abdel Aal et al. (Reference Abdel Aal, Price, Vaitl and Shrallow1994, Reference Abdel Aal, El Barkooky, Gerrits, Meyer, Schwander and Zaki2000) and Hussein & Abd-Allah (Reference Hussein and Abd-Allah2001).

Figure 4. (a) NE–SW schematic cross-section of the East Nile Delta showing the stratigraphic and structural frameworks. (b) NE–SW dip-oriented seismic section along the main progradation direction of the Oligocene across the southern part of the study area showing detailed geometry of the clinoforms 1–4 and the shelf-edge trajectories (dashed black line); ascending, descending and flat. Location of line is the black rectangle in (a). Seismic data courtesy of Melrose–Egypt.
3. Dataset and methodology
This study utilizes a comprehensive approach that integrates seismic interpretation and wireline log analysis, and characterization of cutting samples of Oligocene sediments in the onshore East Nile Delta. Four types of data were used in this study: wireline logs of 17 wells, a suite of 2D and 3D seismic lines, and the available palaeontological data for 15 selected wells. Well data were the primary dataset for the southern part of the study area, whereas 3D seismic data were the principal dataset in the northern part of the onshore Nile Delta (Fig. 1). Well data include spontaneous potential (SP) and gamma-ray (GR) logs. Eight wells include velocity surveys used for time–depth conversion. Palaeontological reports and charts were compiled from the Egyptian General Petroleum Corporation (EGPC) and Paleoservice. They include faunal zonal tops of the typical benthic and planktonic foraminiferal assemblages. The biostratigraphic zonation and faunal identification of some selected samples were carried out by Samy Ahmed (chief biostratigrapher at BP-Egypt). Detailed lithofacies description was done for the Oligocene succession in the studied wells based on a combination of well cuttings and well-log analysis to interpret the depositional environment or to substantiate the depositional environments interpreted from seismic data. Isopach maps were constructed for the studied succession based on the drilled wells and some pseudowells to achieve a more accurate image of the thickness variation of the Oligocene sediments in the study area.
The identification of shelf-edge trajectories involves examining cross-sections orientated parallel to the depositional-dip direction (Fig. 4b). A line drawn through each break-in-slope of successive clinoforms determines the subsequent position of the shelf-edge break and indicates the angle of the shelf-edge trajectory.
The morphology, architecture and internal sedimentary facies of the deepwater systems were imaged in 3D seismic data by extracting root-mean-square (RMS) seismic attributes based on the interpreted horizons. The RMS attribute is the best seismic attribute used to characterize this deepwater system (Jiang et al. Reference Jiang, Weimer, Henriksen, Hammon, Prather, Deptuck, Mohrig, Van Hoorn and Wynn2012). Plan-view dimensions of morphological features are given in metric units, and vertical dimensions, such as thickness and height, are given in milliseconds (ms) of two-way travel time (TWTT). Time-to-depth relationships are derived from well data, and show that the equivalent true vertical depth (TVD) at 4800ms TWTT is c. 3000m. Interpretation of the seismic data was based on correlation with the well data. Chrono- and lithostratigraphically significant surfaces identified from the interpretation of electrical logs and biostratigraphic information were tied to the seismic volumes using velocity log data.
The study interval was within the upper 500ms (650m) of strata and extended from the top Oligocene down to a base horizon that extended across the study area. Detailed work on the seismic data has also yielded significant information on the stacking geometries of individual channels. The seismic and well data have been integrated to provide a reconstruction of the 3D depositional geometries of the Oligocene channels for the key stages of their development. Stratigraphic and depositional cross-sections along and across the depositional dip were constructed to delineate the vertical and lateral distribution of the Oligocene sediments. The formation mechanisms of Oligocene deposits were investigated through the reconstruction of palaeogeography, sea level, shelf-edge trajectories and sediment source systems.
4. Stratigraphic framework and shelf-edge trajectories
The Oligocene sequence is a shelf-slope clinoform system, exhibiting a mainly progradational geometry reaching up to 1000–1500m in thickness (Fig. 5). The lithology of this unit is characterized by coarse-grained fluvial to deltaic sediments that grade basinwards into mudstones with intercalations of sandy intervals increasing in frequency and thickness towards the top of the unit. The gross seismic stratigraphic framework of the Oligocene was described using a representative section that is parallel to the progradation direction of the deltaic depositional system (Figs 4b, 5). The basal boundary of the Oligocene sequence is the Eocene–Oligocene unconformity, a major erosional surface deeply truncating Eocene–Cretaceous sequences (Figs 4a, b, 5). From seismic data, the Oligocene succession is subdivided mainly in the southern part of the study area into seismically definable depositional packages bounded by laterally extensive and continuous surfaces (Fig. 4b), which can be identified by three different styles of shelf-edge trajectory trends. These are: (1) an ascending shelf-edge trajectory (clinoform 1, Fig. 4b) consisting of a succession of clinoforms 1 that builds upwards and basinwards, allowing for accumulation of deltaic and marginal marine sediments in the topset segment; (2) a descending shelf-edge trajectory (clinoform 2, Fig. 4b) consisting of basinward accretion with a negative shelf-edge trajectory, and the tops of clinoforms are in many places planed off by erosion, especially in proximal areas; and (3) a flat or even slightly downward-directed shelf-edge trajectory (clinoforms 3 and 4, Fig. 4b).

Figure 5. Slightly dip-oriented panel through the study area reflecting the facies types and stacking pattern of the Oligocene succession (inset map shows location of the correlated wells). Not to scale. Abbreviations: LST – lowstand systems tract; TST – transgressive systems tract; HST – highstand systems tract.
The Oligocene clinoforms are difficult to trace in the northern part of the study area owing to the presence of extensive faulting in the hinge zone, and only a few wells penetrated the shallow zone of the Oligocene such as the Shahin-1 and Tarif-1 wells (Fig. 1).
5. Sedimentary facies analysis
The Oligocene sequences display considerable lateral facies variability. The classification into facies has been adopted to interpret the investigated sediments on a regional (basin) scale. In order to allow regional correlations, the recognition of medium- to large-scale architectural elements and sedimentary geometries was applied to define sequence boundaries within a process-oriented framework. The Oligocene sequences in the study area include laterally seven major facies; fluvial (channel ‘Fc’ and floodplain ‘Fp’), distributary channel (Dc), delta front (Df), delta plain/interdistributary bay fill (Dp/Bf), inner shelf muds (Ism), prodelta/slope muds (P) and slope sands (Sc and Sl) are identified and differentiated on the basis of their lithologies, grain size, wireline log patterns and seismic geomorphology. The general distribution of these facies in the study area is illustrated in Figure 5.
5.a. Fluvial (Fc–Fp)
These facies are common in the southern part of the study area (Fig. 5) and consist of nonfossiliferous, massive, blocky, fining-upward, poorly sorted conglomeratic sandstone to coarse and very coarse-grained sandstone cycles (Fig. 6). Cycle bases have a sharp erosional surface and concave-up geometry, but the top is planar and flat. In places, the sandstone facies are capped by variegated to grey siltstones and claystones (Fp facies). Fc facies are interpreted as fluvial braided channel deposits and Fp facies are considered to be floodplain deposits based on lack of fossils, lithology, grain size, fining-upward pattern and comparison with nearby surface analogues. At least five stratigraphic Fc/Fp fluvial cycles were recognized in the Oligocene succession of the southern part of the study area (Fig. 6a). Multi-storey fluvial complexes are well recognized in the well logs and on 2D seismic data (Fig. 6b). A main feeder fluvial valley is traced in the area between the Aldar-1 and Kabrit-1 wells (Fig. 6b). The southern extension of these fluvial complexes is well exposed and accessible in several areas in the North Eastern Desert (Said, Reference Said and Said1990). Smaller outcrops between gullies provide a three-dimensional perspective on architectural elements. Field observations of bounding surfaces, geometry and the characteristics of architectural elements are documented by profiles along the Kattamiya–Sukhna road (S. S. Selim, unpub. data, 2016).

Figure 6. (a) Strike-oriented well-log cross-section in the fluvial setting (inset map shows location of the correlated wells). Facies assemblage reflects stacked fluvial channel cycles. The Oligocene sediments thin towards Al Dar-1 well that represents the area of interchannel exposed shelf sediments. For legend see Figure 5. (b) E–W seismic section showing the multi-storey fluvial channels of the Oligocene fluvio-deltaic canyon fill. Seismic data courtesy of Melrose–Egypt.
5.b. Distributary channel (Dc)
This facies is recognized at Monaga-1 well (Fig. 7). It is characterized by fining-upward, coarse to medium-grained sandstone with a sharp and erosive base (Fig. 7). It interfingers with bay or delta plain muds (Dp/Bf). This facies is interpreted as distributary channel (Dc) deposits on a delta plain based on the fining-upward pattern and its interfingering with Dp/Bf. It differs from the distributive slope channels that interfinger with slope muds.

Figure 7. Slightly strike-oriented panel for the delta plain, delta front and distributary channels in the southern part of the study area (inset map shows location of the correlated wells). For legend see Figure 5.
5.b.1. Delta plain/interdistributary bay (Dp–Bf)
This facies is recognized in the Monaga-1, Mit Ghamr-1 and Mit Ghamr NE-1 wells (Fig. 7). It consists of dark grey to greenish shale, partly sandy. It is partly rich in organic matter and brackish marine fauna such as ostracods and gastropods, in addition to a foraminiferal assemblage of Bulmina sp., Cibicides sp. and Globigerina sp. with reworked large foraminifera such as Nummulites (Fahmy, Roveda & Allen, Reference Fahmy, Roveda and Allen1978). Some thin, fine-grained sandstone interbeds are encountered. This facies is thin, and probably has a large lateral extent as it is penetrated in many wells such as Monaga-1, Mit Ghamr-1 and Mit Ghamr NE-1 (Fig. 7). This facies is interpreted as bay fill or lower delta plain deposits based on the fine-grained nature, richness in organic matter and abundance of brackish marine fauna as well as facies association.
5.c. Delta front (Df)
The delta front facies include proximal and distal subfacies:
This proximal subfacies is recognized in Abu Hammad-1 well (Fig. 7). It is characterized by blocky, coarsening-upward, medium- to coarse-grained sandstone with a lime-mud matrix. This facies is interpreted as proximal delta front deposits based on the blocky nature, grain size, coarsening-upward motif, composition and facies association.
The distal subfacies consists of alternations of very fine to lower medium-grained glauconitic sandstone and light to dark grey non-calcareous shale. This subfacies interfingers northwards, i.e. seawards, with the prodelta facies. This subfacies is interpreted as distal delta front deposits based on its lithology, grain size and facies association. This subfacies is observed in the upper sedimentary package of the Oligocene succession at Sindy-1 well (Fig. 5).
5.d. Inner shelf muds (Ism)
This facies is recognized in Monaga-1 well (Fig. 5) and consists of brownish grey, massive, sandy mudstone with some white to yellowish white massive limestone. Minor sandstone interbeds are also encountered. It is characterized by an abundance of benthic foraminifera such as Nummulites sp., Sphareogypsina globulus, Amphistegina sp., Lepidocyclina sp. and rare planktonic species such as Globigerina ampliapertura, Globorotalia opima and some ostracods (Fahmy, Roveda & Allen, Reference Fahmy, Roveda and Allen1978). The Nummulites are restricted to inner–middle shelf environments with low to intermittently agitated energy conditions (P. K. Saraswati, unpub. Ph.D. thesis, Indian Institute of Technology Bombay, 1997). The common occurrence of the benthic foraminifera and the rarity of the planktonic foraminifera reflect the deposition in a shallow-marine environment. The fine-grained facies, abundance of benthic foraminifera and presence of terrigenous detritus reflect deposition in a shallow restricted marine environment.
5.e. Prodelta/slope muds (P)
This facies consists of grey to dark grey fossiliferous shales with thin fine-grained sands (Fig. 8a, b). It shows a serrated high gamma-ray signature and is intercalated with slope sands (e.g. Qantara South-1 and Sindy-1 wells; Fig. 5). This facies is common in the northern part of the study area and is up to 600m thick, and has a wedge shape in cross-section, thinning seawards and grading landwards into thinner delta front facies. The fauna is sparse and mainly planktonic foraminifera such as Globegerina ciperoensis, Globigerina ampliapertura, Globigerina opima opima and some agglutinated foraminifera (Ahmed, Reference Ahmed2004, Reference Ahmed2008). This facies is interpreted as prodeltaic to slope muds deposited below the storm wave base based on lithologic characteristics, faunal assemblage and facies association. The prodelta deposits are most probably characterized by a turbidite nature owing to their association with sandy turbidities and based on the general characteristics of the shelf-edge deltas of Porębski & Steel (Reference Porebski and Steel2003).

Figure 8. (a) 3D view of the palaeostructure of the Cretaceous–Eocene shelf edge and the main feeder slope channels. (b) Slightly dip-oriented panel for the slope system in the northern part of the study area showing the slope lobe facies encased in the slope muds (inset map shows location of the correlated wells). For legend see Figure 5.
5.f. Slope sands (Sc and Sl)
These facies show variable grain size and coarsening- to fining-upward motifs and are interpreted as slope sands based on their seismic morphology and intercalation with slope muds (Fig. 8a, b). The architectural elements of the slope sands include slope channels (Sc) and slope lobes (Sl, Fig. 8a, b). The slope channels (Sc) include feeder channels (Fig. 8a) and distributary leveed-channel complexes, and the slope lobes (Sl, Fig. 8b) include frontal splays, crevasse splays and lobes (Figs 8b, 10a–c). To illustrate the details and variability of the architectural elements in the study area, a series of sequential vertical profiles are shown in Figure 11 to illustrate the downslope evolution of the slope sand systems. These profiles are discussed in some detail below to emphasize the extensive depositional variability from upslope to downslope. In addition, seismic attribute maps such as RMS are introduced here to show the evolution of the slope channels and lobe geomorphology (Fig. 12). These RMS maps represent ten time slices at TWTTs of + 25–25ms (+ 33.7–33.7m), 25–75ms (33.7–101m), 75–125ms (101–168m), 125–175ms (168–235m), 175–225ms (235–302m), 225–275ms (302–369m), 275–325ms (369–436m), 325–375ms (436–503m), 375–425ms (503–570m) and 425–475ms (570–637m). The RMS amplitude maps illustrate a vertical evolution of more than three deepwater, sinuous channel belts (Fig. 12a–j). The brightest amplitudes (red to yellow) are interpreted as corresponding to relatively sand-rich areas and the darkest amplitudes (blue and green) to relatively sand-poor areas.
5.f.1. Feeder-channel system
The feeder-channel system is defined as an incised, moderately sinuous to non-sinuous channel complex that cuts a path from the southern part of the study area to feed sediment to the northern part of the basin (Figs 8, 9). The feeder-channel system consists of stacked fining-upward units as seen on the log (Fig. 8a). The unit consists of light grey, loose to cemented, very coarse to medium- grained sandstones with some basal lags. This unit shows a sharp and probably undulating scoured base. These units are separated by dark grey shale interbeds. It is interpreted as a high-density turbiditic slope channel (Sc, e.g. Lowe, Reference Lowe1982) based on lithologies, grain size, facies contacts and facies association. The presence of thin grey shale interbeds reflects the incremental sedimentation as the sandy turbidite events were punctuated by quiet/abandonment periods with deposition of hemipelagic muds to muddy turbidites. The structure contour map of the Eocene–Cretaceous periods, and the distribution of the channel facies reveals that at least two main feeder channels fed the East Nile Delta Basin from the south via sediment entry points at the palaeoshelf break southwest of Sindy-1 and South Qantara-1 wells, beyond the available 3D seismic dataset (Fig. 8a). The two feeder channels are the western channel (west of Sindy-1 well) and eastern channel (at South Qantara-1 well). Owing to data limitation, the focus will be on the western channel.

Figure 9. (a) Transverse seismic profile across western feeder channel (West Sindy-1 well), onshore East Nile Delta. The inset map is a time slice at 2.7sec. The location of the seismic line is shown in Figure 1. (b) Block diagram illustrating the western feeder channel-reincision stage and cut-and-fill architecture.
The western feeder channel is about 2 to 3km wide. It is characterized by complex aggradational stacking pattern with complex stacked channels (Fig. 9a, b). This channel cuts northwards along slope, and bifurcates to feed a complex network of leveed channels and lobes in both the western axial and eastern lateral systems. The formation of the eastern lateral system was a consequence of the development of a shallow ponded sub-basin owing to local faulting along the E–W-trending faults and/or NW–SE inverted structures (Fig. 13).
5.f.2. Leveed-channel system
The leveed channels are common depositional elements in the northern part of the study area in both the western and eastern systems. They display moderate- to high-amplitude reflectors with high to low continuity on the RMS amplitude maps with widths of 0.5 to 3.5km and sinuosity (i.e. the ratio of channel axis length to channel-belt length) between 1.2 and 2.2, and a thickness that varies from 50 to 100ms (~ 65–130m, Fig. 10a). The channel system has distinct downslope changes. In the two upslope profiles, channel fill tends to be aggradational with lateral migration (Fig. 11a, b). The downslope profile indicates that the channelized zone shows vertical aggradation with minor lateral migration (Fig. 11c). The most downslope profile illustrates that the channel becomes more distributive, with distinct stacked lobes or frontal splays (Fig. 11d). The reflector terminations result from the onlap of channel fills onto channel margins, and the truncation of older channels by a younger channel. Lateral migration and vertical aggradation is either continuous or discrete and occurs owing to cuts and fills of various magnitudes. At the base of a channel complex, most leveed channels are characterized by incision into the immediately underlying substrate (Fig. 11a). The leveed-channel belts are shown with downslope drift accompanying overall progradation, as the channel patterns were evolved through time (Fig. 12a–j). The lower package (Fig. 12a–e) shows downslope sweeping of the leeved channel belts of the western axial system with gradual westerly diversion with time, becoming completely shifted towards the NW and WNW (225–275ms, Fig. 12e). The successive distributive leveed-channel fills of the eastern lateral system are prograding to the E and ESE. These channels are feeding a smaller distributive channel complex, which trending N and NW parallels the axial system (Fig. 12a–e). The upper package (Fig. 12f–j) shows the return of an axial leveed-channel system that is diverted and swept towards the NE and NNE, and N with the absence of the WNW- and NW-trending channels. Seismically detectable cut-and-fill features (Fig. 10a–c) indicate turbidity currents of various velocity and magnitude. In this succession, avulsions and lateral switching are mostly related to the change in slope rugosity. The switching of the leveed channels to E/ESE and NW/WNW trends is most probably linked to rejuvenation of E–W/NE–SW-trending inherited structures and successive growth of a NW-trending transfer fault system, respectively. The NW-trending transfer faults are linked to the reactivated E–W-trending listric faults (Hussein & Abd-Allah, Reference Hussein and Abd-Allah2001). The shale diapirs of the lower Oligocene affect the slope rugosity. Other flow parameters can also cause avulsions such as increased flow discharge and increased sand-to-mud ratio (Pirmez et al. Reference Pirmez, Beaubouef, Friedmann, Mohrig, Weimer, Slatt, Coleman, Rosen, Nelson, Bouma, Styzen and Lawrence2000).
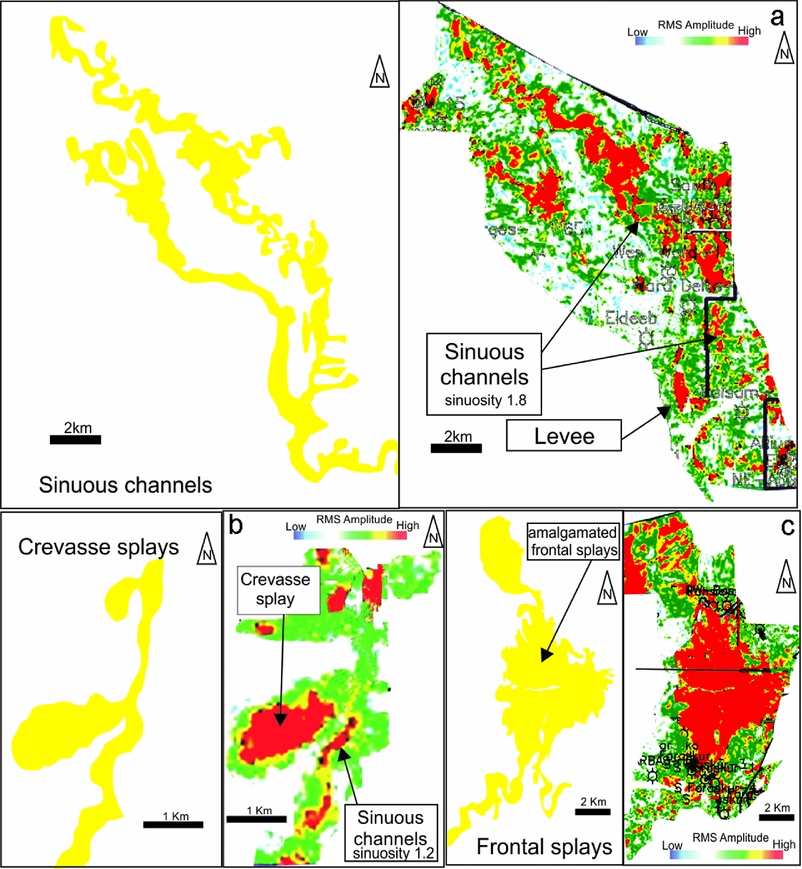
Figure 10. RMS amplitude map and interpreted different depositional elements of the slope environment: (a) leveed sinuous channel, (b) crevasse splay, and (c) frontal splay. The location of the RMS amplitude map area is shown in Figure 1.

Figure 11. Amplitude map 100ms above the top Oligocene with interpreted seismic strike sections (a–d) across the channel–splay systems. The deep blue reflector represents the top Oligocene. (a) Laterally accreted and vertically aggraded leveed channels with general eastward shift of the channels. (b) Vertically aggraded leveed channels. Lateral accretion and vertical aggradation of the sinuous channel. (c) The change from lateral accretion to vertical aggradation through sinuous channel evolution. (d) The vertical stacked turbiditic lobe/frontal splay packages with an eastward shift for these turbiditic lobes. Notice the small distributive channel truncates the lobes (yellow shades) and feeds these lobes. Seismic data courtesy of DGE.

Figure 12. Schematic maps show the proposed evolution of the depositional systems through the Oligocene in the northern part of the study area. Note: This Fig. 12 replaces the version in the original FirstView publication of this paper for which permission had not been granted. See Corrigendum notice 10.1017/S0016756817001108.

Figure 13. Seismic profile across the central part of the study area flattened on top Oligocene showing the E–W-trending block faulting and inverted Cretaceous–Eocene structures that controlled the Oligocene sedimentation. The location of the seismic line is shown in Figure 1. Seismic data courtesy of DGE.
5.f.3. Crevasse splays
The crevasse splays display moderate- to high-amplitude reflectors with high to moderate continuity (Fig. 10b). The crevasse splays are common in the axial system of the northern part of study area and display a width of 0.9 to 1.5km and length of 1–3km. The crevasse splays are commonly formed along outer channel bends where channel flow momentum results in an increased tendency for flows to overspill or breach the adjacent levee (Posamentier & Kolla, Reference Posamentier and Kolla2003).
5.f.4. Lobes and frontal splay complex
This complex is penetrated in the Shahin-1 and San El Hagar-1 wells and it consists of fine- to medium-grained sandstone beds. They range between 0.5m and 5m thick. The lobes mostly show a coarsening-upward motif (Fig. 8b), and are encased in dark grey shale of a prodelta setting. These lobes display a high amplitude with high to moderate continuity on RMS maps. Reflectors show a progressive thinning and transition from south to north and also towards the east and west (Fig. 11d). Reflectors display divergent ribbon-like patterns, interpreted as distributary channels that pass down dip into broad, fan-shaped structures, interpreted as frontal splays or lobes. These lobes may be coalesced laterally to form sheet-like or lobe complexes (Fig. 10c). The lobes and frontal splays are common in the western axial and eastern lateral systems of the northern part of the study area. In the western axial system, there are ten individual lobe elements. Individual lobe elements are 2–8km in width and 8–19km in downslope length (Fig. 10c). At least three individual lobes are encountered in the lateral eastern system 5–10km in width and 10–20km in downslope length (Fig. 12j). The elements prograde or step basinwards and laterally switch westwards with younger lobe elements commonly appearing to incise into older lobe elements (Fig. 11d). Each lobe element is associated with a distributive channel system that branches off from a larger, long-reach channel interpreted as a feeder channel. Some lobes appear to be truncated with small distributive channels that feed the successive or progressive lobes or frontal splays (Fig. 11d). The sinuosity of the distributive channels increases nearby the point at which the channel passes into a frontal splay (Fig. 10c). The transition from relatively confined flow within leveed channels to relatively unconfined flow within splay complexes can be caused by (1) a successive lowering of levee height downslope to where the high-density part of the flow is no longer effectively confined, or (2) an obvious reduction in channel gradient (Posamentier & Kolla, Reference Posamentier and Kolla2003). Some levee-confined channels feed relatively unconfined splay complexes that commonly display a distributive channel pattern.
5.g. Summary of depositional model
An isopach map (Fig. 14) of the interval between the top of the Eocene and the top of the Oligocene strata displays the relative location and thickness of the depocentres formed during Oligocene time. The remarkable change in thickness is obvious at the proposed shelf break. Relatively thin areas to the south of the shelf break are interpreted as recording the presence of Eocene and Cretaceous highs, especially along the Syrian arc belt, whereas thicker belts to the south are related to fluvio-deltaic valley filling. The thick areas to the north are interpreted as canyon or feeder-channel fill and slope sub-basins. More than three entry points for the feeder slope channels coincide with the proposed shelf edge.

Figure 14. Isochore map of the Oligocene sediments in the study area showing the subsurface geometry of a shelf-margin delta that is aligned along and extends downdip (northwards) beyond the shelf break (dashed black line) and the expected channel-belt trends (solid black lines).
The overall lateral facies change of the Oligocene deposits reflects that the fluvio-deltaic channel system to the south fed the slope channel system at the northern part of the study area. In shelf-edge delta suite, as confirmed from the sigmoidal dip cross-sectional shape, the thickest part is located near the offlap break of a pre-existing shelf margin (Figs 4b, 5, 14). The Oligocene deposits pinch out landwards by onlap onto the pre-existing Eocene–Cretaceous shelf carbonates and pinch out basinwards by downlap within hemipelagic shales. The Oligocene deposits show remarkable thickness variations (Fig. 14) probably owing to growth faulting. Comparison to the criteria of the shelf-edge deltas in Porębski & Steel (Reference Porebski and Steel2003) supports this depositional model.
The palaeo-bathymetry of the Oligocene shows that the Eocene–Cretaceous carbonate platform is deeply incised by fluvio-deltaic valleys (Fig. 6a, b). These valleys fed at least two feeder slope channels and maybe more (Fig. 8), which can be extrapolated through the upper part of the palaeoslope to the south despite the lack of data. They bifurcate to feed distributary leveed channels in the northern part of the study area (Fig. 12a–j). The distributary leveed channels represent two feeding systems: axial and lateral systems (Fig. 12a). This is most probably due to (1) syn-depositional growth structures such as E–W faults and tectonic inversion along the Syrian arc trend (Fig. 14); the reactivation of these structures during Oligocene time was elucidated by Hussein & Abd-Allah (Reference Hussein and Abd-Allah2001); (2) the formation of mud diapirs in the lower Oligocene shales (e.g. Khalil & Franchino, Reference Khalil and Franchino2002). A small change in seafloor topography, a ridge or depression, could lead to major changes in the sediment transport path from one site to another within the basin. The rejuvenated Syrian arc structures or faulted blocks (Fig. 14) can behave as flow barriers if they are developed and/or growing at rates high enough to influence sediment path (c.f. Shaw, Novoa & Connors, Reference Shaw, Novoa, Connors and McClay2004; Morley & Leong, Reference Morley and Leong2008), especially if these high zones developed along weakness zones such as an oblique strike-slip zone. The axial palaeoflow was bifurcated and deflected to become lateral ESE, flowing along troughs on the front or in between associated inverted structures/fault blocks.
6. Sequence stratigraphy and evolution
The Oligocene depositional episode records a time of major changes in palaeogeography and sediment dispersal systems of the East Nile Delta region. The Oligocene depositional system is characterized mainly by (1) the ancestral Eocene–Cretaceous carbonate shelf being exposed, especially in the southern reaches; (2) the development of the Oligocene fluvial valleys sourced from the Galala plateau and North Gulf of Suez uplands; (3) shelf deltas being formed under high sediment supply; and (4) shelf-edge deltas being formed and prograded.
The seismic facies analysis and interpretation in addition to well data integration of the Oligocene sediments are the basis for a tentative palaeogeographic reconstruction of the various units within the study area. The depositional history is illustrated through a series of stages (Fig. 15a–f). These stages represent two main cycles (sequences): lower and upper Oligocene, separated by a mid Oligocene sequence boundary. These cycles correlate well with the global Oligocene transgressive–regressive (T–R) cycles of Gradstein et al. Reference Gradstein, Ogg, Schmitz and Ogg2012 (Fig. 16).
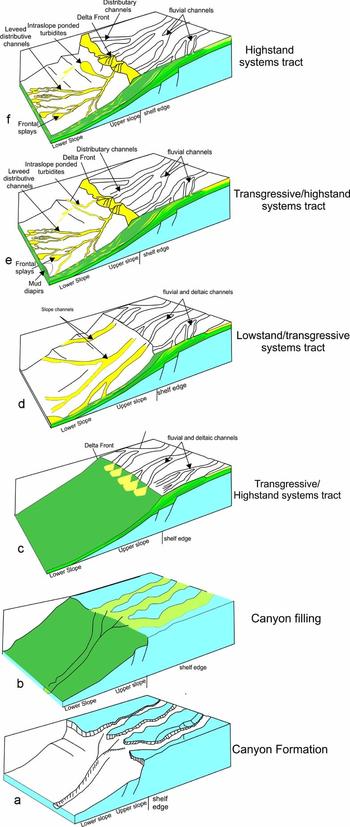
Figure 15. Block diagrams of the evolution of the Oligocene sequences in the study area: (a) lower Oligocene canyon formation; (b) lower Oligocene canyon filling; (c) lower Oligocene prograding shelf delta formation (TST/HST); (d) forced regression with formation of sequence boundary; (e) prograding shelf-edge deltas of late Oligocene with dominance of leveed channels, lower package; (f) prograding shelf-edge deltas of late Oligocene with dominance of frontal splays and lobes, upper package.
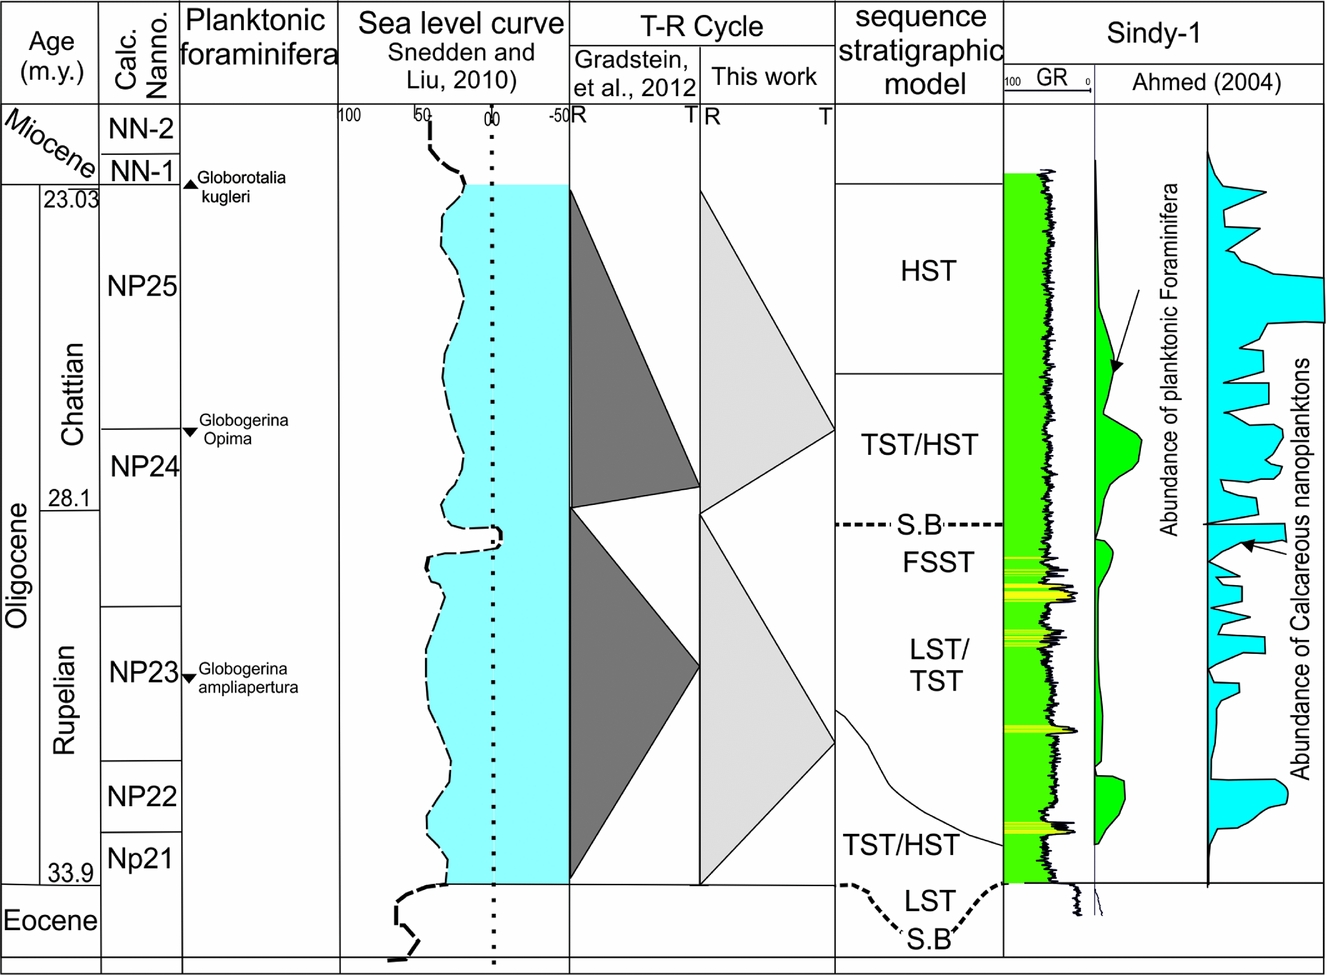
Figure 16. Oligocene chronostratigraphic framework and depositional cycles in the study area. FSST – falling stage system tract; LST – lowstand systems tract; TST – transgressive systems tract; HST – highstand systems tract; T – transgressive; R – regressive; S.B. – sequence boundary.
6.a. Lower Oligocene
During middle Eocene time, shelf carbonate deposition was dominant and blanketed the shelf during a relative sea-level highstand (Selim et al. Reference Selim, El Araby, Darwish and Abu Khadrah2011). A broad regional uplift associated with the opening of the Gulf of Suez rift and Syrian arc inversion caused a general northward tilt of Egypt towards the Mediterranean Sea during late Eocene time, which increased the clastic supply into the carbonate shelf (see Dolson et al. Reference Dolson, Boucher, Dodd and Ismail2002 b). By Oligocene time, deep subaerial valleys were incised into the exposed carbonate shelf (Dolson et al. Reference Dolson, Boucher, Dodd and Ismail2002 b). The lower Oligocene sequence includes two main stages.
6.a.1. Canyon formation and filling
Submarine canyons can develop either by (1) river incision, brought close to the shelf edge as a result of a relative sea-level fall, acting as nucleus points for further headwall collapse and then erosion by turbidity currents or (2) slope failure, independent of sea level or sediment supply, and subsequent headward growth of the canyon through retrogressive failure (Farre et al. Reference Farre, McGregor, Ryan, Robb, Stanley and Moore1983; Pratson et al. Reference Pratson, Nittrouer, Wiberg, Steckler, Swenson, Cacchione, Karson, Murray, Wolinsky, Gerber, Mullenbach, Spinelli, Fulthorpe, O'Grady, Parker, Driscoll, Burger, Paola, Orange, Field, Friedrichs, Fedele, Nittrouer, Austin, Field, Kravitz, Syvitski and Wiberg2007).
The erosional surface deeply truncating the Eocene–Cretaceous deposits that is outlined by a seismic reflector (Fig. 4b) indicates the formation of the basal Oligocene canyon on the slope. The Oligocene canyon is suggested to have been initiated by slope failure at the Cretaceous–Eocene shelf break. This is evidenced by the reactivation of the majority of E–W deep-seated faults by early Oligocene time to form high blocks in the south and low blocks in the north (see Hussein & Abd-Allah, Reference Hussein and Abd-Allah2001). This canyon was developed by gaining access to the fluvio-deltaic feeder system resulting from the sea-level fall at the base of the Oligocene. The initiated canyon served partly as a source and partly as a conduit for sediments delivered directly from the shelf.
The vertical aggradation and onlapping of stacked channels on both sides of canyon walls (Figs 4b, 9) indicate the canyon was changed from a conduit for sediment bypass to a site of deposition. This is proposed to have been deposited during a sea-level rise (e.g. Spinelli & Field, Reference Spinelli and Field2001, lowstand systems tract). The onlapping on both sides of canyon walls suggests that the influence of the current was significantly reduced (e.g. Rasmussen, Reference Rasmussen1994). Eventually, the canyon ceased to transport sediments, which were stored in the canyon and did not extend into the basin.
6.a.2. Shelf delta and early shelf-edge delta formation
The shifting of deposition landwards on the shelf with the prevailing of inner shelf and bay/deltaic deposits in the Monaga-1 and Mit Ghamr-1 wells (Fig. 5) as well as complex onlapping and downlapping seismic terminations against the incisional topography of the basal Oligocene unconformity (Fig. 4b) indicates a relative sea-level rise (transgressive systems tract); the shoreline was forced to transgress landwards and thus the earlier-constructed Cretaceous–Eocene platform became a drowned shelf. Shallow-water deltaic systems formed under high sediment supply. In turn, deltas were subsequently able to transit across the newly formed shelf, even during sea-level rise (highstand systems tract) under high sediment supply. These shelf deltas are well recognized in the lower Oligocene section of the Mit Ghamr NE-1 and Abu Hammad-1 wells (Figs 5, 7). The vertical facies changes from outer neritic to inner neritic biofacies in the South Qantara-1 well and from shelf muds to deltaplain facies in the Monaga-1 well (Fig. 5). These vertical facies changes and progradational pattern (Fig. 4b) confirm the dominance of the rate of sediment supply over the rate of relative sea-level rise (Normal regression) during the highstand systems tract. The deltas prograded basinwards until they reached the shelf break and formed shelf-edge deltas. At the southern part of the study area, the transition from the Eocene/Cretaceous carbonates to the Oligocene clastic sediments is sharp and truncated (e.g. Ubur-1 and Ourabi-1 wells, Fig. 6). The increase of clastic supply was enhanced by the rejuvenation of inverted Cretaceous structures and the initiation of the Gulf of Suez rifting (see Dolson et al. Reference Dolson, Boucher, Dodd and Ismail2002 b). The development of the mid to outer shelf delta causes entrapment of the coarse clastic sediments in the shelf setting with a dominance of marine mud deposition basinwards.
An ascending shelf-edge trajectory (clinoforms 1, Fig. 4b) indicates a relative sea-level rise during the lowstand systems tracts with development of the slope deposits onlapping the former slope. The high rate of sediment supply and the possibility of transport of sandy sediments to the slope are confirmed by the dominance of the stacked fining-upwards feeder slope channels with some slope mud intercalations in the Sindy-1 and South Qantara-1 wells (Fig. 8a).
6.b. Upper Oligocene
The lower boundary of the upper Oligocene sequence is a major sequence boundary as evidenced by offlapping seismic termination, and it is correlated with the sequence boundary that is described by Kellner et al. (Reference Kellner, El Khawaga, Brink, Brink-Larsen, Hesham, Abu El Saad, Atef, Young and Finlayson2009) and Dolson et al. (Reference Dolson, Boucher, Siok, Heppard, Doré and Vining2005) occurring between the lower and upper Oligocene in the West Nile Delta (28.1Ma, Fig. 16). The eustatic sea-level fall forced both the fluvial feeder channels and the clinoforms across the shelf. The upper Oligocene sequence is characterized by the prograding of early formed shelf-margin deltas.
A low-angle descending shelf-edge trajectory (clinoform 2, Fig. 4b) indicates shelf-margin progradation, implying a falling relative sea level (forced regression, Posamentier et al. Reference Posamentier, Allen, James and Tesson1992; Posamentier & Morris, Reference Posamentier, Morris, Hunt and Gawthorpe2000). The highly irregular toplap seismic reflection terminations are interpreted to be due to fluvial incision of underlying slope ‘foresets’ during successive relative falling sea level. Sediment was sourced through the cannibalization of earlier landward clinoform tops (in addition to the regular hinterland source discharge), removing delta plain facies, and fed to the accreting shelf-margin foresets (see Sydow & Roberts, Reference Sydow and Roberts1994). The concordant, high-amplitude anomalies positioned on the slope (Figs 4b, 5) are interpreted as a series of slope channels-lobe complexes (see Johannessen & Steel, Reference Johannessen and Steel2005).
A flat shelf-edge trajectory style (clinoforms 3 and 4, Fig. 4b) reflects shelf-margin progradation by accretion of successive clinoforms onto the basin with stable relative sea level (highstand systems tract). This is related to optimal delivery of sediment across the shelf that overcomes the created accommodation which led to sand bypass to the outer shelf and shelf edge. That stage is characterized by the re-establishing of the deltaic deposits in Sindy-1 well (Fig. 5). This reflects a basinwards shift of facies and sediment bypass into the slope.
Although the sequence boundaries of the Oligocene succession are difficult to trace in the middle to outer palaeoslope (northern part of the study area), the Oligocene succession can be subdivided based on the architectural trends and evolution of slope deposits. During deposition of the lower package, the western axial and eastern lateral systems are characterized mainly by NW to WNW leveed channels in a largely unconfined bathymetric setting and E/ESE leveed channels in the backlimb of a fold or fault in a confined bathymetric setting, respectively. During deposition of the upper package, the western system is dominated by N to NE leveed channels, while the eastern system is dominated by frontal splays and lobes. The dominance of frontal splays and lobes in the upper package probably reflects a change in flow parameters such as sand-to-mud ratio and staging area as well as slope physiography.
The understanding of architecture and evolution of the Oligocene shelf-edge deltas as well as the role of factors that controlled their formation will provide good clues to understand the giant reservoirs in the offshore Nile Delta that represent the distal extension of the Oligocene succession in the onshore Nile Delta. The Oligocene lowstand and highstand events are important in the emerging giant field trends in the deep Miocene and Oligocene in the offshore Nile Delta and Levant Basin (Dolson et al. Reference Dolson, Atta, Blanchard, Sehim, Villinski, Loutit, Romine, Marlow, Kendall and Yose2014). It also represents a good documentation of shelf-edge deltas that formed in similar tectonic regimes such as the Matruh (NW Egypt, Krois et al. Reference Krois, Hannke, Novotny, Bayoumi, Hussein and Tari2010), Levant and Cyprus basins in the East Mediterranean (Bowman, Reference Bowman2011; Gardosh & Druckman, Reference Gardosh, Druckman, Robertson and Mounttrakis2006). In the Levant Basin, the Oligocene succession is turbiditic in origin and occurs as a canyon fill deposit that grades distally into stacked channels and a basin floor fan (Gardosh & Druckman, Reference Gardosh, Druckman, Robertson and Mounttrakis2006). The Cyprus Basin in offshore Syria contains up to 2900m of Oligocene and Neogene sediments that are similar to that of the Levant Basin (Bowman, Reference Bowman2011). This study also introduces a good example of the evolution and architecture of shelf-edge deltas formed in passive continental margins such as in West Africa and the Gulf of Mexico.
7. Implications for reservoir geology
The Oligocene shelf-edge deltas of the onshore East Nile Delta show a variety of depositional elements especially in the deepwater as leveed-channel complexes, and frontal and crevasse splays in the axial system in addition to leveed channels and lobes of the lateral ponded system. Although we have limited borehole calibration for the examples shown, we infer sand presence on the basis of seismic reflection amplitude, continuity and geometry as well as limited well data.
In the leveed-channel system, there is potential for stratigraphic trapping and compartmentalization of reservoir units. This can occur both within levee walls, where levee deposits would be sealed by mud-prone passive channel fill deposits, and within channel fill deposits, where channel sands would be juxtaposed against previously deposited mud-prone substrates (Fig. 11a).
The channel fill is characterized primarily by high-amplitude seismic reflections and is interpreted to be sand-rich. The areal extent, distribution of these sand-prone deposits and their reservoir architecture are dependent to some degree on the extent of channel sinuosity. Straight to sinuous channel fill deposits are preserved as narrow ribbons of reservoir facies. Reservoir facies in these channel systems can, however, be vertically stacked (Figs 9, 10a–c). In contrast, channel fill deposits associated with meander-loop migration produce a swath or fairway of reservoir facies commonly several times the width of a single channel that are not common in the study area.
On the basis of seismic character, the frontal splays and lobes can constitute significant exploration targets. Reservoir prone beds show areal distribution and continuity as much as an order of magnitude higher than associated up-system leveed-channel deposits. The frontal splays and lobes complex shows excellent lateral reservoir continuity and extensive areal coverage, with lengths and widths greater than 2km (Fig. 12j). Because of the presence of numerous small distributive channels that can be characterized by extensive lateral shifts, these deposits are commonly characterized by a sheet-like architecture (Figs 11d, 12g–j), likely showing moderate to good fluid communication between reservoir prone beds (see Hackbarth & Shaw, Reference Hackbarth, Shaw, Weimer, Bouma and Perkins1994; Mahaffie, Reference Mahaffie, Weimer, Bouma and Perkins1994; Chapin, Tiller & Mahaffie, Reference Chapin, Tiller and Mahaffie1996; Booth et al. Reference Booth, Duvernay, Pfeiffer, Styzen, Weimer, Slatt, Coleman, Rosen, Nelson, Bouma, Styzen and Lawrence2000). This is especially true just behind the transition from the leveed channel to the splay complexes (transition point) where the channels tend to amalgamate in sheet-like sand-rich deposits (Fig. 12j). They thin away from the associated levee crevasses (Winker & Booth, Reference Winker, Booth, Weimer, Slatt, Coleman, Rosen, Nelson, Bouma, Styzen and Lawrence2000). The distal edge of the splay complex is compartmentalized by widespread pelagic/hemipelagic and prodelta/slope shales (see Twichell et al. Reference Twichell, Kenyon, Parson, McGregor, Weimer and Link1991, Reference Twichell, Schwab, Nelson, Kenyon and Lee1992; Winker & Booth, Reference Winker, Booth, Weimer, Slatt, Coleman, Rosen, Nelson, Bouma, Styzen and Lawrence2000). Moreover, there is an overall decrease in sediment grain size from the apex to the distal extremities of the frontal splays. The coalescing of the frontal splays can produce extensive sheet-like sands of more than 10km in width and 15km in length (Fig. 12j). These sheets have good lateral reservoir continuity. A similar situation is found in the turbidite lobes of the ESE-trending intraslope ponded sub-basin (Fig. 12i, j). In the ponded system, the coarse-grained sediments are trapped by the E–W-trending structural corridors and sealed with interbedded fine-grained overbank or hemipelagic/prodelta sediments. In general, the understanding of slope physiography and sediment distribution in both the axial and lateral systems represents the critical element that can affect exploration strategy.
8. Conclusions
The present paper is a synthesis of the facies architecture, regional stratigraphic relationships, shelf-edge trajectories and evolution of the Oligocene shelf-edge deltas of the onshore East Nile Delta Basin in order to evaluate the nature and evolution of Oligocene reservoir stratigraphic patterns for future prospecting. 3D/2D seismic and well datasets were used to study the evolution of the Oligocene sequences.
The Oligocene system represents a prograding shelf-edge delta system fed by deepwater slope channels and lobes with complex structures (Fig. 5). The Oligocene progradational margin is characterized by a thick sediment prism that is composed of a composite stack of clinoforms both in the shelf and shelf-margin deltas. The Oligocene system includes two main lower and upper Oligocene cycles (sequences) separated by a mid Oligocene sequence boundary. The lower Oligocene sequence is characterized by two stages. (1) The basal Oligocene deeply incised canyon initiated by the oversteepened shelf edge, enhanced by development of a basal Oligocene unconformity as the sea level fell (Fig. 15a). As relative sea level rose, the basal Oligocene canyon was being filled with a complex stacked channel system. Sediments were preferentially stored within the canyon and did not extend further basinwards, thereby smoothing the incised topography (Fig. 15b). (2) Formation of shelf deltas as a result of significant rise of relative sea level coupled with continued significant sediment supply during transgressive phases. This was followed by a sediment supply increase relative to sea-level rise, and the shelf deltas prograde until they reach the shelf edge. The shelf-edge deltas prograde in the early stage with an ascending shelf-edge trajectory (clinoforms 1, Fig. 4b), indicating relative sea-level rise at the shelf edge. This is associated with an upward and basinward shift of the shelf edge due to the sea-level rise coupled with a huge amount of sediment being brought to the shelf margin, feeding the slope channels. These are documented by the stacked fining-upward cycles in the Sindy-1 and South Qantara-1 wells (Fig. 8a).
The upper Oligocene sequence is characterized by the prograding of the shelf-edge deltas with two successive shelf-edge trajectories. The descending shelf-edge trajectory occurs when the relative sea level is falling at the shelf edge (Fig. 15c) and, in the case of sufficient sediment supply; the shelf edge was translated downwards and seawards during the relative sea-level fall. In dip section, the descending shelf-edge trajectory appears as a clinoform wedge that thickens towards the shelf edge (up to 200m) before thinning seawards. Key facies of the descending trajectory are steeply inclined clinoforms with turbidite prone slope sediments (Fig. 4b, clinoform 2). This phase begins with a major drop in global sea level and formation of a sequence boundary (28.1Ma). The forced regression was followed by relative sea-level rise with optimal delivery of sediment across the shelf, eventually allowing fluvial channel systems to have direct access to the deepwater slope beyond the shelf edge (Fig. 15d, e). The sediment supply overcomes the created accommodation and causes the formation of a flat shelf-edge trajectory (Fig. 4b, clinoforms 3 and 4).
The Oligocene shelf-edge deltas have coeval gullies and submarine slope deposits in front of them. The slope sediments include feeder channels, channel-levee complexes, crevasse and frontal splays, and lobes. The feeder channels fed leveed-channel complexes and show downslope progradation, lateral migration and vertical aggradation. The leeved channels are subdivided into western axial and eastern lateral systems (Fig. 12a). The axial channel complex diverted basinwards in a N and NE direction and laterally switched to a NW and WNW direction and returned to N and NE direction at the top of the Oligocene. The eastern lateral system is characterized by the formation of a ponded intraslope stepped sub-basin along the slope. This sub-basin is filled with lateral E- and ESE-trending leveed sinuous channels grading upwards into lobes. The intraslope sub-basin was probably formed owing to the rejuvenation of Mesozoic E–W-trending faults or Cretaceous inverted structures. Also, the lateral switching of the leveed-channel system reflects the growth of structures such as the NW-trending transfer faults or shale diapirs in the northwestern part of the study area. The slope physiography was most probably controlled by the initiation and reactivation of E–W-trending and NW-trending faults and NE–SW-trending inverted structures, which led to a complex pattern of the slope sediment distribution (i.e. the tectonic control). The scenarios of the Oligocene architectures and evolution will help in predicting reservoir lithofacies and provide the identification of potential hydrocarbon play types, especially deepwater depositional settings.
Acknowledgements
The author thanks the Egyptian General Petroleum Corporation (EGPC) and Melrose, Dana gas Egypt oil companies for providing the well data, cuttings and seismic data. Special thanks to Samy Ahmed (BP-Egypt) for biostratigraphic description and biozonation of the studied wells. Prof. M. Darwish and Prof. A. ElManawi (Cairo University) are thanked for valuable discussion. Prof. William Fisher (University of Texas at Austin) and Prof. Nat Rutter (University of Alberta) are thanked for editing and reviewing the manuscript. The referees are thanked for their valuable comments that improved the manuscript. Prof. Schieber Juergen (editor) is also acknowledged for providing valuable advice on the manuscript.


