1. Introduction
The Central China Orogenic Belt (CCOB), comprising from west to east the Kunlun, Qilian and Qinling–Dabie Mountains, is a critical zone that separates the northern and southern China continent (Ames, Gaozhi & Baocheng, Reference Ames, Gaozhi and Baocheng1996; Rowley et al. Reference Rowley, Xue, Tucker, Peng, Baker and Davis1997; Hacker et al. Reference Hacker, Ratschbacher, Webb, Ireland, Walker and Dong1998; Xiong et al. Reference Xiong, Ma, Jiang and Zhang2016). As part of the CCOB, the Qinling–Dabie Orogenic Belt (QDOB), which is a collision product of the North China Craton (NCC) and South China Block (SCB), provides important information about the tectonic evolution of the Eastern Asian Continent (Mattauer et al. Reference Mattauer, Matte, Malavieille, Tapponnier, Maluski, Qin, Lun and Qin1985; Şengör, Reference Şengör1985; Ames, Gaozhi & Baocheng, Reference Ames, Gaozhi and Baocheng1996; Rowley et al. Reference Rowley, Xue, Tucker, Peng, Baker and Davis1997; Hacker et al. Reference Hacker, Ratschbacher, Webb, Ireland, Walker and Dong1998; Ratschbacher et al. Reference Ratschbacher, Hacker, Webb, McWilliams, Ireland, Dong, Calvert, Chateigner and Wenk2000; Hu et al. Reference Hu, Kohn, Raza, Wang and Gleadow2006a ; Dong et al. Reference Dong, Genser, Neubauer, Zhang, Liu, Yang and Heberer2011a ; Zhao et al. Reference Zhao, Jiang, Dai, Ma and Li2015; Dong & Santosh, Reference Dong and Santosh2016; Wu, Xiao & Ma, Reference Wu, Xiao and Ma2016). Most previous studies focus on two aspects: (1) the continental deep subduction and exhumation process through the ultrahigh-pressure (UHP) metamorphic belt (Ames, Gaozhi & Baocheng, Reference Ames, Gaozhi and Baocheng1996; Hacker et al. Reference Hacker, Ratschbacher, Webb, McWilliams, Ireland, Calvert, Dong, Wenk and Chateigner2000; Faure et al. Reference Faure, Lin, Monié, Breton, Poussineau, Panis and Deloule2003; Hu et al. Reference Hu, Raza, Min, Kohn, Reiners, Ketcham, Wang and Gleadow2006b; Bader et al. Reference Bader, Franz, Ratschbacher, Capitani, Webb, Yang, Pfänder, Hofmann and Linnemann2013a , Reference Bader, Ratschbacher, Franz, Yang, Hofmann, Linnemann and Yuan2013 b); and (2) the dynamic mechanism of the Triassic collision between the NCC and SCB (Kröner, Zhang & Sun, Reference Kröner, Zhang and Sun1993; Li et al. Reference Li, Xiao, Liou, Chen, Ge, Zhang, Sun, Cong, Zhang and Hart1993; Okay, Şengör & Satir, Reference Okay, Şengör and Satir1993; Ratschbacher et al. Reference Ratschbacher, Franz, Enkelmann, Jonckheere, Pörschke, Hacker, Dong and Zhang2006; Dong et al. Reference Dong, Liu, Zhang, Chen, Zhang, Li and Yang2012). Earlier studies have generally revealed the geological evolution history of the South Qinling and its affiliation with the break-up of the supercontinent Rodinia (Ling et al. Reference Ling, Duan, Liu, Cheng, Mao, Peng and Liu2008, Reference Ling, Duan, Liu, Cheng, Mao, Peng, Liu, Yang and Ren2010; Bader et al. Reference Bader, Franz, Ratschbacher, Capitani, Webb, Yang, Pfänder, Hofmann and Linnemann2013a ; Yang et al. Reference Yang, Ratschbacher, Jonckheere, Enkelmann, Dong, Shen, Wiesinger and Zhang2013). However, issues including the post-collision evolution process and the timing and amount of exhumation processes are still not clear. Moreover, there is still controversy about the geodynamics of tectonic reactivation and topographic adjustment after the Cretaceous. These scenarios comprise (1) back-arc extension triggered by the subduction of the Pacific plate (Zhou & Li, Reference Zhou and Li2000; Wu et al. Reference Wu, Lin, Wilde, Zhang and Yang2005; Li & Li, Reference Li and Li2007; Li et al. Reference Li, Li, Wang, Li, Liu, Tang, Gao and Wu2010); (2) a far-field effect of the India–Eurasia collision (Tapponnier et al. Reference Tapponnier, Zhiqin, Roger, Meyer, Arnaud, Wittlinger and Jingsui2001; Enkelmann et al. Reference Enkelmann, Ratschbacher, Jonckheere, Nestler, Fleischer, Gloaguen, Hacker, Zhang and Ma2006; Ratschbacher et al. Reference Ratschbacher, Franz, Enkelmann, Jonckheere, Pörschke, Hacker, Dong and Zhang2006; Grave, Buslov & Haute, Reference Grave, Buslov and Haute2007; Grave et al. Reference Grave, Glorie, Buslov, Stockli, Mcwilliams, Batalev and Haute2013); and (3) the changing erosion rate, affected by climate since the Miocene (An et al. Reference An, Kutzbach, Prell and Porter2001; Guo et al. Reference Guo, Ruddiman, Hao, Wu, Qiao, Zhu, Peng, Wei, Yuan and Liu2002; Clift et al. Reference Clift, Hodges, Heslop, Hannigan, Long and Calves2008; Allen & Armstrong, Reference Allen and Armstrong2012).
In this study, we integrate previous geochronology data and our new apatite fission-track (AFT) ages of the Wudang Complex to reconstruct regional thermal history (from break-up, sedimentation, collision, reactivation and cooling to exhumation). These results will help us (1) understand the tectonic–thermal events and related cooling/exhumation processes, and (2) address questions pertinent to the role of Pacific subduction and India–Asia collision in the tectonics of the Yangtze Craton.
2. Geological setting
The Qinling–Dabie Orogenic Belt (QDOB) is a ~2000 km long E–W elongated intra-continental orogeny, connected respectively with Kunlun and Qilian orogeny to the west and eastern China to the east through the Tanlu fault belt (Fig. 1a). The QDOB developed by the collision between the NCC and SCB in the Triassic. Controlled by the palaeo-Pacific subduction since the Cretaceous and the far-field effects of the India–Asia collision at ~50 Ma (Tapponnier et al. Reference Tapponnier, Zhiqin, Roger, Meyer, Arnaud, Wittlinger and Jingsui2001; Enkelmann et al. Reference Enkelmann, Ratschbacher, Jonckheere, Nestler, Fleischer, Gloaguen, Hacker, Zhang and Ma2006; Sharp & Clague, Reference Sharp and Clague2006), the QDOB showed intra-continental reactivation throughout the Jurassic to Cenozoic (e.g. Zhang, Vergely & Mercier, Reference Zhang, Vergely and Mercier1995; Ratschbacher et al. Reference Ratschbacher, Hacker, Calvert, Webb, Grimmer, McWilliams, Ireland, Dong, Hu and Calvert2003; Dong et al. Reference Dong, Genser, Neubauer, Zhang, Liu, Yang and Heberer2011a ; Dong & Santosh, Reference Dong and Santosh2016).

Figure 1. (a) Location of the Qinling–Dabie Orogenic Belt (QDOB), between the North China Craton and Yangtze Craton. (b) Relationships between the Wudang Terrain and adjacent tectonic units (modified from Ling et al. Reference Ling, Duan, Liu, Cheng, Mao, Peng, Liu, Yang and Ren2010). (c) Simplified geological map of the Wudang area modified from Yue, Deng & Bagas (Reference Yue, Deng and Bagas2014) and sample locations. F1: Shiyan fault. (d) Sketch map of tectonic profiles A–B.
The South Qinling is located between the North Qinling and the northern margin of the SCB (Fig. 1b; Ling et al. Reference Ling, Duan, Liu, Cheng, Mao, Peng, Liu, Yang and Ren2010; Dong & Santosh, Reference Dong and Santosh2016). The Wudang terrain is located in the eastern margin of the South Qinling and the western margin of the Nanyang basin that divided the Qinling and Dabie orogenic belt. The Wudang Complex mainly consists of the Neoproterozoic Wudang Group that is unconformity surrounded by the early Neoproterozoic Yaolinghe Group and the Sinian to Phanerozoic sedimentary units (Fig. 2; Ling et al. Reference Ling, Duan, Liu, Cheng, Mao, Peng and Liu2008; Yue, Deng & Bagas, Reference Yue, Deng and Bagas2014).

Figure 2. Stratigraphic columns of the Wudang Complex and its adjacent areas (modified from Dong & Santosh, Reference Dong and Santosh2016). No vertical scale.
The Wudang Group is the largest Precambrian suite (~8000 km2) in the South Qinling and comprises metamorphic volcanic–sedimentary assemblages in greenschist facies, which is subdivided into the Yaoping, Yangping and Shuangtai Formations. This volcanic event may be attributed to the rift-setting according to their bimodal composition (Ling et al. Reference Ling, Duan, Liu, Cheng, Mao, Peng and Liu2008, Reference Ling, Duan, Liu, Cheng, Mao, Peng, Liu, Yang and Ren2010; Xia et al. Reference Xia, Xia, Xiang-Min, Zhong-Ping and Xue-Yi2008; Li et al. Reference Li, Li, Wang, Li, Liu, Tang, Gao and Wu2010). Their geochemical features also suggest this volcanic suite is subduction-related magmatism. Zircon U–Pb dating on the basic volcanic rocks for metarhyolite tuff indicates it formed at ~755 Ma (Table 1; Ling et al. Reference Ling, Duan, Liu, Cheng, Mao, Peng and Liu2008), and the laser ablation inductively coupled mass spectrometry (LA-ICP-MS) U–Pb zircon age of meta-acidic volcanic rocks was 668–680 Ma (Y. Zhang et al. Reference Zhang, Miao, Zhang, Lu, Zhang, Chen, Li, Miao, Feng and Ou2013). The youngest detrital zircon U–Pb age (763 ± 33 Ma) of Shuangtai Formations indicates the timing of the Wudangshan volcanism (Ling et al. Reference Ling, Duan, Liu, Cheng, Mao, Peng and Liu2008, Reference Ling, Duan, Liu, Cheng, Mao, Peng, Liu, Yang and Ren2010). The 40Ar–39Ar ages for hornblende and muscovite are 236.6 ± 0.6 and 231.1 ± 0.9 Ma respectively (Ratschbacher et al. Reference Ratschbacher, Hacker, Calvert, Webb, Grimmer, McWilliams, Ireland, Dong, Hu and Calvert2003), which likely corresponds to the peak metamorphism timing. The Yaolinghe Group contains greenschist facies metamorphosed quartz–keratophyre tuff and pebbly tuff (Zhang et al. Reference Zhang, Zhang, Tang and Wang2002) and its basaltic volcanisms were dated at c. 685 Ma with minor acidic volcanic rocks at c. 632 Ma (Cai et al. Reference Cai, Xiong, Hong, Dekuang, Sun and Rao2007; Ling et al. Reference Ling, Duan, Liu, Cheng, Mao, Peng and Liu2008). The widespread doleritic–gabbroic mafic sills emplaced into the Wudang and Yaolinghe Group dated at 679.0 ± 3.1 Ma (Ling et al. Reference Ling, Duan, Liu, Cheng, Mao, Peng and Liu2008).
Table 1. Compilation of isotopic ages in the Wudang area

Note: TIMS: thermal ionization mass spectrometry.
3. Samples and methodology
Seven epimetamorphic sandstone samples were collected from the Wudang Group metamorphic rocks. Sample locations are shown in Figure 1c and elevations are determined by GPS (Table 2). The apatite fractions were separated from the rocks using conventional density and magnetic separation techniques after crushing and sieving. The apatites are divided into two separates, one used for age dating (age group) and the other for confined track-length measurements (length group) (Jonckheere, Ratschbacher & Wagner, Reference Jonckheere, Ratschbacher and Wagner2003; Jonckheere et al. Reference Jonckheere, Enkelmann, Min, Trautmann and Ratschbacher2007). All samples were selected for age dating (age group), and five of them (W1, W3, W5, W6 and WD2A) were used for confined track-length measurements. Apatite grains were mounted in epoxy resin, ground, and polished to expose smooth flat internal surfaces. The fission-track analysis was performed at Bergakademie Freiberg following the methods detailed in Shen et al. (Reference Shen, Mei, Min, Jonckheere, Ratschbacher, Yang, Peng and Liu2012) and Yang et al. (Reference Yang, Ratschbacher, Jonckheere, Enkelmann, Dong, Shen, Wiesinger and Zhang2013).
Table 2. Results of fission-track analysis of apatite from the Wudang Complex

Note: Grains: number of measured grains; Ns: number of spontaneous tracks; Ni: number of induced tracks; ζ: ζ calibration factor; ρd: track density in standard uranium glass; P(χ2): chi-square probability; t-age: fission track age, using pooled ages; 1σ: standard error; M-L: mean track length; S.D.: standard deviation; M-Lc: mean track length after c-axis correction; nL: number of measured confined tracks; Dpar: mean etch pit diameter; Ptw: Proterozoic Wudang Group; –: no data
The age-group apatites were etched in 4.0M HNO3 for 15 s at 25 °C and the muscovite external detectors in 40 % HF for 30 min at room temperature. We used prismatic sections of Durango standard apatite to ensure that tracks are counted in the same facies in the standards and unknowns (Jonckheere et al. Reference Jonckheere, Enkelmann, Min, Trautmann and Ratschbacher2007). Ages were determined using the ζ-calibration approach (Hurford & Green, Reference Hurford and Green1983; Table 2) from a uranium-glass IRMM540R monitor. The zeta values stem from independent calibrations by counting several Durango and Fish Canyon Tuff apatite age standards (Table 2). Track counting was performed on a prismatic apatite surface with a Zeiss Axioplan microscope at magnification of 625 in transmitted light. The muscovite external detector was repositioned, trackside down, on the apatite mounts in the same position as during irradiation. Fossil tracks were counted by focusing on the underside of the external detector without moving the microscope stage (Jonckheere, Ratschbacher & Wagner, Reference Jonckheere, Ratschbacher and Wagner2003). Where possible, at least 20 crystals of each sample were counted for age determination. The length group apatite was etched for 20 s at 21 °C in 5.5M HNO3 (Donelick, Ketcham & Carlson, Reference Donelick, Ketcham and Carlson1999). Track-length measurements were performed at a magnification of 1250 using the Zeiss Axioplan microscope equipped with the Autoscan system; all suitable confined tracks parallel to the prismatic surfaces were measured. Separate mounts for track-length measurements were irradiated with heavy ions at the GSI Helmholtz Centre for Heavy Ion Research, Darmstadt (Germany), to increase the number of etchable confined fission tracks (Jonckheere et al. Reference Jonckheere, Enkelmann, Min, Trautmann and Ratschbacher2007).
4. Results and discussion
4.a. Results and thermal history modelling
The AFT results of seven samples are shown in Table 2; the pooled ages (with 1σ) vary from 76.0 ± 9.0 to 103.7 ± 10.7 Ma with P(χ2 ) > 0.05; mean track lengths range from 10.6 ± 0.1 to 11.6 ± 0.1 μm, and mean track length (μm) after c-axis correction spans 12.9 ± 0.1 to 13.6 ± 0.1 μm (Fig. 3). The Dpar (c-axis parallel etch pit diameter) values (Donelick, Reference Donelick1993; Donelick, Ketcham & Carlson, Reference Donelick, Ketcham and Carlson1999) vary between 2.0 ± 0.3 and 2.5 ± 0.4 μm, which is larger than Durango apatite (1.5–1.9 μm) (McDowell, Mcintosh & Farley, Reference McDowell, McIntosh and Farley2005), indicating our samples have higher resistance to thermal annealing (Donelick, O'Sullivan & Ketcham, Reference Donelick, O'Sullivan and Ketcham2005; Glorie et al. Reference Glorie, Grave, Buslov, Elburg, Stockli, Gerdes and Haute2010).

Figure 3. Mean track length (left) and that after c-axis correction (right) (μm) vs apatite fission-track age of the Wudang Complex.
The AFT age–elevation relationship suggests a relatively slow exhumation rate of c. 0.027 mm a−1 from c. 110 to 80 Ma for elevations below 800 m (Fig. 4). However, sample WD2A which has the youngest ages and the highest elevation, may be affected by the Shiyan fault zone (Fig. 1c). As this fault cut through the Wudang Complex and activated mainly in the Tertiary (Huang, Reference Huang1993), the apparent age of sample WD2A, located in the hanging wall of the Shiyan fault zone, may be younger. The mean track lengths before c-axis correction decrease from 11.6 to 10.6 μm over a narrow age span (89.0–76.9 Ma), implying that the cooling rate decreased after c. 90 Ma (Fig. 3).

Figure 4. AFT age–elevation relationship in the Wudang area.
The analytic results by Track Age Spectrum Calculation (TASC; Belton & Raab, Reference Belton and Raab2010) could reveal the onset age of cooling. According to annealing characteristics and thermal information recorded on the apatite, the track age spectra of samples W1, W3, W5 and W6 (Fig. 5) indicate that the maximum cooling onset ages are 126 ± 10 Ma, 124 ± 7 Ma, 117 ± 9 Ma and 120 ± 8 Ma respectively. These similar ages indicate the initial time when apatite entering the partial annealing zone (PAZ) occurred at ~126 Ma.

Figure 5. Onset ages of apatite cooling analysed by Track Age Spectrum Calculation (TASC; Belton & Raab, Reference Belton and Raab2010).
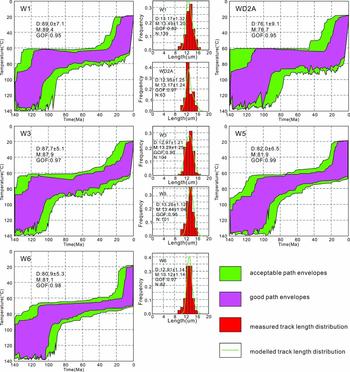
The thermal histories (T[t]-paths) of five samples (Fig. 6) were derived through inverse Monte Carlo modelling using the HeFTy software (version 1.8.2; Ketcham, Reference Ketcham2005; Ketcham et al. Reference Ketcham, Balestrieri, Zattin and Donelick2009) and employing Ketcham, Donelick & Carlson's (Reference Ketcham, Donelick and Carlson1999) annealing model and the c-axis projection of Donelick, Ketcham & Carlson (Reference Donelick, Ketcham and Carlson1999). The initial mean track length of L 0 = 16.0 ± 0.8 μm (Shen et al. Reference Shen, Mei, Min, Jonckheere, Ratschbacher, Yang, Peng and Liu2012) was determined from measurements of induced confined tracks in Durango apatite standards. Measured Dpar values were applied to account for the variation of track length. The Kolmogorov–Smirnov test (GOF) was used to assess the goodness of fit between the modelled and measured results, with thresholds of 0.50 and 0.05 for good and acceptable fits (Ketcham, Reference Ketcham2005). In this work, the monotonic path setting was used to allow for both cooling and heating histories. Allowing the samples to cool above the closure temperature of AFT to simulate uncertainty in the initial thermal history, we take 140 °C as the initial constraint. The second constraint is the surface temperature, which we take as 20 °C at 0 Ma. Meantime, at least 500 good paths were modelled for each sample. The inversion modelling results indicate that the samples entered the apatite PAZ rapidly between 126 and 90 Ma, and there then followed a prolonged period with cooling rates <0.5 °C Ma−1 residing in the apatite PAZ (Donelick, O'Sullivan & Ketcham, Reference Donelick, O'Sullivan and Ketcham2005); accelerated cooling has occurred at an average cooling rate of ~3 °C Ma−1 since c. 15 Ma.

Figure 6. Low-temperature thermal history and confined track-length distribution modelling by the HeFTy 1.8.2 software (Ketcham, Reference Ketcham2005; Ketcham et al. Reference Ketcham, Balestrieri, Zattin and Donelick2009) based on AFT data. D, determined apatite fission-track age (in Ma with 1σ error) and mean confined track length (in μm with standard deviation). M, modeled apatite fission-track age and mean confined track length. N, number of measured confined track lengths. GOF is the Kolmogorov–Smirnov test, assessing the fit between the modelled and measured results, with thresholds of 0.05 and 0.50 for good and acceptable fits (Ketcham, Reference Ketcham2005).
4.b. The cooling/exhumation history reconstruction
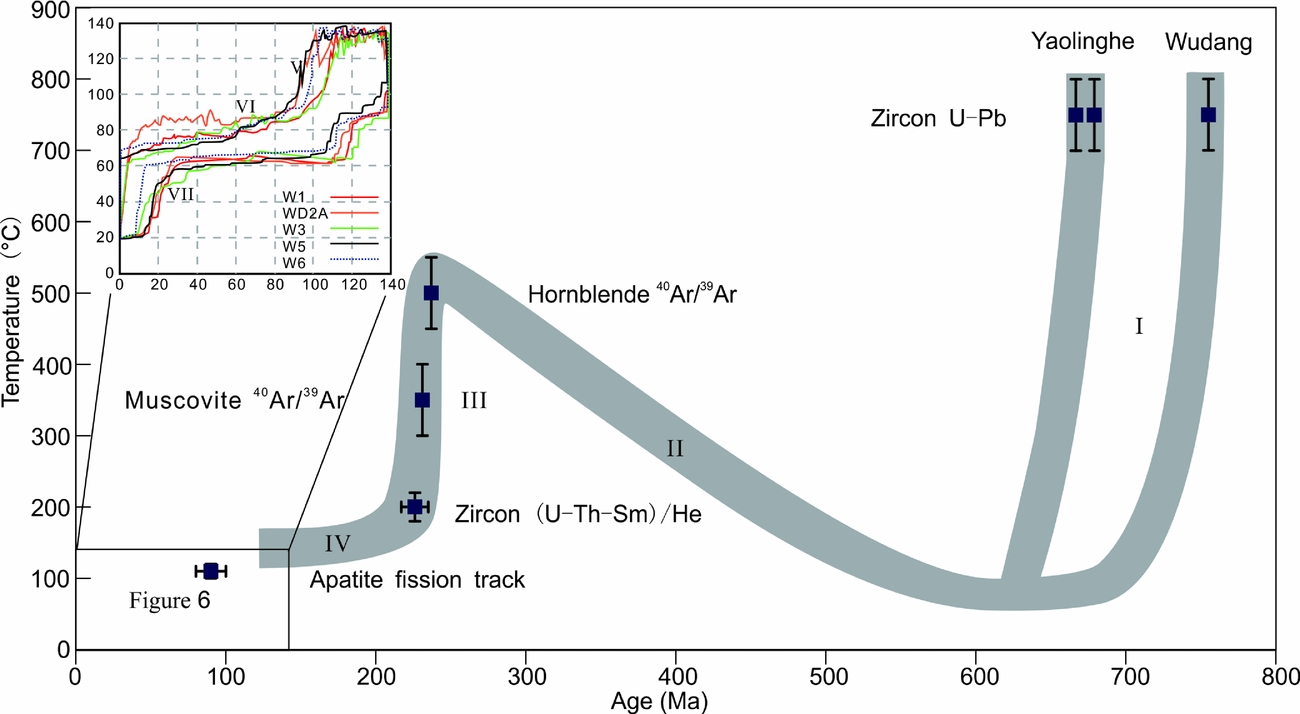
According to distinct closure temperatures of different minerals, the multiple geochronometers allow us to reconstruct the thermal history of a rock unit (e.g. Glorie et al. Reference Glorie, Grave, Buslov, Elburg, Stockli, Gerdes and Haute2010; Dong et al. Reference Dong, Zhang, Neubauer, Liu, Genser and Hauzenberger2011b ; Shen et al. Reference Shen, Mei, Min, Jonckheere, Ratschbacher, Yang, Peng and Liu2012). Figure 7 shows age vs closure temperature plots, illustrating the multi-stage cooling/exhumation process of the Wudangshan Complex. The zircon U–Pb, hornblende 40Ar–39Ar, muscovite 40Ar–39Ar and ZHe (zircon (U–Th/He) data were used to constrain the cooling process under medium-high temperature (>200 °C). The T[t]-paths based on the AFT data (Fig. 6) were used to reveal the cooling procedure at low temperature (<120 °C). Integrating all these data (Table 1), the thermal history of the Wudangshan Complex can be divided into seven stages: (1) Stage I – the temperature decreased from the closure temperature (700–800 °C; Cherniak & Watson, Reference Cherniak and Watson2003) of the U–Pb zircon system to the surface condition (~20 °C) from c. 755 to c. 632 Ma at a fast cooling rate of c. 5.7 °C Ma−1. (2) Stage II – the temperature rose rapidly to the hornblende 40Ar–39Ar system (450–550 °C; McDougall & Harrison Reference McDougall and Harrison1999) from c. 632 Ma to c. 237 Ma. (3) Stage III – the volcanic rocks are recorded as cooling through temperatures of the ZHe system (180–220 °C; Reiners et al. Reference Reiners, Spell, Nicolescu and Zanetti2004) between c. 237 and c. 220 Ma at a rate of c. 17.6 °C Ma−1 which means that exhumation rate may reach 0.4 km Ma−1. (4) Stage IV – from the ZHe system (180–220 °C) to the closure temperature (~120 °C) of AFT (Ketcham, Donelick & Carlson, Reference Ketcham, Donelick and Carlson1999) between c. 220 and c. 126 Ma at a decreasing cooling rate of c. 0.8 °C Ma−1. (5) Stage V – the sample cooled through the apatite PAZ from 126 to 90 Ma at a rate of c. 1.5 °C Ma−1. (6) Stage VI – the slowest cooling stage according to the thermal modelling results (Fig. 6) occurred from c. 90 to c. 15 Ma at an insignificant speed. (7) Stage VII – a final accelerated cooling to the surface temperature (20 °C) occurred from c. 15 Ma to the present at a rate of c. 3 °C Ma−1, corresponding to an exhumation rate of c. 0.1–0.15 km Ma−1.

4.c. Geodynamic interpretations
The thermal history of the Wudang Complex recorded by the thermochronological data is related to the geodynamic setting and tectonic evolution of the South Qinling orogenic belt. The volcanic suite of the Wudang Group was formed at c. 755 Ma dating by the zircon U–Pb method (Ling et al. Reference Ling, Duan, Liu, Cheng, Mao, Peng and Liu2008, Reference Ling, Duan, Liu, Cheng, Mao, Peng, Liu, Yang and Ren2010), and this rift-related igneous event indicated a complete separation of the South China Block and a break-up of the supercontinent Rodinia (Ling et al. Reference Ling, Duan, Liu, Cheng, Mao, Peng and Liu2008, Reference Ling, Duan, Liu, Cheng, Mao, Peng, Liu, Yang and Ren2010; Xia et al. Reference Xia, Xia, Xiang-Min, Zhong-Ping and Xue-Yi2008; Bader et al. Reference Bader, Franz, Ratschbacher, Capitani, Webb, Yang, Pfänder, Hofmann and Linnemann2013a ). The weathered unconformity between the Wudang Group and the Yaolinghe Group indicates that the Wudang rocks were exposed at the surface in Neoproterozoic times (Huang, Reference Huang1993). Similarly, the disconformities contact between the Yaolinghe Group and the Sinian carbonate formation indicates that the Yaolinghe volcanic suite had experienced the same cooling event. Therefore, a rapid cooling process (stage I) through heat exchange with the surrounding rock can be assumed from c. 755 Ma to c. 632 Ma. This event was followed by a long-term extension and subsidence process under the passive continental margin setting (stage II), which resulted in >10 km sediments from the end of the Neoproterozoic to the mid-Triassic (Fig. 2; Hu, Reference Hu2004). The rocks of the Wudang Group located at the bottom may experience regional metamorphism due to the deep burial depth.
A rapid decrease occurred in the thermal history (stage III) after a long-time sedimentation (Fig. 7), indicating the collision event between the NCC and SCB with intensive deformation and rapid exhumation. The Triassic orogenic event induced by the subduction of the Yangtze plate under the NCC has significant impacts on the entire Qinling–Dabie Belt, North China Craton and South China Block (Ratschbacher et al. Reference Ratschbacher, Hacker, Calvert, Webb, Grimmer, McWilliams, Ireland, Dong, Hu and Calvert2003, Reference Ratschbacher, Franz, Enkelmann, Jonckheere, Pörschke, Hacker, Dong and Zhang2006; Hu et al. Reference Hu, Kohn, Raza, Wang and Gleadow2006a , Reference Hu, Raza, Min, Kohn, Reiners, Ketcham, Wang and Gleadow2006 b). Many pre-existing shear/fault zones (Lonan, Shangxiang, Shangdan) have been reactivated in the North Qinling between 200 and 240 Ma (Ratschbacher et al. Reference Ratschbacher, Hacker, Calvert, Webb, Grimmer, McWilliams, Ireland, Dong, Hu and Calvert2003). The UHP rocks were formed at ~240 Ma and quickly returned in the Tongbai–Dabie area due to the delamination of the lithospheric mantle (Hu et al. Reference Hu, Raza, Min, Kohn, Reiners, Ketcham, Wang and Gleadow2006b; Zhang, Ma & Holtz, Reference Zhang, Ma and Holtz2010). The Wudang Complex was part of the Yangtze Craton, and the rapid extensional exhumation allowed these greenschist rocks to be exposed on the surface.
The decreasing cooling, at c. 0.8 °C Ma−1, from c. 220 to 126 Ma (stage IV; Fig. 7) clearly reflects a gravitational adjustment after the rapid exhumation during orogeny, which is also in accordance with the slight deformation and sedimentation investigated in the Qinling area from the Jurassic to the Early Cretaceous (Ratschbacher et al. Reference Ratschbacher, Franz, Enkelmann, Jonckheere, Pörschke, Hacker, Dong and Zhang2006). After that, the inversion modelling results according to the AFT data indicate that the samples passed rapidly through the apatite PAZ between 126 Ma and 90 Ma (stage V). Previous studies have already indicated that the late Jurassic – early Cretaceous tectonic-reactivated and magmatism throughout eastern China (e.g. Tongbai–Dabie, Yangtze craton and eastern NCC (Hacker et al. Reference Hacker, Ratschbacher, Webb, Ireland, Walker and Dong1998; Wu et al. Reference Wu, Lin, Wilde, Zhang and Yang2005; Li & Li, Reference Li and Li2007; Chen et al. Reference Chen, Ma, She, Mason, Zhang and Zhang2009; Li et al. Reference Li, Li, Wang, Li, Liu, Tang, Gao and Wu2010; Zhang, Ma & Holtz, Reference Zhang, Ma and Holtz2010; Xie, Mao & Zhao, Reference Xie, Mao and Zhao2011)) were induced by the subduction of the palaeo-Pacific plate (Wu et al. Reference Wu, Lin, Wilde, Zhang and Yang2005; Zhou et al. Reference Zhou, Sun, Shen, Shu and Niu2006; Huang et al. Reference Huang, Li, Dong, Li, Chen, Wang and Yang2007; Chen et al. Reference Chen, Ma, She, Mason, Zhang and Zhang2009; Zhang et al. Reference Zhang, Ma, Liao, Zhang and She2011). Hu et al. (Reference Hu, Raza, Min, Kohn, Reiners, Ketcham, Wang and Gleadow2006b) also related the large-scale transtensional deformation between ~140 and 110 Ma observed in the Tongbai–Dabie region to the subduction of the Pacific Plate. Hence, the Pacific back-arc extension could contribute to entering the apatite PAZ from c. 126 to 90 Ma despite the large distance to the coast.
Stage VI is characterized by very slow cooling or even reheating during the late Cretaceous – Eocene, but local burial in the sedimentary basin and rapid erosion in the edge shoulder occurred (Shen et al. Reference Shen, Mei, Min, Jonckheere, Ratschbacher, Yang, Peng and Liu2012). For example, the Late Cretaceous – Eocene red bed deposition in pull-apart basins occurred in eastern China (e.g. Arne et al. Reference Arne, Worley, Wilson, She, Foster, Zhi, Shu and Dirks1997; Ratschbacher et al. Reference Ratschbacher, Franz, Enkelmann, Jonckheere, Pörschke, Hacker, Dong and Zhang2006) coeval with widespread Cretaceous strike-slip and extensional deformation in eastern Asia (Hacker et al. Reference Hacker, Ratschbacher, Webb, McWilliams, Ireland, Calvert, Dong, Wenk and Chateigner2000; Ratschbacher et al. Reference Ratschbacher, Hacker, Webb, McWilliams, Ireland, Dong, Calvert, Chateigner and Wenk2000, Reference Ratschbacher, Hacker, Calvert, Webb, Grimmer, McWilliams, Ireland, Dong, Hu and Calvert2003; Enkelmann et al. Reference Enkelmann, Ratschbacher, Jonckheere, Nestler, Fleischer, Gloaguen, Hacker, Zhang and Ma2006). This peneplanation stage is widespread from the eastern Tibetan Plateau to eastern China including the Sichuan basin (Richardson et al. Reference Richardson, Densmore, Seward, Fowler, Wipf, Ellis, Yong and Zhang2008; Deng et al. Reference Deng, Liu, Li, Jansa, Liu, Wang and Sun2013; Tian et al. Reference Tian, Kohn, Gleadow and Hu2013, Reference Tian, Kohn, Hu and Gleadow2015), the Yangtze Craton (Hu et al. Reference Hu, Kohn, Raza, Wang and Gleadow2006a ; Shen et al. Reference Shen, Mei, Min, Jonckheere, Ratschbacher, Yang, Peng and Liu2012) and the Qinling–Dabie orogen (Enkelmann et al. Reference Enkelmann, Ratschbacher, Jonckheere, Nestler, Fleischer, Gloaguen, Hacker, Zhang and Ma2006; Hu et al. Reference Hu, Raza, Min, Kohn, Reiners, Ketcham, Wang and Gleadow2006b; Ratschbacher et al. Reference Ratschbacher, Franz, Enkelmann, Jonckheere, Pörschke, Hacker, Dong and Zhang2006; Heberer et al. Reference Heberer, Anzenbacher, Neubauer, Genser, Dong and Dunkl2014). The peneplanation period in the South Qinling region initiated at c. 90 Ma, which is similar to the Hannan–Micang massif (Tian et al. Reference Tian, Kohn, Zhu, Xu, Hu and Gleadow2012; Yang et al. Reference Yang, Ratschbacher, Jonckheere, Enkelmann, Dong, Shen, Wiesinger and Zhang2013) but different from the Sichuan basin (Shen, Mei & Xu, Reference Shen, Mei and Xu2009; Deng et al. Reference Deng, Liu, Li, Jansa, Liu, Wang and Sun2013), the middle-Yangtze craton (Shen et al. Reference Shen, Mei, Peng, Chen, Yang and Hong2011, Reference Shen, Mei, Min, Jonckheere, Ratschbacher, Yang, Peng and Liu2012) and the Dabie orogenic belt (Hu et al. Reference Hu, Raza, Min, Kohn, Reiners, Ketcham, Wang and Gleadow2006b). A regional low-relief landscape across the eastern Tibetan Plateau and much of central China may also have resulted in this thermal stagnation period (Arne et al. Reference Arne, Worley, Wilson, She, Foster, Zhi, Shu and Dirks1997; Kirby et al. Reference Kirby, Reiners, Krol, Whipple, Hodges, Farley, Tang and Chen2002; Ratschbacher et al. Reference Ratschbacher, Hacker, Calvert, Webb, Grimmer, McWilliams, Ireland, Dong, Hu and Calvert2003, Reference Ratschbacher, Franz, Enkelmann, Jonckheere, Pörschke, Hacker, Dong and Zhang2006; Enkelmann et al. Reference Enkelmann, Ratschbacher, Jonckheere, Nestler, Fleischer, Gloaguen, Hacker, Zhang and Ma2006; Deng et al. Reference Deng, Liu, Li, Jansa, Liu, Wang and Sun2013).
The final accelerated cooling since c. 15 Ma (stage VII; Fig. 7) has also been documented (Fig. 8a), in the eastern Tibetan Plateau (Clark et al. Reference Clark, House, Royden, Whipple, Burchfiel, Zhang and Tang2005; Ouimet et al. Reference Ouimet, Whipple, Royden, Reiners, Hodges and Pringle2010), the Longmen Shan (Arne et al. Reference Arne, Worley, Wilson, She, Foster, Zhi, Shu and Dirks1997; Tian et al. Reference Tian, Kohn, Gleadow and Hu2013), the Sichuan Basin (Shen, Mei & Xu, Reference Shen, Mei and Xu2009; Deng et al. Reference Deng, Liu, Li, Jansa, Liu, Wang and Sun2013), the Hannan–Micang massif (Tian et al. Reference Tian, Kohn, Zhu, Xu, Hu and Gleadow2012; Yang et al. Reference Yang, Ratschbacher, Jonckheere, Enkelmann, Dong, Shen, Wiesinger and Zhang2013), the Daba Shan (Z. Zhang et al. Reference Zhang, Miao, Zhang, Lu, Zhang, Chen, Li, Miao, Feng and Ou2013; Yang, Reference Yang2014), the Qinling (Enkelmann et al. Reference Enkelmann, Ratschbacher, Jonckheere, Nestler, Fleischer, Gloaguen, Hacker, Zhang and Ma2006; Hu et al. Reference Hu, Raza, Min, Kohn, Reiners, Ketcham, Wang and Gleadow2006b) and even northern Kyrgyz Tien Shan (Glorie et al. Reference Glorie, Grave, Buslov, Elburg, Stockli, Gerdes and Haute2010; Macaulay et al. Reference Macaulay, Sobel, Mikolaichuk, Kohn and Stuart2014). Most previous studies suggest that this rapid cooling since c. 15 Ma is due to the eastward growth of the Tibetan Plateau after the collision of India and Asia (Tapponnier et al. Reference Tapponnier, Zhiqin, Roger, Meyer, Arnaud, Wittlinger and Jingsui2001; Liu, Cui & Liu, Reference Liu, Cui and Liu2004; Clark et al. Reference Clark, House, Royden, Whipple, Burchfiel, Zhang and Tang2005; Enkelmann et al. Reference Enkelmann, Ratschbacher, Jonckheere, Nestler, Fleischer, Gloaguen, Hacker, Zhang and Ma2006; Tian et al. Reference Tian, Kohn, Zhu, Xu, Hu and Gleadow2012; Macaulay et al. Reference Macaulay, Sobel, Mikolaichuk, Kohn and Stuart2014). The unconformity between Eocene and Neogene in the adjacent basin (Fig. 8c) supports this event. Tada, Zheng & Clift (Reference Tada, Zheng and Clift2016) attributed the uplift of the northern and eastern Tibetan Plateau at c. 15–10 Ma to lower crustal flow, which is due to crustal thickening and northeastward expansion of the partial melting materials (Clark & Royden Reference Clark and Royden2000; Yuan et al. Reference Yuan, Ge, Chen, Li, Wang, Zhang, Zhang, Zheng, Zheng and Craddock2013). However, we also cannot ignore the influence of climate change on the rapid exhumation and landscape adjustment because this exhumation process coincides with the regional climate change in East Asia (Fig. 8b; Allen & Armstrong, Reference Allen and Armstrong2012). Late Cenozoic global cooling and the onset of the Asian monsoon in the early Miocene have been widely cited for Himalayan–Tibet uplift (Guo et al. Reference Guo, Ruddiman, Hao, Wu, Qiao, Zhu, Peng, Wei, Yuan and Liu2002; Clift et al. Reference Clift, Hodges, Heslop, Hannigan, Long and Calves2008; Armstrong & Allen, Reference Armstrong and Allen2011; Allen & Armstrong, Reference Allen and Armstrong2012). The East Asian monsoon climate has been mainly dominated by the widespread East Asian summer monsoon (EASM) since the Miocene, characterized by high moisture levels and heavy summer rainfall (Guo et al. Reference Guo, Sun, Zhang, Peng, Xiao, Ge, Hao, Qiao, Liang and Liu2008; Molnar, Boos & Battisti, Reference Molnar, Boos and Battisti2010). The South Qinling area located in the south of the Chinese loess plateau developed rich river and rainfall that induced rapid erosion. The famous Three Gorges is the consequence of incision by the Yangtze River, and similar river incision also occurred in the central Sichuan Basin and Yangtze River Delta (Kirby et al. Reference Kirby, Reiners, Krol, Whipple, Hodges, Farley, Tang and Chen2002; Richardson et al. Reference Richardson, Densmore, Seward, Fowler, Wipf, Ellis, Yong and Zhang2008; P. Zhang et al. Reference Zhang, Miao, Zhang, Lu, Zhang, Chen, Li, Miao, Feng and Ou2013). Hence, we may not exclude the effect of the Asian monsoon from the Late Miocene to the present on enhanced exhumation/cooling, although as a secondary cause with respect to tectonic activity.

Figure 8. (a) Simplified geological map showing the regional denudation event after c. ~15 Ma. Reference codes are [1] = Clark et al. (Reference Clark, House, Royden, Whipple, Burchfiel, Zhang and Tang2005); [2] = Ouimet et al. (Reference Ouimet, Whipple, Royden, Reiners, Hodges and Pringle2010); [3] = Tian et al. (Reference Tian, Kohn, Gleadow and Hu2013); [4] = Arne et al. (Reference Arne, Worley, Wilson, She, Foster, Zhi, Shu and Dirks1997); [5] = Deng et al. (Reference Deng, Liu, Li, Jansa, Liu, Wang and Sun2013); [6] = Shen, Mei & Xu (Reference Shen, Mei and Xu2009); [7] = Zhang et al. (2006); [8] = Tian et al. (Reference Tian, Kohn, Zhu, Xu, Hu and Gleadow2012); and Yang et al. (Reference Yang, Ratschbacher, Jonckheere, Enkelmann, Dong, Shen, Wiesinger and Zhang2013); [9] =Wang et al. (Reference Wang, Zattin, Li, Song, Peng, Liu and Liu2011); [10] = Enkelmann et al. (Reference Enkelmann, Ratschbacher, Jonckheere, Nestler, Fleischer, Gloaguen, Hacker, Zhang and Ma2006); [11] = Lin et al. (Reference Lin, Chen, Wyrwoll and Cheng2010); and [12] = Liu et al. (2013). (b) Possible geodynamic mechanism of the late-Cenozoic tectonic and climate events. (c) Discontinuity of Lushi basin located in the northeast of the Wudang Terrain between Eocene and Neogene. Location of Lushi basin is shown in Figure 1b.
5. Conclusions
Tectonic evolution of the South Qinling orogenic belt was clarified through joint analysis of previous multiple geochronologic data and our new AFT data from the Wudang Complex. A gravitational adjustment period from c. 220 to 126 Ma occurred after the fierce exhumation in the Triassic due to collision between the NCC and SCB, which was a response to minor tectonism and sedimentation in the Qinling area during Jurassic to Early Cretaceous time. Meantime, the South Qinling area could also be affected by Pacific subduction to induce the apatite cooling through the PAZ from c. 126 to c. 90 Ma. The AFT thermal history modelling indicates the late Cretaceous – Eocene peneplanation stage is characterized by insignificant exhumation, coinciding with the formation of regional low-relief landscape. The widespread late Cenozoic accelerated cooling has taken place since 15 Ma in the South Qinling area. It could be influenced by the eastward growth of the Tibetan Plateau uplift and the Asian monsoon as a combined effect of endogenic and exogenic geological process.
Acknowledgements
This work was supported by the National Natural Science Foundation of China (No. 41372140, 40902038), the Fundamental Research Fund for the Central Universities, China University of Geosciences (Wuhan, No. 201536), the Outstanding Youth Funding of Natural Science Foundation of Hubei Province (No. 2016CFA055) and the Wuhan Science and Technology Project (No. 2016070204010145). We are very grateful to Professor Lothar Ratschbacher, Dr Raymond Jonckheere, Dr Zhao Yang and Dr Bastian Wauschkuhn for their kind help with and discussion of fission-track analysis; Professor Richard Ketcham for providing the HeFTy software; Dr Adam Szulc, Dr Tom Wittenschlaeger and Dr Xiang Ge for polishing the English; and Editor-in-Chief, Professor Allen Mark and three anonymous reviewers for their comments and suggestions. Shen's stay at Freiberg was funded by the China Scholarship Council.