


Introduction
New forage plant cultivars have been introduced into the market, but different species and cultivars require appropriate grazing management strategies since these grasses have distinct morphological characteristics and even qualitative differences in nutritional composition. However, for a forage grass to result in pastures with high nutritional quality, it is necessary for the grass also to have characteristics such as a perennial seasonal pattern, rapid regrowth, lower proportion of stems, tolerance to animal trampling, vigour and nutritional value that meets the requirements of animal performance. The environment to which the plant is exposed (temperature, water, soil fertility) and the management practices adopted also affect the nutritional value of the forage. Different species or cultivars of forage plants have different nutritional values (Brâncio et al., Reference Brâncio, Nascimento, Euclides, Fonseca, Almeida, Macedo and Barbosa2003b), which can influence consumption by animals and their performance (Wilman et al., Reference Wilman, Mtengeti and Mosely1996).
Aruana grass (Megathyrsus maximus (Jacq.) Simon BK and Jacobs SWL or Panicum maximum (Jacq.) cv. Aruana) has been used successfully in sheep production, probably due to the presence of thin stems, great soil cover, good leaf/stem ratio and high persistence under severe grazing, with mass production of 14 000 kg dry matter (DM)/ha/year (Mattos et al., Reference Mattos, Werner, Colozza, Gerdes, Santos and Giacomini2008). This grass regrows rapidly after intense defoliation, attributed to intense basal and aerial tillering, as well as the stability of the tiller population (Carvalho and Giacomini, Reference Carvalho and Giacomini2005, Giacomini et al., Reference Giacomini, Batista, Colozza, Mattos, Gerdes, Otsuk and Werner2014a). The highest animal performance results of grazing on Aruana are due in part to its nutritional quality and forage acceptability. This was observed by Costa et al. (Reference Costa, Bueno, Veríssimo, Cunha, Santos, Oliveira, Spósito Filho and Otsuk2007) and Emerenciano Neto et al. (Reference Emerenciano Neto, Difante, Aguiar, Fernandes, Oliveira and Silva2014), who obtained better performance responses of Santa Ines sheep grazing on Aruana grass in comparison with the cultivars P. maximum (Jacq.) cv. Massai and Bachiarias brizantha cv. Marandu and Piatã.
In turn, Aries grass (M. maximus (Jacq.) Simon BK and Jacobs SWL or P. maximum (Jacq.) cv. Aries) is an apomictic F1 hybrid (LSC2 × Aruana) with morphological and developmental characteristics similar to those of Aruana grass (Vilela, Reference Vilela2018). Therefore, the Aries cultivar may also be an interesting option for sheep production, with mass production of 18 000– 20 000 kg DM/ha/year.
These grasses are promising, but the adoption of the same management strategy for distinct grasses can penalize some cultivars that are not well suited to the management imposed. In this sense, the simple exchange of one cultivar for another of greater potential does not guarantee an increase in productivity if grazing management is not suitable. Thus, grazing management should aim to optimize the accumulation of forage with high nutritional value, so that most growth structures, such as leaves and stems, are harvested at a developmental stage that does not compromise animal performance, and losses by senescence and death are minimized (Costa et al., Reference Costa, Vicente Gianluppi, Bendahan, Braga, Mattos and Costa2009). In this way, when the highest forage accumulation (FA) is obtained, more efficient use of the grazing area results (Hodgson, Reference Hodgson1990). Grazing results depend on growth factors such as light, temperature, precipitation and mineral nutrients, as reported by Lemaire and Chapman (Reference Lemaire, Chapman, Hodgson and Illius1996), who observed that plants are directly influenced by environmental factors as well as the effects of defoliation caused by grazing.
Studies by Fagundes et al. (Reference Fagundes, Silva, Pedreira, Carnevalli, Carvalho, Sbrissia and Pinto2001), Carnevalli et al. (Reference Carnevalli, Da Silva, Bueno, Uebele, Bueno, Hodgson, Silva and Morais2006) and Barbosa et al. (Reference Barbosa, Nascimento, Euclides, Zimmer and Torres Junior2007) have shown that the maximum FA rate of forage is obtained when the light interception (LI) by the forage canopy is 95% (relative to that of tropical grasses). This is in agreement with Pedreira et al. (Reference Pedreira, Pedreira and Silva2007), who evaluated the rotational grazing strategy with Xaraes grass and found that the 95% LI criterion in pre-grazing favours the efficient production of forage and avoids excessive accumulation of stems and dead material.
However, grass management must be in accordance with the conditions of animal handling. In the sheep production systems, it is essential that the height of the forage plant residue be defined, both for pasture maintenance and to minimize infestation by parasitic gastrointestinal larvae in the pasture, the main sanitary problem. Vlassoff (Reference Vlassoff and Ross1982) found that the highest concentrations of parasitic larvae were in the stratum up to 10 cm and showed lower infestation above 15 cm. According to Pegoraro et al. (Reference Pegoraro, Poli, Carvalho, Gomes and Ficher2008), in ryegrass pasture, the sheep preferentially sought younger leaves. These occurred in the upper strata (10–15 cm and above 15 cm), where lower risks of ingesting infective larvae and parasitic infection of animals were detected. Giacomini et al. (Reference Giacomini, Batista, Colozza, Mattos, Gerdes, Otsuk and Werner2014a, Reference Giacomini, Batista, Colozza, Gerdes, Mattos, Otsuk, Gimenes and Premazzi2014b) showed that Aruana grass supports intense grazing defoliation of up to 10–15 cm of post-grazing residue, provided there is enough nitrogen fertilizer in the soil to maintain regrowth vigour. Fernandes et al. (Reference Fernandes, Ramos, Jank, Carvalho, Martha and Braga2014) reported that the high cutting frequency of Aruana grass can reduce the accumulation of stems, as well as influence the height of the predetermined residue.
Both the nutritional value of the grasses and the morphological and structural characteristics of the pasture, such as the leaf and stem quality, canopy height, leaf area index (LAI), forage angle, and forage mass, are very important in the regulation of DM intake by sheep. This factor is a determinant of obtaining the necessary nutrients for the maintenance and production of animals. In particular, the leaf/stem ratio in the pasture is of great relevance, since during grazing there is a greater preference for the blades than for the stems because the blades are more accessible, less resistant to pulling and higher in nutritional quality (Brâncio et al., Reference Brâncio, Euclides, Nascimento, Fonseca, Almeida, Macedo and Barbosa2003a). The LAI has a high positive correlation with FA until it reaches a critical value, where 95% of the light is intercepted (Humphreys, Reference Humphreys1966; Brown and Blaser, Reference Brown and Blaser1968). Thus, using the 95% LI criterion, at the entry of the animals into the pasture, an optimum management condition can be offered for each cultivar to express its production potential, while optimizing the production of leaves and minimizing the accumulation of stems and senescent material. Above all, respecting the morpho-physiological characteristics of the plants as a function of the annual edaphoclimatic variations will offer material of high nutritional quality to sheep. Thus, by knowing the height of growth stabilization of grasses under nitrogen fertilization (N), within the LI criterion, combined with the morphological responses and nutritional qualities, especially those of leaves and stems, it is possible to establish appropriate management strategies for grasses to elicit highest animal performance responses.
In this context, the objective of this study was to evaluate the nutritional value and digestibility along with some characteristics of the forage canopy of Aries and Aruana cultivars kept under rotational stocking with sheep. A further objective was to determine, for each cultivar, the height of the forage canopy corresponding to 95% LI, which serves as a guide to choose the best moment for entry of sheep into the pasture.
Material and methods
Location, treatment and sampling
The experiment was conducted at the Institute of Zootechnics, in Nova Odessa, Sao Paulo, Brazil (47°27′81″W, 22°75′12″S, 545 m above sea level). According to the Köppen classification, the climate is characterized as rainy Aw-tropical, with a rainy period in summer and a dry period in winter. The average annual temperature is 22°C, with temperatures below 18°C in winter and above 25°C in summer, and prevailing southeast winds (CEPAGRI. 2017).
The climate conditions during the experimental period (21.5 months), from January 2006 to July 2007, were maximum temperature of 31°C; minimum of 16°C; precipitation of 1577 mm with 13 mm soil evapotranspiration and annual precipitation of 1478 mm. The climate data were obtained from the Integrated Agrometeorological Information Centre of the Agronomic Institute of Campinas, Sao Paulo, Brazil (CIIAGRO/IAC, Reference CIIAGRO/IAC2007) (Fig. 1). The soil in the experimental unit was classified as Red-Yellow Argisol (Embrapa, 2006; Benedetti et al., Reference Benedetti, Curi, Sparovek, Amaury de Carvalho Filho and Silva2019). Soil samples from the experimental area, collected in May 2004, were analysed according to the method described by van Raij et al. (Reference van Raij, Quaggio, Cantarella, Ferreira, Lopes and Bataglia1987) to calculate the need for liming and fertilization. The results of the soil chemical analysis were pH in calcium chloride (CaCl2) = 5.2; organic matter (OM) = 27 g/l; phosphorus (P) (resin) = 5 mg/l; potassium (K) = 2.1 mmolc/l; calcium (Ca) = 21 mmolc/l; magnesium (Mg) = 10 mmolc/l; hydrogen + aluminium (H + Al) = 33 mmolc/l, base sum = 33.1 mmolc/l; cation exchange capacity (CEC) = 66.6 mmolc/l; and base saturation (BS) = 500 g/kg.
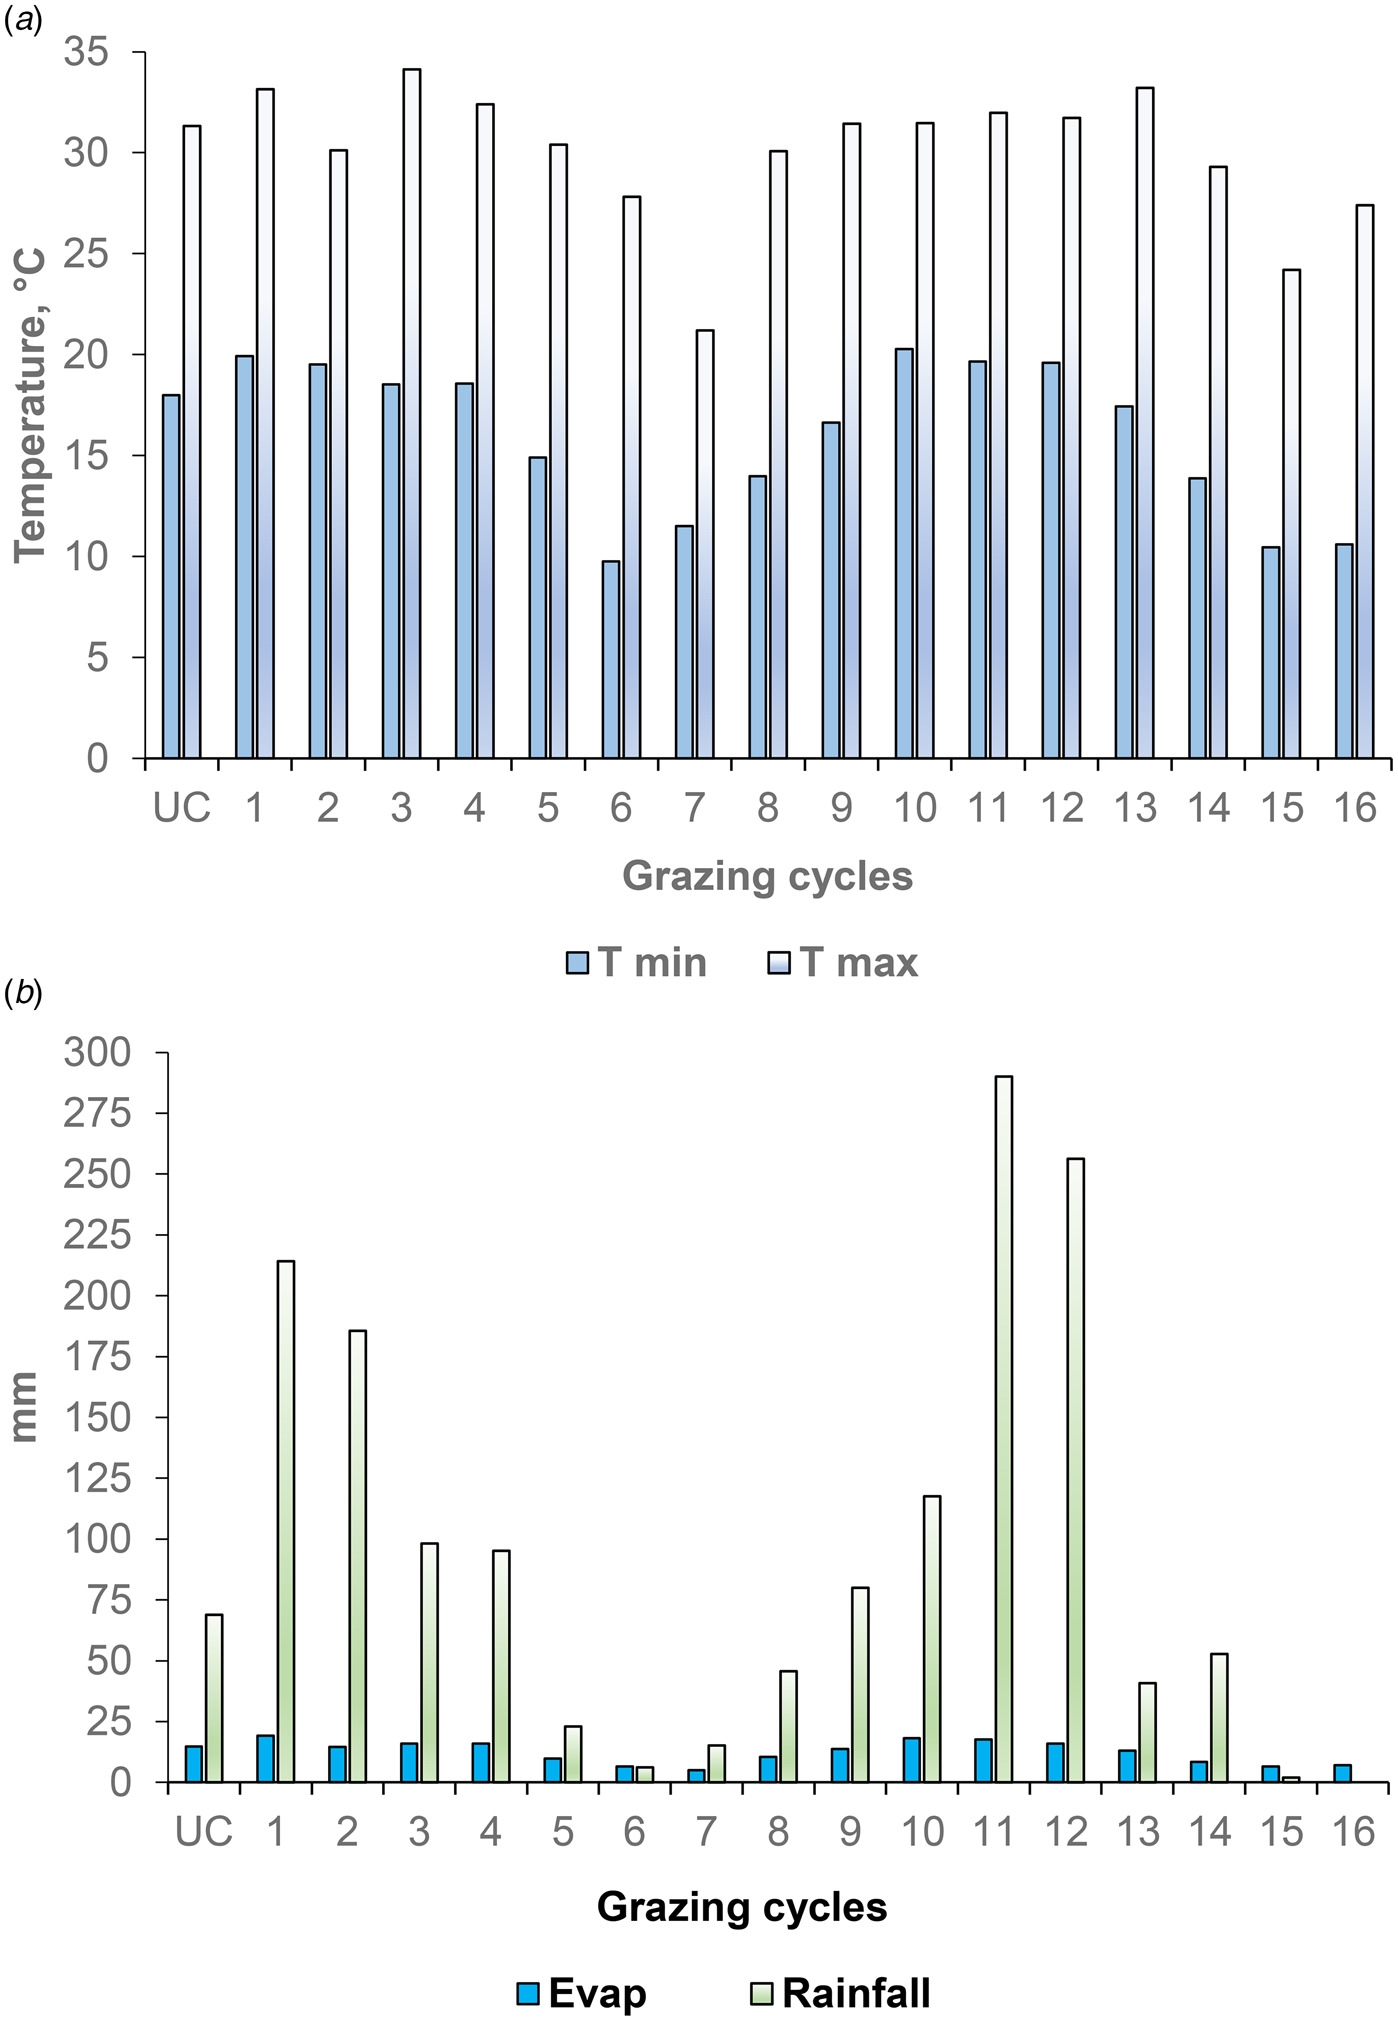
Fig. 1. Colour online. Climatic data for each grazing cycle during the experimental period from December 2005 to July 2007. Uniform cutting followed by grazing cycles were variable in length and depended on pasture reaching the initial grazing height. A uniform cutting (UC) was carried out in December 2005 with sheep followed by tractor-coupled cutter (grazing gradient). The first grazing cycles started on 01 January 2006. The average duration of grazing was 4 days in each cycle. Grazing cycles took place as follows: 1 to 3 Summer; 4 to 6 Autumn; 7 Winter; 8 Winter and Spring; 9 Spring and Summer; 10 to 12 Summer; 13 to 14 Autumn; 15 to 16 Winter, where Summer (21 Dec – 19 Mar), Autumn (20 Mar – 20 Jun), Winter (21 Jun – 22 Sep) and Spring (23 Sep – 20 Dec). a) T min, minimum temperature and T max, maximum temperature, b) Evap, evapotranspiration and rainfall.
Soil liming was carried out in mid-September 2004, aiming to raise the BS to 600 g/kg (1.0 Megagram/ha of dolomitic limestone with relative total neutralization power (PRNT) of 670 g/kg) at a depth of 0–20 cm. Subsequently, conventional tillage operations, such as ploughing and harrowing, were performed. At the time of grass sowing, 80 kg/ha of phosphorus pentoxide (P2O5) was applied manually; the source was simple superphosphate. Potassium fertilization was not used at the time of sowing, since the concentration of K in the soil was suitable for the planting of forage grasses, according to Werner et al. (Reference Werner, Paulino, Cantarella, Andrade, Quaggio, van Raij, Silva and Bataglia1996). The concentrations of P and K in the soil were evaluated through chemical soil analysis in 2006 and 2007, to obtain data to assist in the replacement of these nutrients.
The Aries and Aruana cultivars were planted in a total area of 2.2 ha, including rest areas, in 800 m2 paddocks, with rotary seed spreader in February 2005. The experimental data were evaluated as repeated measures over time (grazing cycles grouped in the four seasons of the year), with a treatment factor (grass cultivar) in a completely randomized block design with eight replicates, considering paddocks as experimental units. Grazing cycle collections were grouped by season (summer, autumn, winter and spring) in two consecutive years.
According to the harvest and measurement dates, the results were grouped within the corresponding seasons of the year (Summer, 21 December to 19 March; Autumn, 20 March to 20 June; Winter, 21 June to 22 September; Spring, 23 September to 20 December).
Initially, a grazing gradient was formed between the paddocks to begin experimenting with a rotating management system. The paddocks of each block were lowered and staggered in order to maintain uniform growth with an interval of 3 or 4 days between them, in December 2005 and January 2006, thus defining the grazing gradient.
Grazing cycles started on 1 January 2006 with the inclusion of sheep as cutting tools for grasses. Immediately after mowing, 10 kg of 20:5:20 (NPK) fertilizer was applied manually to each paddock in the rainy season, or 125 kg/ha of the formulation, corresponding to 25 kg/ha of N, 6.25 kg/ha of P2O5 and 25 kg/ha K2O (potassium oxide). From that moment, all fertilizations were carried out after removal of the animals. In the second grazing cycle, 10 kg of ammonium sulphate and 16 kg/ha of KCl (potassium chloride) were applied in each experimental unit, after grazing, corresponding to 25 kg/ha of N and 120 kg/ha of K2O. After the third grazing cycle, the N dose used was 100 kg/ha of N, that is, 40 kg/ha of ammonium sulphate per paddock (end-of-life fertilization) totalling 250 kg N/ha in 2006. On 1 November 2006, due to the appearance of symptoms of K deficiency in the cultivars, 16 kg/ha of KCl, corresponding to 120 kg/ha of K2O, was applied manually together with 40 kg/ha of P2O5 in the form of simple superphosphate, sequentially in each experimental unit. The K and P fertilization ended on 15 December 2006. Nitrogen fertilization (fertilization at the end of the rainy period, Summer) began on 28 February 2007, with the application of 150 kg/ha of N, that is, 60 kg/ha of ammonium sulphate per paddock.
The grazing method used was rotational stocking combined with the put-and-take technique, as described by Mott and Lucas (Reference Mott and Lucas1952), to adjust the number of animals to the amount of forage offered. Two groups of female sheep of the Ile de France and Santa Ines breeds, aged between 5 and 6 months, with an average weight of 60 kg, and DM intake of 20 g/kg body weight, were used. The sheep groups, with 27 animals each, one for each cultivar, representing an average value of 3.7 AU/ha (AU = 450 kg cow/hectare), entered the paddocks as defoliators, when the canopy of the evaluated cultivar reached 95% (±1.0%) LI and exited when the height of the residue reached 15 cm (±5 cm). The adoption of this residue height was based on the potential for regrowth of the pasture and the viability of exploitation by sheep through grazing in order to minimize the ingestion of helminthic parasitic larvae possibly present in the pasture (Vlassoff, Reference Vlassoff and Ross1982; Cunha et al., Reference Cunha, Santos, Roda, Bueno, Pozzi and Otsuk1997; Pegoraro et al., Reference Pegoraro, Poli, Carvalho, Gomes and Ficher2008; Giacomini et al., Reference Giacomini, Batista, Colozza, Mattos, Gerdes, Otsuk and Werner2014a, Reference Giacomini, Batista, Colozza, Gerdes, Mattos, Otsuk, Gimenes and Premazzi2014b). Animal performance was not evaluated for two technical reasons: (1) According to statisticians, to do so would require spatial repetition of the experimental area, e.g., double the number of cultivated blocks, and there was no area available for this. (2) Quadrupling the number of animals, in both situations, would complicate the handling of animals entering and leaving the paddocks. Therefore, the animals were used for defoliating only. The LI and LAI were obtained using a LI-COR LA-2000 canopy analyser. At the soil level, 54 LI readings were performed per experimental unit. The height of the forage canopy, in the pre- and post-grazing conditions, was measured with a ruler (cm) at 30 points chosen randomly in each plot, avoiding furrows, anthills and edges.
The forage samplings for nutritional and IVDMD assessment were carried out prior to the entry of the animals in the paddocks during pre-grazing evaluations. Thus, the sampling consisted of randomly forming rectangles of 0.50 m2 (1.0 m × 0.50 m) at four points in the paddock, where all forage material was collected above 7.0 cm from the ground, to maintain a minimum of residue to facilitate regrowth. The fresh forage from these four points was weighed (fresh weight), subsampled and dried in a forced-air oven at 55°C for 72 h. The data were used to calculate the dry mass of forage per hectare (FA). Another fraction of the subsamples was used for morphological separation into leaf blades, stem + sheaths and dead material. The final portion of the subsamples was used to perform chemical-bromatological analysis and determine DM digestibility. The whole-plant samples (blades and stems + sheaths) of Aries and Aruana cultivars were recomposed, due to the initial fractioning, to estimate the nutritional variables and DM digestibility, in the four seasons of the years 2006 and 2007.
Sample analysis
After collection, the subsamples were chopped manually, dried in a forced-air oven at 55°C for 72 h and ground using a Wiley mill with a 1.0 mm sieve. Two subsamples per treatment were analysed for DM at 105°C (index no. 934.01), ash (index no. 942.05), ether extract (index no. 920.39; AOAC, Reference Cunniff1995) and crude protein (CP; Wiles et al., Reference Wiles, Gray and Kissling1998). Neutral detergent fibre (NDF; without sodium sulphite and alpha amylase, expressed including the residual ash) and acid detergent fibre (ADF; expressed including the residual ash) were analysed according to Van Soest et al. (Reference Van Soest, Robertson and Lewis1991), and the lignin (sa) was analysed according to Robertson and Van Soest (Reference Robertson, Van Soest, James and Theander1981). Hemicellulose was estimated as NDF minus ADF and cellulose as ADF minus lignin (sa) by sequential analyses of fibre. In vitro dry matter digestibility (IVDMD) was measured according to Tilley and Terry (Reference Tilley1963). Briefly, in the first stage, 100 ml tubes containing 500 mg samples (dry and 1.0 mm milled), 10 ml of buffer solution, and 12 ml of rumen fluid (from beef cattle fed with hay) were closed with rubber caps with an exhaust gas valve and incubated for 48 h at 39°C in a water bath (two replicates per sample). The second stage involved incubation with pepsin, where initially 1.0 ml of the solution of HCl with a concentration of 200 g/kg was added followed by another 4.0 ml of the same acid. Then, 2.0 ml of the solution with a pepsin concentration of 5.0 g/l was added and allowed to incubate in a water bath at 39°C for 48 h. The digestibility of DM was obtained by the difference between the total of the initial sample and the residue after the digestion in the two incubation stages (Tilley and Terry, Reference Tilley1963).
Statistical analysis
The data were submitted to analysis of variance, using a model of repeated measures with a treatment factor (grass cultivar, two levels) and a longitudinal factor (season of the year, four levels) in a randomized block design with eight repetitions. The choice of the best covariance structure was based on the information criteria of Akaike (AIC) and Bayes (BIC). In all analyses, the SAS 9.4 (2003) mixed procedure was used. The significant differences accepted were P ≤ 0.10 in the morphological and physiological characteristics of each cultivar, due to the high variability in field and grazing conditions, with P ≤ 0.05 for all nutritional variables and DM digestibility, since these parameters were analysed in a controlled environment. The LSD test was used to compare the mean effects of seasons of the year on each cultivar for all variables, such as nutritional value, DM digestibility and morphological and physiological characteristics of the cultivar. Pearson's correlation coefficients between original bromatological data, digestibility and physiological characteristics of each cultivar were calculated using the SAS 9.4 (2003), CORR procedure. The segmented regression (SAS NLIN procedure) of pre-grazing heights in grazing cycles was used to estimate the broken line, the time taken for the heights of grasses to stabilize during the study period (Robbins et al., Reference Robbins, Saxton and Southern2006; SAS, 2019).
Results
In addition to pasture management, climate factors play a fundamental role in the production responses of tropical grasses, especially regarding seasons of the year. In the summer, there was great accumulation of forage (FA) and forage mass, corresponding to the highest rainfall, temperatures and soil evapotranspiration (214 mm, 33°C and 19 mm in 2006 and 290 mm, 32°C and 18 mm in 2007, respectively; Fig. 1). Table 1 shows the initial heights of the grass residues cut mechanically to establish the grazing gradients of the paddocks. Figure 2 shows the average results of the bromatological composition and in vitro digestibility of the Aries and Aruana grasses in 2006 and 2007. Since there was no drastic climate variation that could have influenced the results, we opted to combine the data from 2006 and 2007 for statistical analysis.
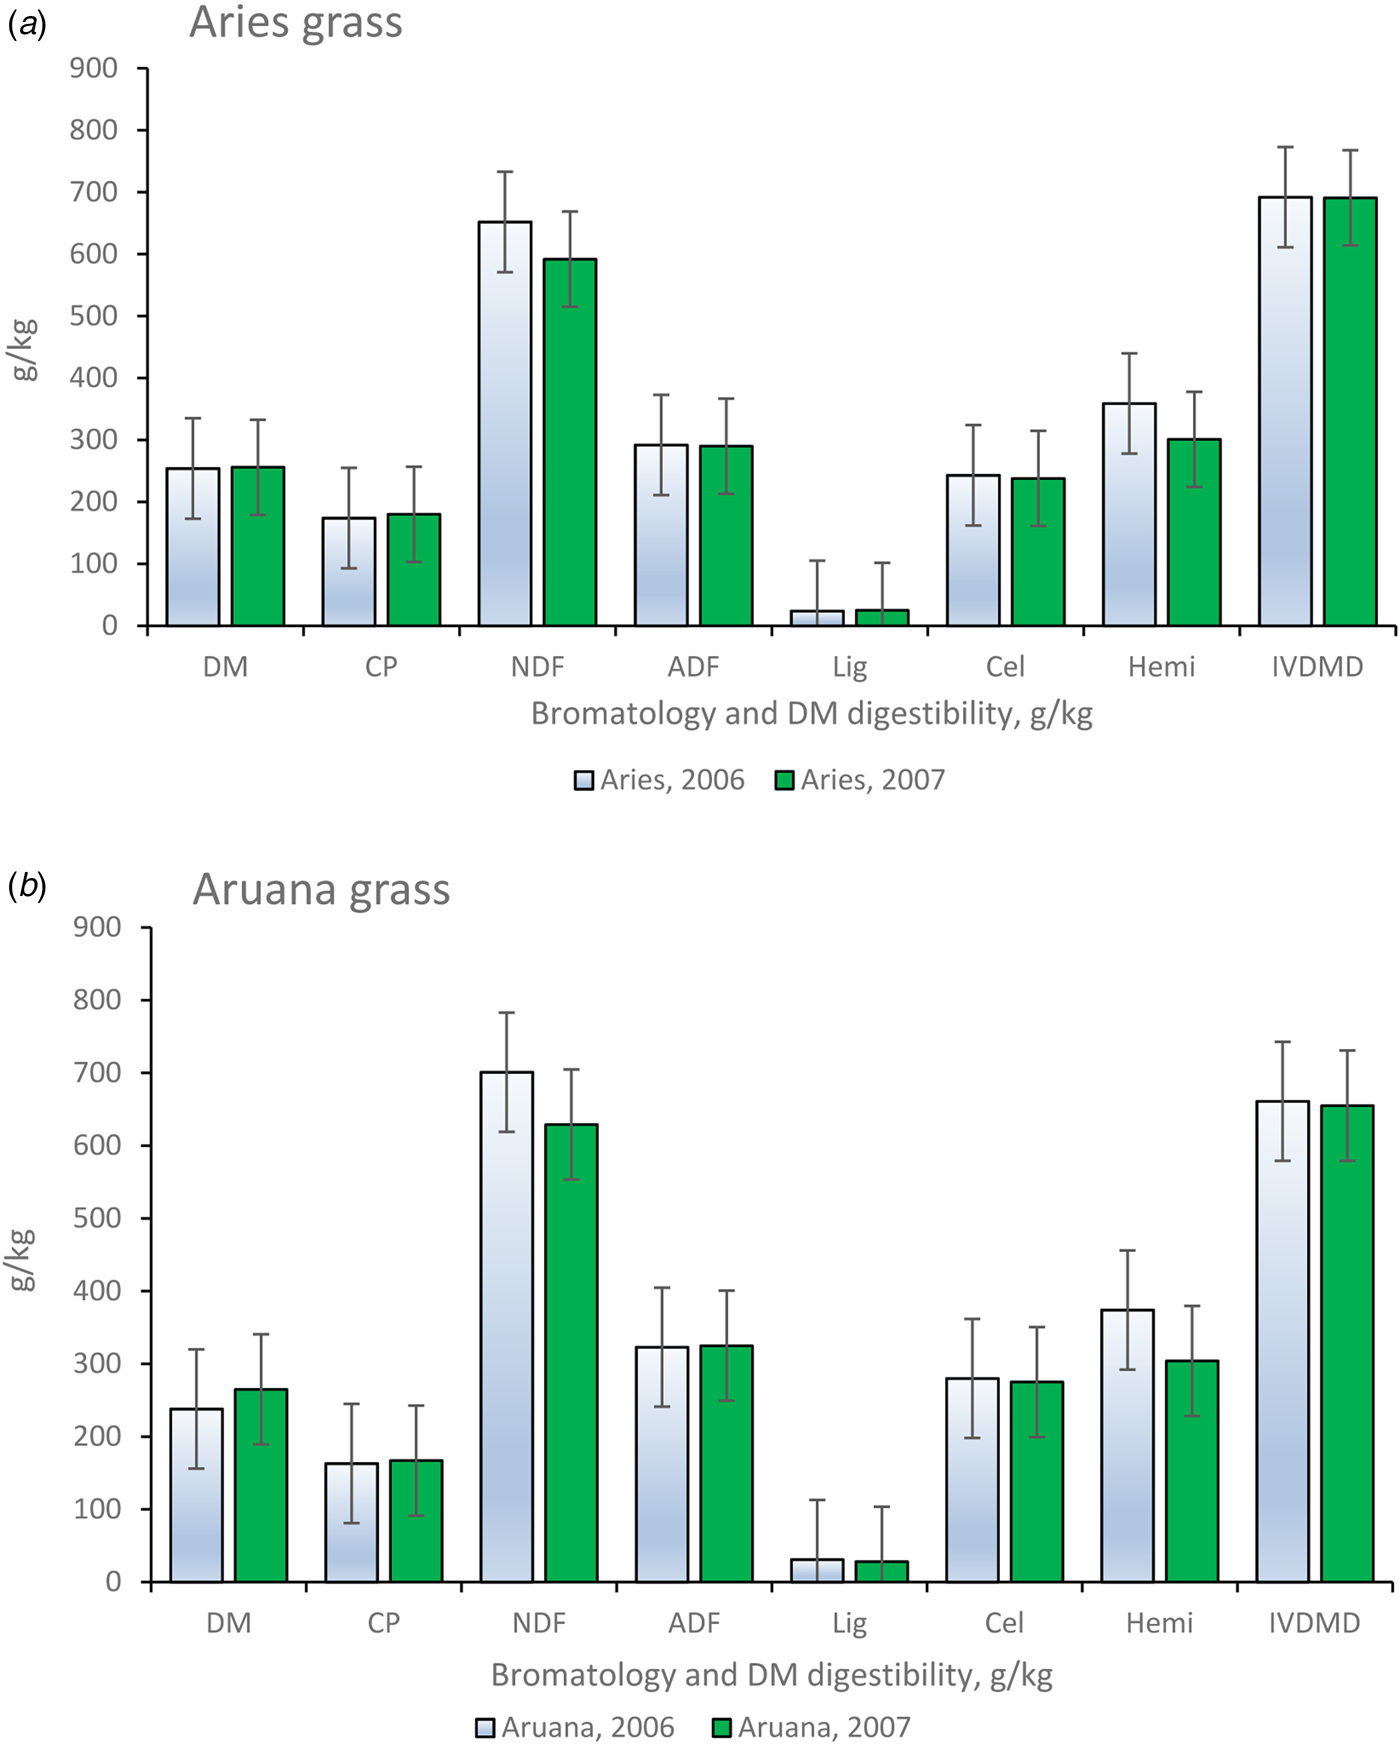
Fig. 2. Colour online. Average values related to bromatological composition and in vitro dry matter digestibility of Aries and Aruana grass and variations in data for 2006 and 2007 together (CP, crude protein; ADF, acid detergent fibre; NDF, neutral detergent fibre; Cel, cellulose; Lig, lignin; Hemi, hemicellulose; IVDMD, in vitro dry matter digestibility).
Table 1. Date of clearing and average height of grasses after mechanical cutting to start data collection

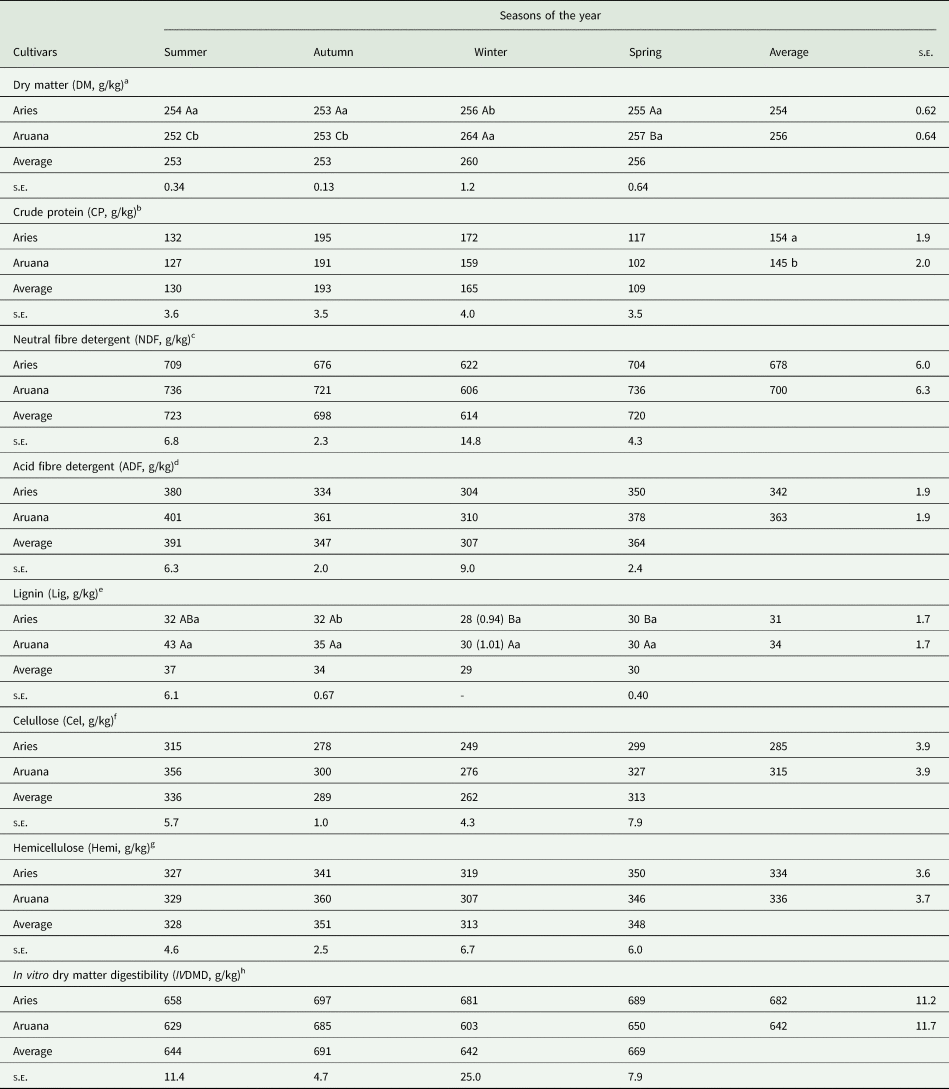
Significant effects were detected of the main isolated factors (P < 0.10) cultivar (Aries and Aruana) and season on the morpho-physiological variables LAI, FA, forage mass and dead matter (Table 2). For pre-grazing height, leaf blade percentage and green leaf blade production, an interaction effect of cultivar and season was observed (P < 0.10). For the nutritional variables and in vitro DM digestibility, significance was verified (P < 0.05) for the interaction between cultivars and seasons of the year for the variables DM, lignin and in vitro digestibility of leaf blades (Table 3), CP and NDF, ADF and cellulose for stems + sheaths (Table 4) and DM and lignin for the whole-plant samples (Table 5), while for the other variables analysed, there was only the effect of the main isolated factors (P < 0.05), cultivars and season of the year (Tables 2–5).
Table 2. Physiological, morphological and management parameters of Aries and Aruana cultivars in the four seasons of 2006 and 2007

a, b: Mean values followed by letters columns, lowercase in the same variable were significantly different (P < 0.10).
A, B: Mean values followed by letters in the rows, uppercase in the same variable and factor were significantly different (P < 0.10). s.e. = standard errors.
a P = 0.7250 for grasses v. seasons, P = 0.0003 for seasons and P = 0.1390 for grasses.
b P = 0.0194 for grasses v. seasons, P < 0.0001 for seasons and P = 0.0371 for grasses.
c P = 0.0134 for grasses v. seasons, P < 0.0001 for seasons and P = 0.0003 for grasses.
d P = 0.1510 for grasses v. seasons, P < 0.0001 for seasons and P = 0.9580 for grasses.
e P = 0.9450 for grasses v. seasons, P < 0.0001 for seasons and P = 0.5710 for grasses.
f P = 0.0060 for grasses v. seasons, P < 0.0001 for seasons and P = 0.4500 for grasses.
g P = 0.1338 for grasses v. seasons, P < 0.0001 for seasons and P = 0.6409 for grasses.
Table 3. Average estimate of the nutritional value of leaf blade samples of Aries and Aruana cultivars in the four seasons of two consecutive years (2006 and 2007)

a, b: Mean values followed by letters columns, lowercase in the same variable were significantly different (P < 0.05).
A, B: Mean values followed by letters in the rows, uppercase in the same variable and factor were significantly different (P < 0.05). s.e. = standard errors.
a P < 0.0001 for grasses v. seasons, P < 0.0001 for seasons and P = 0.4490 for grasses.
b P = 0.1987 for grasses v. seasons, P < 0.0001 for seasons and P = 0.0058 for grasses.
c P = 0.2522 for grasses v. seasons, P < 0.0001 for seasons and P = 0.3310 for grasses.
d P = 0.813 for grasses v. seasons, P < 0.0001 for seasons and P < 0.0001 for grasses.
e P = 0.0009 for grasses v. seasons, P < 0.0001 for seasons and P = 0.1097 for grasses.
f P = 0.6277 for grasses v. seasons, P < 0.0001 for seasons and P = 0.0208 for grasses.
g P = 0.093 for grasses v. seasons, P < 0.0001 for seasons and P = 0.1109 for grasses.
h P < 0.0558 for grasses v. seasons, P < 0.0001 for seasons and P = 0.0506 for grasses.
Table 4. Average estimate of the nutritional value of samples of stems + sheaths of Aries and Aruana cultivars in the four seasons of two consecutive years (2006 and 2007)

a, b: Mean values followed by letters columns, lowercase in the same variable were significantly different (P < 0.05).
A, B: Mean values followed by letters in the rows, uppercase in the same variable and factor were significantly different (P < 0.05). s.e. = standard errors.
a P = 0.349 for grasses v. seasons, P = 0.892 for seasons and P < 0.0001 for grasses.
b P = 0.038 for grasses v. seasons, P < 0.0001 for seasons and P = 0.0004 for grasses.
c P = 0.038 for grasses v. seasons, P < 0.0001 for seasons and P = 0.0002 for grasses.
d P = 0.004 for grasses v. seasons, P < 0.0001 for seasons and P = 0.0007 for grasses.
e P = 0.954 for grasses v. seasons, P = 0.0016 for seasons and P = 0.8214 for grasses.
f P = 0.040 for grasses v. seasons, P < 0.0001 for seasons and P = 0.0013 for grasses.
g P = 0.2130 for grasses v. seasons, P < 0.0001 for seasons and P = 0.6453 for grasses.
h P = 0.156 for grasses v. seasons, P = 0.0003 for seasons and P = 0.768 for grasses.
Table 5. Average estimate of the nutritional value of whole-plant samples (blades and stems + sheaths) of Aries and Aruana cultivars in the four seasons of the years 2006 and 2007
a, b: Mean values followed by letters columns, lowercase in the same variable were significantly different (P < 0.05).
A, B: Mean values followed by letters in the rows, uppercase in the same variable and factor were significantly different (P < 0.05). s.e. = standard errors.
a P < 0.0001 for grasses v. seasons, P < 0.0001 for seasons and P = 0.072 for grasses.
b P = 0.468 for grasses v. seasons, P < 0.0001 for seasons and P = 0.012 for grasses.
c P = 0.126 for grasses v. seasons, P < 0.0001 for seasons and P = 0.0423 for grasses.
d P = 0.376 for grasses v. seasons, P < 0.0001 for seasons and P = 0.0203 for grasses.
e P = 0.0109 for grasses v. seasons, P < 0.0001 for seasons and P = 0.1615 for grasses.
f P = 0.374 for grasses v. seasons, P < 0.0001 for seasons and P = 0.0012 for grasses.
g P = 0.092 for grasses v. season, P < 0.0001 for seasons and P = 0.8114 for grasses.
h P = 0.2867 for grasses v. seasons, P = 0.0006 for seasons and P = 0.044 for grasses.
The average values of the LI readings were within the initial design, with mean and standard deviation of 95.1% ± 0.94 for Aries grass and 94.9% ± 0.66 for Aruana (Figs 3 and 4).
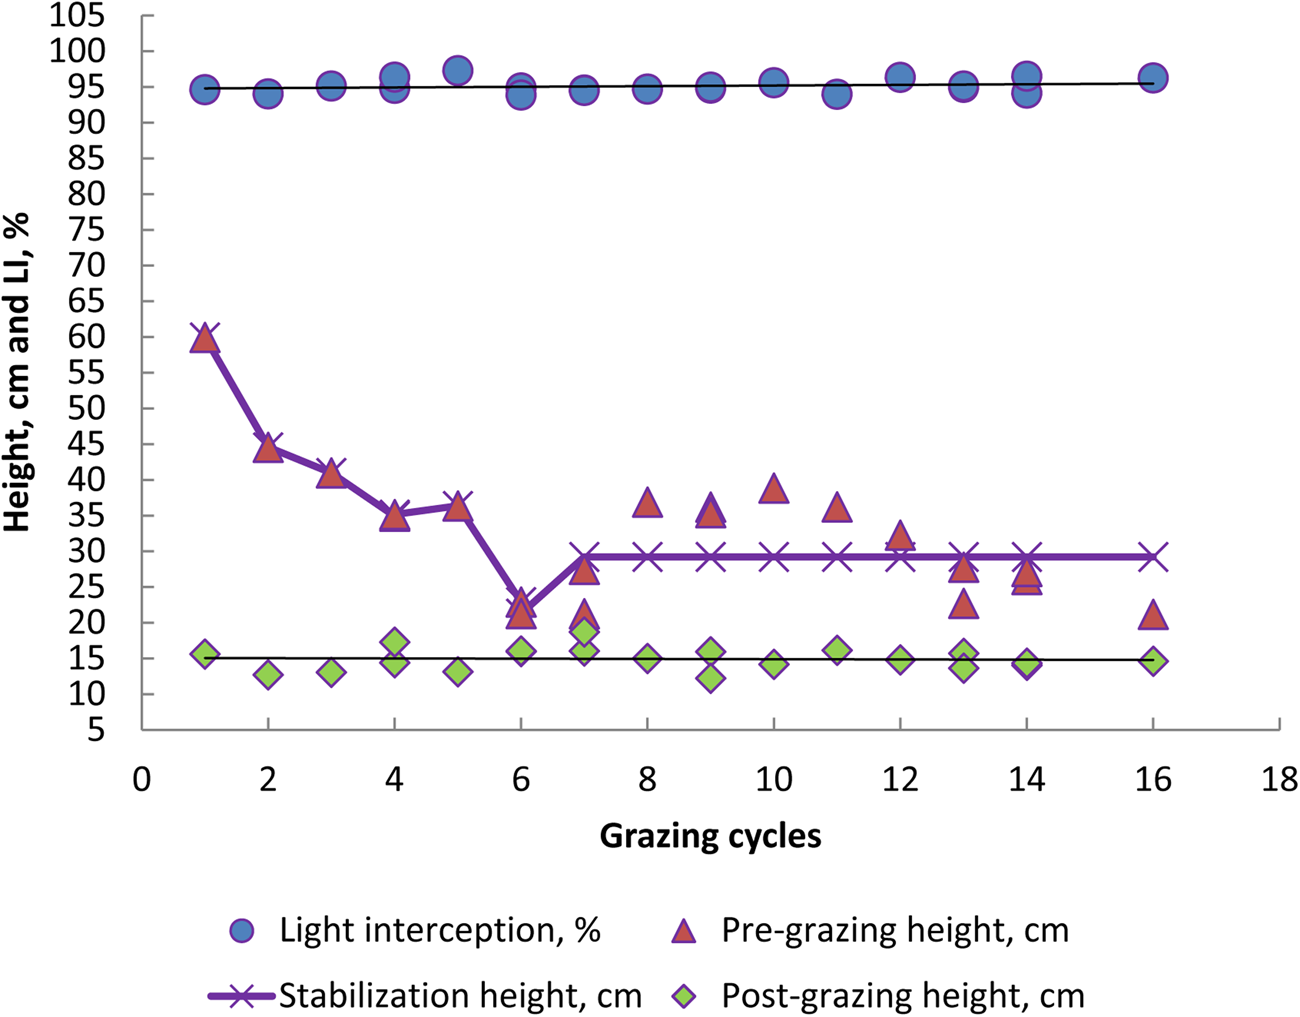
Fig. 3. Colour online. Response of light interception (LI), pre- and post-grazing height and *stabilization height (29.2 cm) of Aries grass canopy within grazing cycles in the experimental period of 2006 and 2007. *P < 0.0001 (Procedure NLIN, SAS).
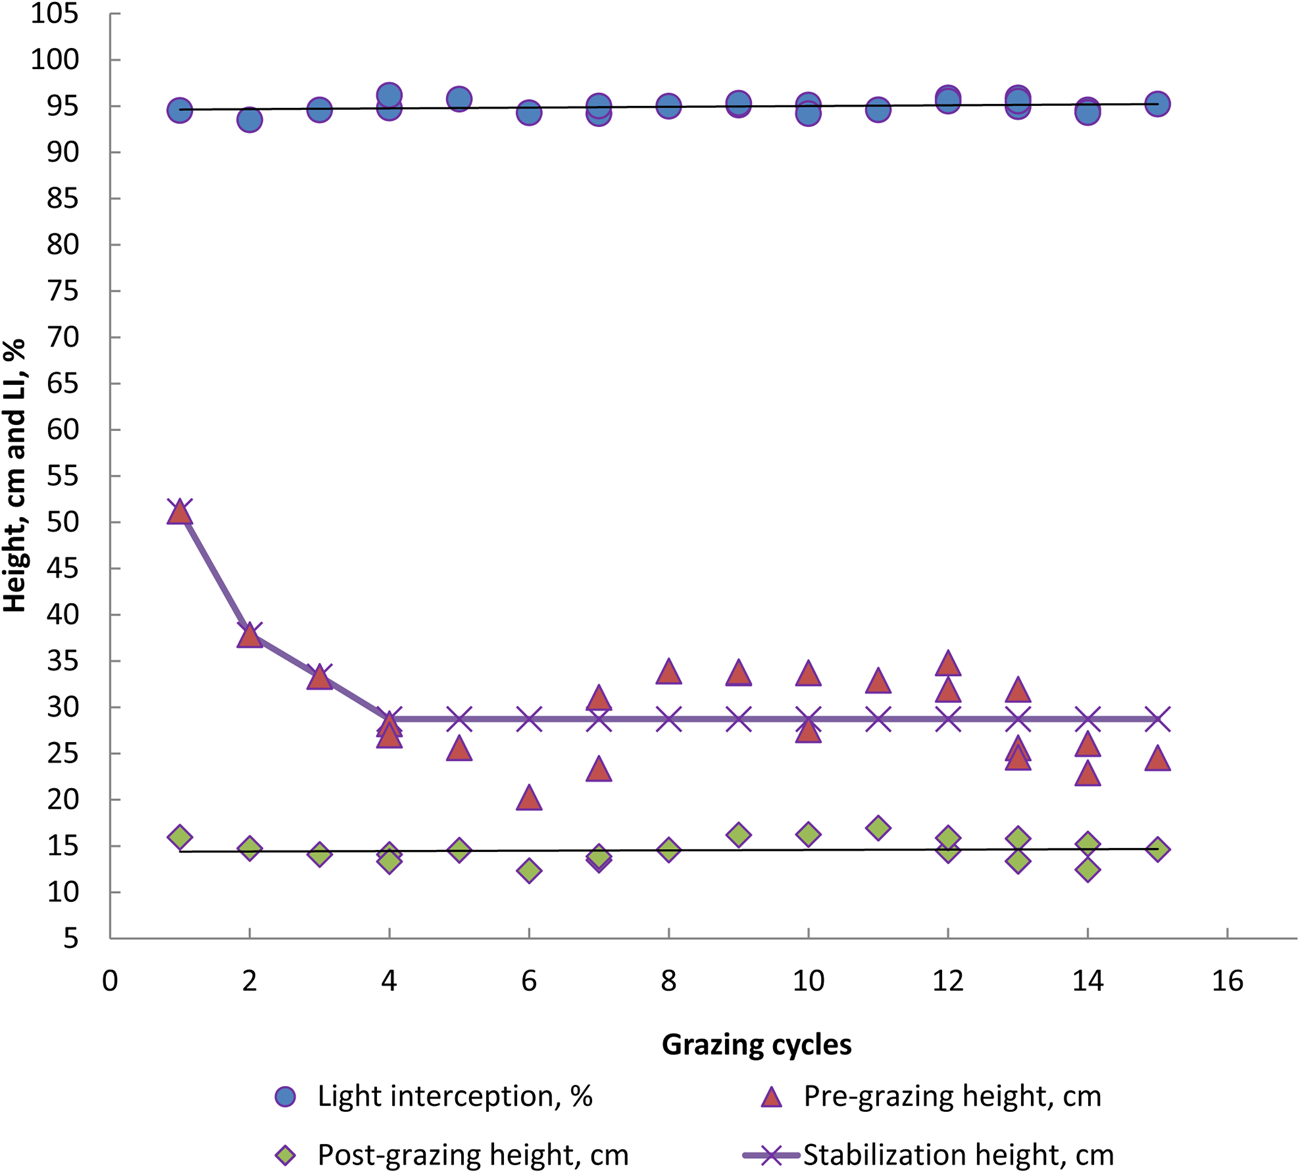
Fig. 4. Colour online. Response of light interception (LI), pre- and post-grazing height and *stabilization height (28.7 cm) of Aruana grass canopy within grazing cycles in the experimental period of 2006 and 2007. *P < 0.0001 (Procedure NLIN, SAS).
Regarding LAI values, Aries and Aruana cultivars did not show significant differences (3.9 v. 3.8, P > 0.10, Table 2). There were higher LAIs in the autumn and winter seasons of 2006 and 2007 (4.1 and 3.8 v. 4.0 and 4.0, P < 0.10, respectively) and similar values in the summer and spring (3.7 and 3.8 v. 3.6 and 3.8, P > 0.10, respectively), whereas in winter only the LAI was different from autumn of 2006 (3.8 v. 4.1, P < 0.10). For the height of the forage canopy before grazing (pre-grazing), the Aries grass was greater than the Aruana grass in the summer and autumn (48 v. 39 and 32 v. 24 cm in 2006, respectively; 37 v. 32 cm in the summer of 2007, P < 0.10, Table 2), while the two were similar in height in the other seasons (P > 0.10, Table 1). However, the highest pre-grazing heights for the Aruana grass were observed in summer and spring 2006 and 2007 (39 and 34 cm v. 32 and 29 cm, P < 0.10, Table 1), and the two were similar in height in autumn, winter and spring (P > 0.10, Table 2). For Aries, the highest pre-grazing height was observed in the summer, followed by autumn, winter and spring (48, 32, 22 and 34 cm in 2006, respectively, P < 0.10, Table 2). In 2007, higher pre-grazing heights were observed in the spring, but heights were similar between all seasons of the 2 years evaluated (P > 0.10). Stabilization heights of the grasses in pre-grazing (incorporation of all grazing cycles) occurred at 29.2 and 28.7 cm (P < 0.0001) for the Aries and Aruana cultivars, respectively (Figs 3 and 4). However, the post-grazing height of the Aries and Aruana cultivars was close to 15 cm, as a pre-established criterion (14.8 ± 1.6 v. 14.4 ± 1.6 cm, respectively).
The highest percentages of leaf blades were observed for Aruana grass in winter and spring compared to Aries grass (83 v. 74 and 72 v. 61%, 2006, and 85 v. 71 and 36 v. 30%, 2007, 2007, P < 0.10, respectively, Table 2). The results were similar between summer and autumn of the 2 years evaluated (P > 0.10). The Aries and Aruana cultivars both presented higher leaf blade percentage in the winter (74 and 83%, 2006, and 71 and 85%, 2007) relative to the other seasons of the year. The lowest percentages of leaf blades of Aruana grass were observed in summer 2006 (56%) followed by summer, autumn and spring 2007 (58, 60 and 36%, P < 0.10), while the Aries grass presented the lowest percentages of leaf blades in summer 2006 and spring 2007 (55 and 30%, respectively, P < 0.10). Similar results were observed in summer and winter 2007 (61 and 71%, respectively, P > 0.10). The FA followed a decreasing order in summer, spring, autumn and winter of 2006 and 2007 (6967; 3768; 3944; 2789; 2218; 1822; 1197 and 1075 kg DM/ha, respectively, P < 0.10).
However, Aries and Aruana showed similar forage yields (2978 v. 2967 kg DM/ha, P > 0.10). The mass of dead material was the lowest in the summer and spring seasons of 2007 (135 and 78 kg DM/ha, respectively, P < 0.10) for both cultivars, while those in the other seasons were similar in all years. The green mass production of leaf blades of both cultivars showed similarities between seasons (P > 0.10), with the exception of spring 2006, in which Aruana grass produced a higher mass of green leaves than Aries grass (2202 v. 1525, P < 0.10). However, in summer 2007, Aries grass produced higher mass of green leaves than Aruana grass (4469 v. 3805 kg DM/ha), but in the winter, Aruana grass showed a higher response of green leaf production than Aries grass (1049 v. 601 kg DM/ha).
Comparison of the seasons within each cultivar showed that both grasses produced higher green mass of leaf blades in summer 2007 than in any other season of both years (P < 0.10). The production in autumn and spring was similar, with lower production in the winter for both years (P > 0.05). Aruana grass also produced a higher green leaf mass in the summer (P < 0.10) and similar masses in autumn and spring 2006 and spring 2007 (P > 0.10).
Both grasses showed similar forage mass production (1545 v. 1595 kg DM/ha, P > 0.10). As for the seasons of the years, there was higher production in the summer and spring of 2006 and summer 2007 (P < 0.10).
Cultivar × season effects were observed for some variables. The results of bromatological and digestibility analyses of Aries and Aruana samples (Tables 3–5) indicated higher DM content in the leaf blades of Aries grass than Aruana grass in the autumn (254 v. 223 g/kg, P < 0.05, Table 3), whereas in summer, winter and spring, Aruana grass showed higher DM content than Aries grass (P < 0.05). In Aries grass, there were no seasonal differences in DM contents (P > 0.05), whereas in Aruana grass, higher DM contents were observed in summer, winter and spring (P < 0.05). In summer and autumn, the leaf blades of Aruana grass contained more lignin than those of Aries grass (P < 0.05). However, both grasses presented leaf blades with higher IVDMD responses in the autumn, following the same trend of the positive responses of CP, cellulose and hemicellulose contents in the leaf blades and lower contents of ADF in the leaf blades during autumn and winter (P < 0.10, Table 3).
In the evaluation of the stems + sheaths (Table 3), both grasses showed higher CP contents in autumn (P < 0.05). However, Aries grass had higher contents of CP than Aruana grass in the autumn, winter and spring (P < 0.05). Although the DM content did not vary between seasons (P > 0.05), stems + sheaths of Aries grass presented a higher DM content than those of Aruana grass (242 v. 238 g/kg, P < 0.05). NDF contents of the stems + sheaths were higher in the summer and spring for both cultivars and were also higher in Aruana grass than in Aries grass (P < 0.05). A higher content of ADF and cellulose, and consequently lower DM digestibility, was observed in the summer relative to the autumn, winter and spring. Aruana grass presented higher contents of ADF and cellulose than Aries grass in samples of stems + sheaths (427 v. 406 g/kg and 365 v. 342 g/kg, respectively, P < 0.05). In all seasons, Aruana grass presented higher cellulose content than Aries grass (P < 0.05).
Aries grass presented higher whole-plant DM content than Aruana grass in the summer and autumn, whereas the reverse was true in winter (P < 0.05) (Table 5). However, in the summer and autumn seasons, Aruana grass had the lowest DM (P < 0.05), while the DM content of Aries grass showed little seasonal variability (P > 0.05). Regardless of the grass cultivar, the whole-plant CP content was higher in the autumn (193 g/kg), coincident with the second lowest NDF, ADF and cellulose contents. Although in general the grasses presented concentrations of lignin of 28–43 g/kg, this did not affect the values of IVDMD (644–691 g/kg). The IVDMD of the whole plant was similar in all seasons (P > 0.05), but Aries grass showed higher IVDMD results than Aruana grass (682 v. 642 g/kg, P < 0.05). Higher values of both CP and whole-plant IVDMD were observed for Aries grass than for Aruana grass (154 v. 145 g/kg and 682 v. 642 g/kg, respectively, P < 0.05), while Aruana grass had higher contents of NDF, ADF and cellulose (700, 363 and 315 g/kg, respectively, P < 0.05), which probably explains the lower contents of IVDMD in relation to Aries grass.
Regarding the correlations of nutritional variables with those of grass management parameters, there were significant coefficients, ranging from −0.14 to 0.88 (Table 6). There were inversely proportional relationships for the variables ADF, NDF, Cel and Lig for the IVDMD of Aries grass (P < 0.10) and CP for pre-grazing height (−0.18). There was also a directly proportional response of CP to IVDMD, LAI and LI and pre-grazing height to the concentration of ADF, NDF and Cel (Table 6, P < 0.05).
Table 6. Pearson correlation coefficients between the management parameters of Aries grass and the bromatological composition and whole-plant digestibility
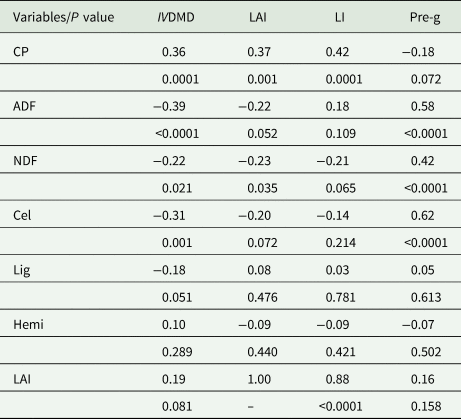
CP, crude protein; ADF, acid detergent fibre; NDF, neutral detergent fibre; Cel, cellulose; Lig, lignin; Hemi, hemicellulose; IVDMD, in vitro dry matter digestibility; LAI, leaf area index; LI, light interception; Pre-g, pre-grazing height (cm).
Significant correlation coefficient was accepted if P ≤ 0.05. Original data.
For Aruana grass (Table 7), there were lower correlation responses for the evaluated variables. However, there were directly proportional relationships between CP and IVDMD (P < 0.05), and pre-grazing height was directly proportional to the concentrations of ADF, NDF and Cel (P < 0.05). There were also inversely proportional relationships of IVDMD with ADF (−0.18, P < 0.05) and CP with pre-grazing height (−0.33, P < 0.05).
Table 7. Pearson's correlation coefficients between the management parameters of Aruana grass and the bromatological composition and whole-plant digestibility
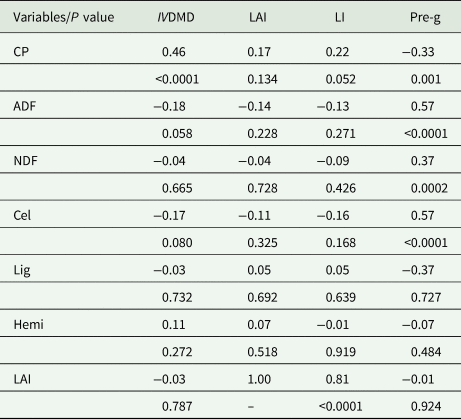
CP, crude protein; ADF, acid detergent fibre; NDF, neutral detergent fibre; Cel, cellulose; Lig, lignin; Hemi, hemicellulose; IVDMD, in vitro dry matter digestibility; LAI, leaf area index; LI, light interception; Pre-g, pre-grazing height (cm).
Significant correlation coefficient was accepted if P ≤ 0.05. Original data.
Discussion
Knowledge of the physiology and ecology of forage plants in grazing management is of fundamental importance to maximize the growth potential and quality of tropical grasses. Our agronomic results showed that the same management conditions applied to the grass cultivars Aries and Aruana expressed their greater productive and qualitative potential. Our results also indicated that the seasons of the year influenced the LI process as well as in the LAI of the evaluated grasses.
However, the environment to which the plant is exposed (temperature, water, soil fertility), and the management practices employed also affect the nutritional value of forage. Balsalobre et al. (Reference Balsalobre, Corsi, Santos, Vieira and Cárdenas2003) found lower nutritional value of irrigated Tanzania grass under rotational grazing between July and September, due to a lower rate of tissue renewal during the winter period and the accumulation of flowering tillers.
The differences between the pre-grazing management heights, based on the LI, culminated in altered LAI, FA, forage mass, production of green leaf blades, leaf blade percentage and dead material throughout the seasons, showing there were differences in morphology between these grasses. Although a similar light environment was found for both cultivars, the canopy structure differed between grasses, since one produced more leaf blades than the other. Thus, the different heights influenced the structural and qualitative composition of the grass, caused by the intense growth of stems and leaves. Grass height is a reflection of both the application of fertilization and the management of grazing by animals, in addition to the climate conditions. The increase in leaf growth and leaf area in autumn may be due to the application of high amounts of N to the soil at the end of the summer (150 kg/ha of N), the ambient temperature and the presence of higher rainfall and soil evapotranspiration (Fig. 1).
As a result of better physical-chemical composition of the leaves, the leaf/stem ratio has a positive correlation with forage consumption and animal performance (Brâncio et al., Reference Brâncio, Nascimento, Euclides, Fonseca, Almeida, Macedo and Barbosa2003b). In this respect, Campos et al. (Reference Campos, Lanna, Bose, Boin and Sarmento2002) reported large differences in the DM composition and DM degradability of leaves and stems of elephant grass (143 v. 46 g/kg of CP, 714 v. 803 g/kg of NDF and 813 v. 704 g/kg of DM, respectively) according to the ages of the grasses. On the other hand, increasing the proportion of stems may reduce the efficiency of pasture utilization, limiting the animals' forage harvesting capacity and worsening its quality (Hodgson, Reference Hodgson1990). Therefore, grazing management should aim to increase the amount and proportion of pasture blades and reduce that of stems and senescent and dead material. According to Hodgson (Reference Hodgson1990), performance and animal production per unit area in tropical pastures shows a marked pattern of variation. This is because variations in pasture structure and forage availability affect the animals through their effects on the amount and nutritional value of the forage consumed. Moreira et al. (Reference Moreira, Costa, Fernandes, Farias, Faria, Silveira, Gonçalves, Costa, Silveira and Pedroso2018) mentioned that both physical−chemical quality and grazing management of tropical forages influence animal performance responses. The authors attributed these responses to the grazing behaviour of the sheep, according to which the animals will have to spend less time in a grazing area containing high-quality forage to meet their nutritional requirement, e.g., the animals will have smaller grazing sites.
In the direct comparison of Aries and Aruana cultivars in the context of accumulation of forage and forage mass, there was no difference between them. However, both presented significant changes in the seasons, probably due to climatic variations (Fig. 1). These results are in line with the observation by Hodgson (Reference Hodgson1990), who stated that the photosynthetic potential of pasture is a result of its LAI and its photosynthetic capacity of the forage canopy under favourable environmental conditions. According to Humphreys (Reference Humphreys1966) and Brown and Blaser (Reference Brown and Blaser1968), there is a high positive correlation between LAI and pasture dry mass accumulation up to its critical value, where 95% of incident light is intercepted by leaf blades. However, below 95% light trapping of the forage canopy, the FA rate is dependent on the LAI (Hodgson, Reference Hodgson1990; Humphreys, Reference Humphreys and Humphreys1991). Coelho et al. (Reference Coelho, Dubeux, Santos, Leão Neto, Cunha, Santos, Mello and Lira2014) found strong correlation of the LAI with LI of different tropical grasses. In the present work, we obtained correlations of LAI with LI of 0.88 for Aries grass and 0.81 for Aruana grass.
Humphreys (Reference Humphreys and Humphreys1991) reported that grassland-critical LAI is usually between 3 and 5, at which time LI would be around 95%. There was observed that LI ranged from 94.8 to 95.6% and the corresponding LAI from 3.7 to 4.1 in summer and autumn. However, the highest LI (95.6%) coincided with the highest LAI (4.1), but this was reflected in the second lowest average leaf blade percentage in autumn, third lowest FA, greater leaf-DM and whole-plant digestibility, and the second-lowest value of DM digestibility of the stems + sheaths in the autumn. This is probably because the LAI measured by LAI 2000 LA-2000 canopy analyser is not the absolute LAI but rather a calculated value that considers any structures that shade the device, such as green leaves.
Both Aries and Aruana grew more in summer and autumn, probably due to the more plentiful availability of water, higher temperatures and the great plasticity that these grasses present, because both are grasses native to tropical climates, as mentioned by Campos et al. (Reference Campos, Nicácio, Sarmento, Cruz, Santos, Faria, Ferreira, Conceição and Lima2016), Giacomini et al. (Reference Giacomini, Da Silva, Sarmento, Zeferino, Trindade, Souza, Guarda, Sbrissia and Nascimento2009) and Carvalho and Giacomini (Reference Carvalho and Giacomini2005), who evaluated, respectively, the Xaraes, Marandu and Aruana grass cultivars. These authors affirmed that the adaptive plasticity of the evaluated grasses is evident in their great ability to form new aerial and basal tillers, thus contributing to the formation and composition of the leaf area. In addition, the authors mentioned that these tropical grasses have a high capacity for tiller adaptation according to seasonal variations in factors such as air temperature, rainfall and applied grazing management. Pedreira et al. (Reference Pedreira, Silva, Guimarães, Pequeno and Tonato2018), evaluating Cynodon cultivars in the summer under two distinct management strategies – 95% LI (pre-grazing height 25 cm) and a fixed period of 28 days – found similar FA values in the summer for both strategies, a direct reflection of the strategy employed.
The expectation was that the lower pre-grazing height would provide a lower leaf blade percentage. However, the opposite occurred in the winter of 2006 and 2007. In other words, there was a higher proportion of leaf blades but less production of forage mass, accumulation of forage and production green leaf blades, and a higher amount of dead material.
At lower forage canopy heights, the expectation was that the tillers would remain more erect. This occurred in winter when the forage canopy was at a lower pre-grazing height. There was no definitive pattern, but the environment and management adopted influenced the structural conformation of the forage canopy. Light interception is regulated by several factors, such as the botanical/morphological composition of the pasture, plant growth habit, canopy structure and proportion of leaf blades in the forage canopy. In this way, the FA rate varies according to the morphology of each forage plant (Sheehy and Cooper, Reference Sheehy and Cooper1973) and the management adopted. Carnevalli et al. (Reference Carnevalli, Da Silva, Bueno, Uebele, Bueno, Hodgson, Silva and Morais2006) and Barbosa et al. (Reference Barbosa, Nascimento, Euclides, Zimmer and Torres Junior2007) observed that before reaching 95% LI by the forage canopy, the FA of the species P. maximum Jacq. (Mombasa and Tanzania cultivars) was due mainly to the accumulation of leaves, while above 95% LI, there was a lower accumulation of leaves and a marked increase in the accumulation of stalks and dead material.
The higher forage height of Aries and Aruana cultivars in the summer probably resulted in the greater post-grazing height, where 45 and 44% of the stems were in the forage canopy, respectively, estimated from the proportion of leaves present (55 and 56%, respectively, Table 1). The greater forage height in 2006 and 2007 also resulted in a higher accumulation of forage and forage mass in the summer, in the condition of LI close to 95% (94.6%). According to Carnevalli et al. (Reference Carnevalli, Da Silva, Bueno, Uebele, Bueno, Hodgson, Silva and Morais2006) and Barbosa et al. (Reference Barbosa, Nascimento, Euclides, Zimmer and Torres Junior2007), the canopy height in the pre-grazing condition is strongly associated with the LI values. The canopy height can be used as a grazing management criterion because, in addition to providing adequate forage canopy structure, it is associated with higher nutritional value, meeting the consumption and performance requirements of ruminants. These authors also verified that greater canopy height was associated with increased nutritional value in response to the management imposed on the evaluated grasses.
There were also higher contents of NDF and ADF of Aries and Aruana grasses in the summer, and consequently lower DM digestibility of the grass samples of stems + sheaths. The proportions and quality of the stems, the amount of dead material and the lower LAI were a consequence of the effects of leaf shading and competition for light. This probably had repercussions on both the efficiency of the use of light and on the digestibility of the DM of the grasses. A similar pattern occurred in the spring, when the agronomic and grazing management of defoliation positively influenced the DM digestibility of the leaf blades, stems + sheaths and the whole plant of the evaluated grasses. However, even below 95% LI, the grasses may show variations in the structural and bromatological composition as a function of the edaphoclimatic conditions (Fig. 1). Pedreira et al. (Reference Pedreira, Silva, Guimarães, Pequeno and Tonato2018) and Silva (Reference Silva, Pedreira, Sollenberger, Carvalho, Tonato and Basto2015) mentioned that the pre-grazing target height at LI above 95% causes grass senescence, a drastic increase in the stem growth rate and decreases in the nutritional value and the proportion of leaves in grasses, thus reducing grazing efficiency and animal productivity.
However, the residual forage mass determines the changes in the participation and spatial arrangement of leaves, stalks and senescent material, thus altering the quantity and quality of forage available to grazing animals (Stobbs, Reference Stobbs1975). Pastures managed with lower post-grazing residue may have a higher proportion of leaves in the forage mass. This was also found by Hodgson (Reference Hodgson1990), who reported that more intense defoliation reduces the growth of forage plants due to the smaller LI, but this can be totally or partially compensated by the optimal use of the accumulated forage, and thus by the reduction in the losses due to uncollected forage.
There is evidence of differences, although small, between cultivars concerning grazing management. Other studies have also shown that the recommended height of entry of the animals into the paddocks of the Tanzania and Mombasa cultivars are distinct (Carnevalli et al., Reference Carnevalli, Da Silva, Bueno, Uebele, Bueno, Hodgson, Silva and Morais2006 and Barbosa et al., Reference Barbosa, Nascimento, Euclides, Zimmer and Torres Junior2007, respectively). This observation was related to differences in morphological characteristics between cultivars. In comparisons between the seasons, in the present experiment the pre-grazing heights of the cultivars Aries and Aruana were greater in summer and spring 2006 and smaller in autumn and winter 2007. Probably in the first grazing cycle (summer), after grazing the plants were still adapting to the imposed management strategy. In this sense, the decrease of the pre-grazing height in the autumn relative to the summer is related to the fact that the forage plants modify their growth pattern, becoming more prostrate, as a way to survive intense and frequent grazing.
Giacomini et al. (Reference Giacomini, Batista, Gerdes, Mattos and Otsuk2015) mentioned that the Aruana grass is very flexible to different management strategies and is tolerant of intensive defoliation up to 10 cm, as long as there is no limitation of nitrogen fertilization. Zanini et al. (Reference Zanini, Santos and Sbrissia2012), using Aruana grass with a 95% LI criterion, obtained a grass height of 30 cm and a post-grazing height of 15 cm, producing higher FA mass and greater control of shoot elongation. In the current study, the pre-grazing heights, with LIs of 94.6 and 94.9% in summer and spring, were 36 and 33 cm, respectively, and the post-grazing heights were 15 and 14 cm respectively. Moreover, Aruana grass in summer and spring had the highest values of FA and forage mass. However, regarding the annual average, the pasture stabilization height of Aruana grass was 28.7 cm, close to the 30 cm obtained by Zanini et al. (Reference Zanini, Santos and Sbrissia2012). Carnevalli et al. (Reference Carnevalli, Da Silva, Bueno, Uebele, Bueno, Hodgson, Silva and Morais2006) mentioned that long rest periods result in undesirable changes in forage canopy structure, characterized by increased participation of stalks and dead material in the canopy profile. This may result in forage losses due to grazing, both by the amount of unwanted material and physical damage caused by the animals, negatively influencing the grazing efficiency (Carnevalli et al., Reference Carnevalli, Da Silva, Bueno, Uebele, Bueno, Hodgson, Silva and Morais2006) and nutritional value (Da Silva et al., Reference Da Silva, Bueno, Carnevalli, Silva and Chiavegato2020).
In the autumn there was higher LAI, lower pre-grazing heights, similar leaf blade percentage and less accumulation of forage, green leaf blade production and forage mass compared with summer of both years. These factors resulted in higher contents of CP, NDF and hemicellulose and lower ADF and lignin contents, and consequently greater DM digestibility of the leaf blades, stems + sheaths and whole plants of both cultivars. According to Silva et al. (Reference Silva, Silva, Barreto, Junior, Paes, Ruas and Queiros2012), greater availability of N and water and soil and greater solar radiation increase the photosynthetic efficiency, which activates the enzymes RuBisCO (ribulose 1,5-bifosfate carboxylase oxygenase) and PEP (phosphoenolpyruvate carboxylase), thus increasing leaf blade CP. The increase in the CP of the leaf blades, stems + sheaths and whole plants of the Aries and Aruana cultivars in the present experiment probably occurred due to the higher photosynthetic efficiency provided by nitrogen fertilization in the soil. On the other hand, the increase in the pre-grazing height of the cultivars in the spring may have been be due to the residual effect of nitrogen applied in the soil in late summer and near the beginning of autumn. This is also a reflection of the availability of water and ambient temperature at the time. This means that the spacing between the clumps was filled by leaves and stems with a greater forage canopy height during the spring of 2006 and 2007, which was associated with greater leaf blade percentage, accumulation of forage, forage mass and green leaf blade production. Nevertheless, it was possible to maintain the height of the grazing residue close to 15 cm, as initially established for management with sheep under the 95% LI criterion.
Regarding the stems + sheaths, the highest DM digestibility values were observed in the spring and the second highest pre-grazing height in 2006 and 2007. These results may be linked to lower contents of ADF and lignin and higher contents of NDF, cellulose and hemicellulose. Probably at this time the plants undergo intense cell renewal and growth due to spring rains of 46–80 mm per day and high temperatures near 31 °C (Fig. 1, GC 7-8). In the summer, there were similar contents of DM of the stems + sheaths of grass in relation to the other seasons. However, there were lower CP and hemicellulose contents, considering that stems + sheaths showed higher NDF, ADF and cellulose contents in both Aries and Aruana grasses, which resulted in lower DM digestibility. However, Aries grass produced stems + sheaths with higher CP contents in autumn, winter and spring and lower NDF contents in summer, autumn and spring than those of Aruana grass, although the DM digestibility results were similar, thus showing that Aries grass has the same potential as Aruana grass. The summer, autumn and spring periods coincided with a greater accumulation of forage and forage mass, e.g., greater plant growth, explaining the higher NDF, ADF and cellulose contents.
The major changes that occur in the nutritional value of forage species are those that accompany their maturation. As the plant ages physiologically, the percentages of structural carbohydrates and lignin increase, while those of soluble carbohydrates tend to decrease, especially after flowering. Lignin creates a physical barrier to the action of fermenting microorganisms in the rumen, reducing feed digestibility and consequently animal performance. Campos et al. (Reference Campos, Lanna, Bose, Boin and Sarmento2002) found a linear decrease in the DM degradability of elephant grass leaves and shoots as a function of plant maturity (from 45 to 105 days of regrowth) due to the consequent increase in the lignin content in the plants, from 32 to 50 g/kg. Da Silva et al. (Reference Da Silva, Bueno, Carnevalli, Silva and Chiavegato2020) obtained an increase in the nutritional value of Mombasa grass (112 g/kg of CP, 381 g/kg of ADF and 581 g/kg of in vitro organic matter digestibility) when grazing was started with 95% LI of the forage canopy and 50 cm pre-grazing height. And Euclides et al. (Reference Euclides, Lopes, Nascimento, Da Silva, Difante and Barbosa2015) obtained a large weight gain of beef heifers on rotationally grazed Mombasa grass managed with 95% LI of the forage canopy and 50 cm pre-grazing height. Probably these responses in weight gain were associated with the management and nutritional value of grasses. In the present experiment, Aries and Aruana grasses presented similar or superior responses in terms of sheep grazing efficiency and nutritional value.
In the whole plant of both Aries and Aruana cultivars, there was higher NDF, ADF, lignin and cellulose content and lower levels of CP and hemicellulose in Summer than in other seasons. These results coincide with the time when there was greater pre-grazing height, higher AF and forage mass in both years, although the DM content was only lower in Aruana grass in summer and autumn. However, the lower CP and hemicellulose contents and higher contents of ADF and lignin provided the lowest numerical results for DM digestibility of the whole plant in the summer season, with no significant differences between seasons. These same observations apply to autumn, winter and spring. This is probably a reflection of the intense growth of the grass in summer, evidenced by the greater accumulation of forage and forage mass, which led to an increase in the contents of thatch and senescent and dead material. Aries grass had a higher DM digestibility value than Aruana grass, probably due to the lower content of ADF, NDF and cellulose and the higher CP content, regardless of the season.
Campos et al. (Reference Campos, Nicácio, Sarmento, Cruz, Santos, Faria, Ferreira, Conceição and Lima2016) reported that during fast growth, the fibrous portions, mainly cellulose and hemicellulose, accumulate together with lower accumulation of lignin. However, the accumulation of lignin in the grass is accelerated under conditions of intense growth during periods of climatic variation, mainly during periods of water stress, and also from the effects of defoliation caused by animal grazing. Another explanation of the low CP content and high fibrous fraction of the whole plants in the present experiment is related to excess water in the soil, which also interferes with the nutrient absorption process as a plant defence mechanism, as mentioned by Larch (Reference Larch2004, Reference Larch1994), Campos et al. (Reference Campos, Nicácio, Sarmento, Cruz, Santos, Faria, Ferreira, Conceição and Lima2016) and Pequeno et al. (Reference Pequeno, Pedreira, Sollenberger, Faria and Silva2015). In this sense, Hughes et al. (Reference Hughes, Mlambo, Jennings and Lallo2014) reported that forage digestibility is influenced by a combination of factors rather than by isolated factors. This agrees with the results obtained by Campos et al. (Reference Campos, Nicácio, Sarmento, Cruz, Santos, Faria, Ferreira, Conceição and Lima2016), who verified changes in the nutrient composition of Xaraes grass according to changes in the physical structures of the grass, which resulted in alterations in digestibility according to the grazing cycle, environmental conditions and nitrogen fertilization doses.
When evaluating the grass cultivars, we observed that in the autumn, the grasses had lower DM, NDF, ADF and cellulose contents, higher hemicellulose contents and similar lignin contents than in the summer, which provided numerically higher digestibility results for whole plant DM in autumn. However, Aries grass showed the best whole-plant DM digestibility response, independent of the season, due to the lower DM, ADF and cellulose contents. While the Aruana grass presented the highest contents of NDF, ADF and cellulose, the lignin and hemicellulose remained similar. Although in winter the whole plant of the Aries and Aruana cultivars presented higher DM content, we believe this was due to the concentration effect of the water deficit and lower forage mass. In this sense, the CP, NDF, ADF, cellulose and hemicellulose contents were lower in winter in the whole plant of the Aries and Aruana cultivars and the DM digestibility was similar but numerically smaller in all seasons. Another factor that may be related to these results is the plasticity of Aries and Aruana cultivars in the formation of new aerial and basal tillers. These increase the nutritional quality of the forage mass, and in turn are explained by the increased DM digestibility responses, but are linked to the N fertilization during the late summer and early autumn rains. Lima et al. (Reference Lima, Abdalla Filho, Lima, Sakita, Silva, McManus, Abdalla and Louvandini2018) observed that forage grasses with high contents of CP and N have greater digestibility coefficients of organic material by the ruminal microbiota. These authors also reported that the increase in digestibility is related to the nitrogen availability of the forage, which stimulates microbial growth and thus ruminal efficiency. This was also observed in the present experiment, but with the great effective contribution of the fibrous fractions of the forages to DM digestibility.
Thus, pasture management, sheep grazing management and climatic variations within each grazing cycle (Fig. 1) influence both the agronomic growth and the development responses of Aries and Aruana cultivars, as well as the bromatological composition and digestibility of the leaf blades, stems + sheaths and whole plant. The above information is in agreement with Sinclair and Seligman (Reference Sinclair and Seligman1995) regarding the age of grasses. These authors mention that with the increase in environmental temperature, there is an acceleration of pasture maturation, which causes changes in the chemical and morphological composition of the pasture, especially in the proportion of leaves and stems, which in turn alters the nutritional value of tropical forage. These results are in agreement with those obtained by Campos et al. (Reference Campos, Nicácio, Sarmento, Cruz, Santos, Faria, Ferreira, Conceição and Lima2016) with Xaraes grass under conditions of pasture management, in different grazing cycles with dairy cattle. According to Van Soest (Reference Van Soest1994), the ambient temperature in the tropics acts intensely on the physiological and metabolic activities of plants during the formation of the structural components. In this sense, Dove (Reference Dove, Hodson and Illius1996) reported that the connection between cellulose and lignin is essential for the physical resistance of the plant. However, Campos et al. (Reference Campos, Nicácio, Sarmento, Cruz, Santos, Faria, Ferreira, Conceição and Lima2016) mentioned that, for animal nutrition, the increase in this physical resistance of the plant represents a negative factor for chewing, rumination, microbial colonization and digestion of DM.
In this sense, it is essential for the management of pastures to be based on the pre-grazing level, which is close to the 95% LI criterion, and a post-grazing residue height near 15 cm. These factors guarantee the maintenance of the nutritional quality of the grass, mainly the fibrous content, and consequently increased performance of grazing sheep. This agrees with Costa et al. (Reference Costa, Bueno, Veríssimo, Cunha, Santos, Oliveira, Spósito Filho and Otsuk2007), who verified better performance responses of Santa Ines sheep in rotational grazing with Aruana grass under tropical conditions. These authors adjusted the stocking rate in Aruana grass paddocks according to the forage mass and managed the grass over a fixed period, always taking into account the maintenance of the height of post-grazing residue at 15–20 cm. A higher nutritional value of Aruana grass was obtained during the rainy season, mainly due to the CP content of 112 g/kg. This response explained the lower level of parasitic infection of the animals after slaughter. The authors argued that the quality of grass provided an improvement in the immunological resistance of the animals, which led to high daily weight gains. In this sense, the results of chemical composition and digestibility presented in the present experiment probably provided greater responses in animal performance. The likely responses of animal performance could be confirmed by the mean CP contents and in vitro digestibility of whole Aries and Aruana plants were 154 v. 145 g/kg and 682 v. 642 g/kg, respectively, as a reflection of pasture management a 95% LI and nitrogen fertilization and post-grazing height control around 15 cm.
Tropical forage has been referred to as having a low nutritional value compared with that in temperate climates, mainly in relation to DM digestibility, CP content and fibre content. These observations are primarily due to the nature of C4 v. C3 grass species (Wilman et al., Reference Wilman, Mtengeti and Mosely1996). On the other hand, pastures formed by highly digestible and palatable plants but producing reduced amounts of dry mass contribute little to the production of meat and milk. Tropical forages have greater potential for dry mass production, and, with proper management measures to evaluate the nutritional value and supply of forage, it is possible to provide animals with good quality food, thus supplying their nutritional requirements.
Thus, it can be said that the Aries and Aruana grass cultivars have competitive potential with other commercial grasses existing in Brazil and in countries with tropical and subtropical climates. These two cultivars have high nutritional value, especially when compared with grasses of the genus Brachiaria spp. In comparison with the Aruana grass in this study, the management of Brachiaria brizantha, cultivar Xaraes, with nitrogen fertilization at doses ranging from 125 to 625 kg/N/ha/year, presented a maximum CP level of 122−151 g/kg (Campos et al., Reference Campos, Nicácio, Sarmento, Cruz, Santos, Faria, Ferreira, Conceição and Lima2016). In the autumn season, the Aruana grass presented a whole-plant CP of 191 g/kg and a leaf blade CP of 246 g/kg, after receiving 250 kg of N/ha/year in 2006 and 150 kg of N/ha/year in 2007. Although both grasses, Xaraes and Aruana, have close production potential, with close use of nitrogen fertilization (125 v. 150 N/ha, respectively), the total mass production of Xaraes grass was 16 755 kg DM/ha/year (Campos et al., Reference Campos, Nicácio, Sarmento, Cruz, Santos, Faria, Ferreira, Conceição and Lima2016), while that of Aruana grass was 13 430 kg DM/ha/year (in 2007). The difference may be related to the handling of LI that was adopted for Aruana grass. Thus, the potential of Aruana grass was demonstrated, and the same applies to Aries grass, with a total mass production of 14 185 kg DM/ha/year (in autumn of 2007), leaf-blade CP of 246 g/kg and whole-plant CP of 195 g/kg.
With regard to animal handling and the grass fertilization (mainly nitrogenous), the grass cultivars Aries and Aruana provide the necessary nutrients for increase performance of small ruminants, especially sheep. These grasses are small in stature and easy to handle, display caespitose growth, respond to nitrogenous fertilizers. These grasses also had high growth potential and nutritional value even in autumn and winter, which is a distinct trait from other grasses. However, these grasses produced less mass.
Therefore, 29 cm is the recommended height for grazing in paddocks of the two grasses. This also corresponds to the proximity of the average height of the forage canopy in the four seasons of the year. The establishment of the residue target post-grazing closed to 15 cm was due to the length of stay of sheep in the pasture and the ability to promote less grazing residue. In addition, low residue leads to problems of recontamination with gastrointestinal parasitic larvae, the main sanitary problem of sheep.
Conclusion
The heights of the forage canopy established using 95% LI, together with strategic management of nitrogen fertilization and a fixed height of post-grazing residue close to 15 cm, allowed maintenance of the nutritional quality of Aries and Aruana cultivars in the four seasons of the year. The height of stabilization of the forage canopy of Aries and Aruana cultivars recommended for entry of the sheep into the paddocks is 29 cm for both cultivars. The established management of Aries and Aruana cultivars provided a similar accumulation of forage. Aruana grass showed a higher proportion of leaf blades, even in winter. Handling of the input height established in the paddocks of fertilized Aries and Aruana cultivars provided forage mass with higher nutritional value.
Acknowledgements
The authors are grateful for the financial support by Sao Paulo Research Foundation (FAPESP).
Financial support
The current study was financially supported by Sao Paulo Research Foundation (FAPESP, grant n° 2004/13098-0), SP, Brazil.
Conflicts of interest
The authors declare that there are no conflicts of interest.
Ethical standards
Not applicable.


