Introduction
The Corynoneura group (Chironomidae) is a large and ecologically diverse taxon containing over 180 species of non-biting midges worldwide and at least 42 in the Neotropical region. These minute (0.5–1.5 mm) dipterans are found in a broad range of aquatic habitats and are especially diverse in mountain streams in the Atlantic Forest (Wiedenbrug & Trivinho-Strixino, Reference Wiedenbrug and Trivinho-Strixino2011). The larvae seem to be particularly abundant on litter and stones of streams, and they are associated with macrophytes from lentic habitats (Sanseverino & Nessimian, Reference Sanseverino and Nessimian2001; Henriques-Oliveira et al., Reference Henriques-Oliveira, Dorvillé and Nessimian2003).
The Atlantic Forest has been identified as a biodiversity hotspot of global significance due to its high concentration of endemic taxa and vulnerability to processes that threaten its unique biodiversity (Myers et al., Reference Myers, Mittermeier, Mittermeier, Fonseca and Kent2000). The enormous biodiversity of this biome results in part from the wide range of latitude it covers, its variations in altitude, its diverse climatic regimes as well as the geological and climatic history of the whole region (Galindo-Leal & Câmara, Reference Galindo-Leal and Câmara2003). Currently, the coverage of the Atlantic Forest in Southeast Brazil also has been significantly reduced due to a long process of exploitation and degradation (Zaher et al., Reference Zaher, Barbo, Martínez, Nogueira, Rodrigues and Sawaya2011).
The Corynoneura group comprises nine valid genera: Corynoneura Winnertz, Corynoneurella Brundin, Ichthyocladius Fittkau, Onconeura Andersen et Sæther, Notocladius Harrison, Physoneura Ferrington et Sæther, Tempisquitoneura Epler, Thienemanniella Kieffer and Ubatubaneura Wiedenbrug et Trivinho-Strixino. The adult identification of this group is based mostly on genitalic structures, as for many other Chironomidae. Their morphology-based identification is often difficult, especially for non-experts, and often demands time-consuming genitalic dissections. The identification of adults of the Corynoneura group is further complicated by a lack of diagnostic morphological features to distinguish several species. Moreover, identification of some species can be achieved only by individual rearing of larvae and collecting larval and pupal skins to establish the associations between life stages. Despite these drawbacks, the group has recently been studied taxonomically in East Asia and in the Afrotropical, Nearctic and Neotropical regions (e.g., Fu et al., Reference Fu, Sæther and Wang2009, Reference Fu, Hestenes and Sæther2010a , Reference Fu, Sæther and Wang b ; Wiedenbrug & Trivinho-Strixino, Reference Wiedenbrug and Trivinho-Strixino2009, Reference Wiedenbrug and Trivinho-Strixino2011; Wiedenbrug et al., Reference Wiedenbrug, Mendes, Pepinelli and Trivinho-Strixino2009, Reference Wiedenbrug, Lamas and Trivinho-Strixino2012, Reference Wiedenbrug, Lamas and Trivinho-Strixino2013; Fu & Sæther, Reference Fu and Sæther2012). Consequently, species-level keys as well as extensive reference collections are available for most of the genera, making this an ideal group of Chironomidae for investigating molecular/morphological correspondence.
The family Chironomidae has been increasingly studied from the perspective of DNA barcoding. Most published studies involving the cytochrome c-oxidase subunit I (COI) gene in chironomids have used sequence data to perform phylogenetic analyses (e.g., Allegrucci et al., Reference Allegrucci, Carchini, Todisco, Convey and Sbordoni2006; Martin et al., Reference Martin, Blinov, Alieva, Hirabayashi and Andersen2007), delimit species (e.g., Carew et al., Reference Carew, Marshall and Hoffmann2011; Silva et al., Reference Silva, Ekrem and Fonseca-Gessner2013), document species diversity (e.g., Ekrem et al., Reference Ekrem, Stur and Hebert2010a ), biomonitor environmental changes (Brodin et al., Reference Brodin, Ejdung, Strandberg and Lyrholm2012) and associate different life stages based on genetic similarity (e.g., Stur & Ekrem, Reference Stur and Ekrem2011). DNA barcoding employs a short gene fragment to identify species. It represents a shift from the near-exclusive reliance on morphological features for the identification and delimitation of species to an approach that includes molecular characters in species discrimination (Ekrem et al., Reference Ekrem, Stur and Hebert2010a ).
Orthocladiinae is the second most diverse chironomid subfamily after Chironominae (Ashe & Cranston, Reference Ashe, Cranston, Soos and Papp1990). It was established by Edwards (Reference Edwards1929) derived from Kieffer's Orthocladiariae group (Cranston, Reference Cranston, Armitage, Cranston and Pinder1995) and its monophyly is supported, with Prodiamesinae as its sister-group. Within the Orthocladiinae, the tribe Corynoneurini is also well supported with the studied genera Thienemanniella, Corynoneura and Notocladius (Cranston et al., Reference Cranston, Hardy and Morse2011).
In this study, we use DNA barcodes for species delimitation in order to solve taxonomic conflicts in the Corynoneura group (Orthocladiinae) in the Atlantic Forest. We use sequences from mitochondrial COI to determine genetic groups in the Corynoneura group and examine sequence variation between and within these groups. Our study focuses on the genera that occur in the benthic fauna of streams in the Atlantic Forest; these are Corynoneura, Onconeura, Thienemanniella and Ubatubaneura, which were previously revised by the second author.
Material and methods
The taxa included in this study were selected to represent as many species of the Corynoneura group as possible. Fieldwork was conducted in streams of the Atlantic Forest, Southeast Brazil. The material was initially collected for taxonomic studies. Adults, pharate adults and pupal exuviae were collected with drift nets. Living larvae were collected with hand nets and isolated in small boxes (1 cm×1 cm) half-filled with stream water. Neither substratum nor food was given, except for some detritus carried over with the water. Boxes were checked twice a day for emerged specimens. The larval and pupal exuviae and the adults were preserved in 96% ethanol.
Tissue for DNA extraction was sampled under a stereo microscope and shipped to the Canadian Centre for DNABarcoding at the University of Guelph (CCDB, www.dnabarcoding.ca) for sequence analysis. The remainder of most of the sampled specimens were macerated in KOH and slide-mounted in Euparal (BioQuip, Rancho Dominguez, CA, USA) for species identification with a compound microscope. Morphological identification of species of Onconeura and Ubatubaneura was based on the available literature (Wiedenbrug & Trivinho-Strixino, Reference Wiedenbrug and Trivinho-Strixino2009, Wiedenbrug et al., Reference Wiedenbrug, Mendes, Pepinelli and Trivinho-Strixino2009), while species of Corynoneura and Thienemanniella were described and included in part as type material (Wiedenbrug & Trivinho-Strixino, Reference Wiedenbrug and Trivinho-Strixino2011; Wiedenbrug et al., Reference Wiedenbrug, Lamas and Trivinho-Strixino2013). Nomenclature and abbreviations follow Sæther (Reference Sæther1980).
DNA extraction, PCR and sequencing followed standard protocols and primers at the CCDB. Sequence information was entered in the Barcode of Life Database (BOLD, www.barcodinglife.org) along with an image and collateral information for each voucher specimen. The detailed specimen records and sequence information, including trace files, are available in BOLD under the project ‘DNA Barcoding Chironomidae Brazil’ (MPSW). All sequences have been submitted to GenBank (Appendix).
A maximum likelihood (ML) tree was produced in MEGA 5.03 (Tamura et al., Reference Tamura, Peterson, Peterson, Stecher, Nei and Kumar2011) using the general time reversible model with invariable sites and gamma correction for rate heterogeneity (GTR+G+I), as the latter has been found as the most appropriate model of nucleotide substitution for our dataset by hierarchic likelihood ratio test in MEGA 5.03 (− lnL=6051.349, BIC=14061.461, AIC=12461.841). Bootstrap-analysis used 1000 pseudoreplicates (Felsenstein, Reference Felsenstein1985). The analyses of neighbour-joining and intra- and interspecific genetic distances were based on the Kimura-2-parameter (K2-P) model (Kimura, Reference Kimura1980) for easier comparison with other barcode studies and were also calculated with MEGA 5.03.
Additionally, we compared the former sequences to the full Corynoneura group dataset in BOLD in order to observe how our species groups would be defined when compared with other species of the Corynoneura group from other regions of the world. The sequences were selected using the BOLD identification engine. Only sequences published in GenBank were considered.
Results
Partial COI gene sequences were obtained from 86 specimens of 14 species and three morphotypes belonging to the Corynoneura group (Appendix). Most of them were adults with associated pupal and larval exuviae. Corynoneura ferelobata, Corynoneura fortispicula, Corynoneura mediaspicula, Corynoneura sertaodaquina, Corynoneura unicapsulata, Onconeura oncovolsella, Onconeura cf. semifimbriata and Onconeura similispina composed well-supported monophyletic groups which were fully congruent with the morphological characteristics (fig. 1). Corynoneura mineira and Ubatubaneura atlantica were represented by single individuals.

Fig. 1. ML tree of the Corynoneura group, based on partial COI sequences (DNA barcodes) and the generalized time reversible substitution model. Numbers on branches are bootstrap values >80%.
The specimens identified morphologically as Onconeura japi were divided into two separate barcode groups (fig. 1). Nucleotide sequences of these specimens differed by a minimum of 13.87% and in up to 102 nucleotide sites. The pupae of group 1 (fig. 2a, b) present abdominal tergite VI with oral shagreen grouped and L3 seta elongated similar to L2 seta, whereas the pupae of group 2 (fig. 2c, d) exhibit abdominal tergite VI with oral shagreen sparsely distributed and L3 seta short similar to L4. Similarly, the specimens identified as O. similispina also formed two distinct groups, but no morphological differences were observed. Nucleotide sequences of these specimens diverged by a minimum of 11.61% and up to 93 nucleotide sites.

Fig. 2. (a–d) Onconeura japi. (a–b) O. japi (group 1). (a) Tergite VI showing chaetotaxy and shagreen grouped distributed. (b) Sternite IV showing shagreen distribution and elongated lateral setae 3 (L3). (c–d) O. japi (group 2). (c) Tergite VI showing chaetotaxy and shagreen sparsely distributed. (d) Sternite IV showing shagreen distribution and short lateral setae 3 (L3).
DNA barcode sequences also indicated that two groups represented related species. Thienemanniella sp. group 1 (fig. 1) resembled Thienemanniella sp. group 2 (fig. 1) in all morphological diagnostic characters. Based on the molecular analysis some morphological differences in pupal characters could be observed. The differences are in the shape of the posterior spines of the male abdominal sternite VIII, and the displacement of Dc1 to ventral. Nucleotide sequences of these specimens differed by a minimum of 17.5% and in up to 106 nucleotide sites. Additionally, Ubatubaneura sp., a female without associated immatures, previously identified as U. atlantica, was also recognized as a possible distinct species; however, we could not link it to any morphological variation. Nucleotide sequences of U. atlantica and U. sp. differed by a minimum of 11.6% and in up to 66 nucleotide sites. Furthermore, the morphotypes Corynoneura sp. sexadentata and Corynoneura sp. septadentata gr. were represented by two groups, although no morphological variation was observed. Nucleotide sequences of these specimens differed by a minimum of 14.9% and up to 87 nucleotide sites.
In this study, the aligned sequences were 659 bp long with 260 variable sites (46.5%), of which 242 (93.1%) were parsimony-informative. Most variable sites occurred in the third codon-position (Table 1). The sequences were heavily AT-biased, specifically in the third position which showed a combined average AT-composition of 88.6% (Table 1). The pairwise distances for the analysed specimens, produced by the K2-P model, showed distinctly larger interspecific than intraspecific divergences (Table 2). All species were distinguishable by genetic distances. Average intra- and interspecific K2-P distances for all analysed species were 2.29% and 18.28%, respectively. Maximum intraspecific divergence was observed in O. japi (14.84%), followed by Corynoneura similispina (12.18%) and C. fortispicula (6.70%) (Table 2). Lowest interspecific distances were found between U. atlantica and U. sp. (average 11.6%), followed by C. ferelobata and U. sp. (average 12.2%).
Table 1. Variable and informative sites and average nucleotide composition in the analysed COI gene sequences.
Table 2. Summary of intra- and interspecific Kimura 2-parameter distances between morphological species of the Corynoneura group. N/A indicates species with only one specimen examined.

A ML tree (fig. 1) demonstrated that a substantial barcode divergence exists between all the analysed species of the Corynoneura group. For comparison, a neighbour-joining tree was also produced and yielded almost identical trees, except for C. mineira, which groups with C. sp. sexadentata+C. sp. septadentata gr.+O. oncovolsella+Onconeura cf. semifimbriata as its closest cluster (data not shown). Bootstrap support exhibited minor variation among all analyses, but were always 96% or higher for all species groups.
Molecular analysis of COI gene sequences from 151 specimens of the full Corynoneura group dataset in BOLD supported 33 cohesive groups (fig. 3). A ML tree showed a significant barcode divergence between all the analysed groups (fig. 3). Bootstrap support was always 99% or higher for all groups. In short, groups obtained in the original data set were maintained, and the previous species already in BOLD also composed monophyletic groups.

Fig. 3. ML tree of the full Corynoneura group data set in BOLD (only sequences in GenBank were analysed), based on partial COI sequences (DNA barcodes) and the generalized time reversible substitution model. Numbers on branches are bootstrap values >90%.
Discussion
DNA barcodes have proven useful for identifying a variety of chironomid species (Carew et al., Reference Carew, Pettigrove and Hoffmann2005, Reference Carew, Pettigrove, Cox and Hoffmann2007; Stur & Ekrem, Reference Stur and Ekrem2011; Silva et al., Reference Silva, Ekrem and Fonseca-Gessner2013). We found COI useful for summarizing the sequence diversity and detecting taxonomically challenging species and species groups within the Corynoneura group from the Atlantic Forest. The most common species previously described by means of morphology were linked to molecular markers. Similarly, Ekrem et al. (Reference Ekrem, Willassen and Stur2007) were able to associate species of Micropsectra (Chironominae) previously described based on morphological criteria to genetic markers. A ML tree based on analysis of pairwise COI distances of the Brazilian species of the Corynoneura group indicated that most species showed substantial barcode divergence, but there was some evidence for cryptic diversity.
There is strong evidence for at least three groups indicating new species in the Corynoneura group in southeast Brazil. Specimens of the two observed groups of Thienemanniella were collected from two ecosystems in São Paulo State, one in São Carlos municipality and one in Ubatuba municipality (Appendix). The two groups exhibited exclusive distributions, indicating some geographical structure in the grouping. These species were recently described by Wiedenbrug et al. (Reference Wiedenbrug, Lamas and Trivinho-Strixino2013) as Thienemanniella sancticaroli (group 1) and Thienemanniella ubatuba (group 2), based on the results of the present study. Likewise, Carew et al. (Reference Carew, Marshall and Hoffmann2011) morphologically delimited species of Procladius based on groups previously defined by DNA barcodes.
According to our results O. japi consists of two groups. The analysis of specimens belonging to these groups also indicated some morphological differences only noticed at the pupal stage. The diverging specimens were collected from four different sites in Southeast Brazil, three in Ubatuba municipality and one in Paraisópolis municipality (Appendix). All specimens from both the groups were collected at the two municipalities; therefore, there was no geographical structure in the grouping. Despite these minor differences, in the absence of additional evidence we hesitate to consider species distinctions among these specimens. In contrast, no morphological differences could be determined between Ubatubaneura species; only two specimens of this genus were examined, of which one was an unassociated female, thus more material is necessary to understand the variation within this genus.
Cryptic species may be present within the Corynoneura group. The taxa currently defined as O. similispina showed internal grouping of some individuals in the pairwise analyses, and no morphological variation was observed. Similarly Silva et al. (Reference Silva, Ekrem and Fonseca-Gessner2013) obtained two separate clusters of Labrundinia tenata specimens (Tanypodinae), although they were unable to determine any distinct morphological difference distinguishing the clusters. On the other hand, Sinclair & Gresens (Reference Sinclair and Gresens2008) found one cluster represented by two species of Cricotopus (Orthocladiinae), with minor genetic variation and consistent morphological differences. These results indicate that a more intensive investigation of these taxa would be needed to positively assign new species. This should include a higher number of specimens collected throughout the species range, different life stages and multiple DNA markers, particularly those from a nuclear origin.
According to Wiedenbrug & Trivinho-Strixino (Reference Wiedenbrug and Trivinho-Strixino2011) the species C. septadentata, C. sertaodaquina and the morphotypes C. sp. sexadentata and C. sp. circulimentum, the last two described as female and immatures, are very similar species with a few differences in the immature stages. In our study, it was possible to verify a clear distinction between C. sertaodaquina and C. sp. sexadentata. On the other hand C. sp. septadentata gr. was not clearly identified because of the lack of larvae, but its very fine shagreen at pupal sternite II indicates that it might be C. sp. circulimentum. In this case, more material is needed, not only to understand the group genetically, but also in order to obtain diagnostic morphological characters of the males that are still missing for both morphotypes.
The addition of other species of the Corynoneura group into the barcoding analysis was useful to confirm the species groups obtained in the original data set. Species groups with similar morphology, O. japi group 1 and 2 and Thienemanniella group 1 and 2, were sustained. Moreover, the internal grouping previously observed in O. similispina was maintained, not composing a distinct monophyletic group. The use of DNA barcodes is demonstrated to be problematic on higher geographical scales (Bergsten et al., Reference Bergsten, Bilton, Fujisawa, Elliott, Monaghan, Balke, Hendrich, Geijer, Herrmann, Foster, Ribera, Nilsson, Barraclough and Vogler2012), since in this case the intraspecific variation increases while the interspecific decreases. However, in our study, although the specimens included in the analysis of the full Corynoneura group data set were originated from different regions of the world, the species groups remained distinct and well supported.
DNA barcodes have been argued to be unreliable for consistent species identifications by many authors due to a number of drawbacks (DeSalle et al., Reference DeSalle, Egan and Siddall2005; Will et al., Reference Will, Mishler and Wheeler2005; Rubinoff et al., Reference Rubinoff, Cameron and Will2006; Ebach, Reference Ebach2011). Recent speciation, incomplete lineage sorting, interspecific hybridization and infection by endosymbiotic bacteria such as Wolbachia (Funk & Omland, Reference Funk and Omland2003; Whitworth et al., Reference Whitworth, Dawson, Magalon and Baudry2007; Foottit & Adler, Reference Foottit and Adler2009) may all interfere with the performance of DNA barcoding in insects (Virgilio et al., Reference Virgilio, Backeljau, Nevado and Meyer2010). In Chironomidae, Martin et al. (Reference Martin, Guryev and Blinov2002) verified incongruence in phylogenetic analyses of Chironomus (Chironominae) within a dataset composed of specimens from Nearctic and Palearctic populations and attributed this issue to mtDNA gene flow resulting from hybridization. However, numerous studies have been successful in species delimitation of Chironomidae (Carew et al., Reference Carew, Pettigrove and Hoffmann2005, Reference Carew, Pettigrove, Cox and Hoffmann2007; Ekrem et al., Reference Ekrem, Willassen and Stur2007, Reference Ekrem, Willassen and Stur2010b ; Sinclair & Gresens, Reference Sinclair and Gresens2008; Silva et al., Reference Silva, Wiedenbrug, Oliveira, Trivinho-Strixino and Pepinelli2012, Reference Silva, Ekrem and Fonseca-Gessner2013 and this study).
Our analysis of DNA barcode sequences using ML analyses supported 14 cohesive species groups belonging to the Corynoneura group, of which two similar groups were subsequently associated with morphological variation at the pupal stage. Eleven species previously described, based on morphological criteria, were linked to DNA markers. Moreover, there is the possibility that there may be cryptic species within the Corynoneura group, since one group of species presented internal grouping, although no morphological divergence was observed. Finally, regardless of the promising results, the incorporation of nuclear genes is valuable for species delimitation and might strengthen results, as they are independent of the maternal inherited mitochondrial genes.
Acknowledgments
The authors thank Paul Hebert and the staff at the Biodiversity Institute of Ontario, University of Guelph, Canada for sequencing the specimens used in this study. Sequencing in Guelph was supported from Genome Canada through a grant by the Ontario Genomics Institute to Paul Hebert. The authors are indebted to Mateus Pepinelli for his assistance. The authors also thank Nathan Viets for language improvements and Torbjørn Ekrem and an anonymous reviewer for comments and suggestions on the manuscript.
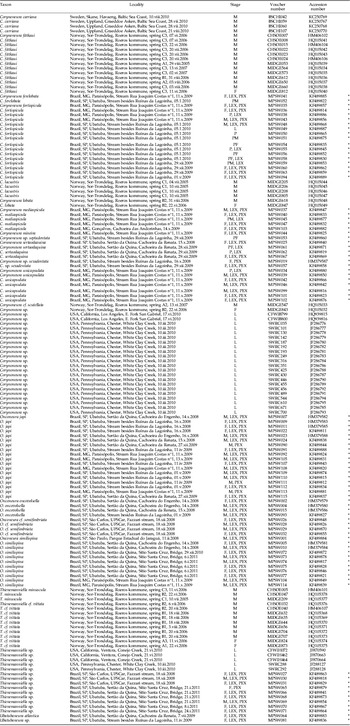
Appendix: List of analysed specimens with associated sample localities, voucher reference numbers and GenBank accessions. M=male, F=female, P=pupa, L=larva, PM=pharate male, PF=pharate female, PEX=pupal exuviae, LEX=larval exuviae. * indicates the former sequences sampled in the Atlantic Forest, Brazil.