


Introduction
The size, morphology, blood flow and nutrient transport functions of the placenta are key determinants of fetal growth velocity and birthweightReference Burton, Fowden and Thornburg1. Weighing the placenta at delivery is a potentially valuable indicator of its function in utero, and placental weight, birthweight and birthweight:placental weight have been linked to adverse perinatal outcomes and to offspring health in the longer termReference Burton, Fowden and Thornburg1–Reference Thornburg and Marshall6. Placental weight has been recorded in the Aberdeen Maternity and Neonatal Databank since the start of data collection in the 1950s and been shown to increase linearly with BMI through underweight to morbidly obese categoriesReference Wallace, Horgan and Bhattacharya3. The association between maternal BMI at conception and adverse pregnancy outcomes, including the incidence of low and high birthweight, and small- or large-for-gestational-age birth (SGA/LGA), is well documentedReference Bhattacharya, Campbell, Liston and Bhattacharya7–Reference Shin and Song12. Accordingly, underweight women have greater relative risk of low birthweight or SGA birth, while those who are obese at conception are protected from low birthweight, and more likely to have a macrosomic or LGA infant. As placental weight and birthweight at delivery are positively correlated, it follows that these associations between BMI category and birthweight may in part reflect differences in placental size. In support, the incidence of low placental weight (<10th centile)-for-gestational-age, defined using parity and gender-specific charts,Reference Wallace, Bhattacharya and Horgan13 was 50% higher in underweight women relative to normal BMI, while obese women had a twofold greater incidence of high placental weight (>90th centile)Reference Wallace, Bhattacharya, Campbell and Horgan14. However, population-based charts do not consider maternal size, and as such the strength of the association between maternal BMI and these extremes of placental weight may be being over- or understated. This may be particularly important when trying to untangle the associations between maternal nutritional status, abnormal placental development and offspring disease risk.
Thus, the main objective was to develop placental weight standards that customise for maternal height and weight and examine the relationship between maternal BMI category and the risk of placental weight extremes using a population versus customised approach. Customised standards for birthweight already exist and babies identified as SGA using this method have a stronger association with key adverse pregnancy outcomes than those detected using population-based standardsReference Gardosi and Francis15–Reference Chiossi, Pedroza and Costantine18. Accordingly, a further objective was to investigate the association between common pregnancy complications and low placental weight defined exclusively by the customised versus the population standard.
Methods
Study population and definitions
The Aberdeen Maternity and Neonatal Databank was the source of anonymised data, and the North of Scotland Research Ethics Service granted ethical approval (REC Ref 13/NS/0050) on the basis described previouslyReference Wallace, Bhattacharya, Campbell and Horgan14. Data were extracted for singleton births after 24 weeks’ gestation from 1973 to 2013. The inclusion criteria were women whose height and weight were measured by trained staff at the first antenatal visit occurring before 24 weeks gestation (median 11 weeks) and for whom parity, maternal age, placental weight, birthweight and baby gender were all documented. A number of women were excluded as their placental weights were biologically implausible (n = 149) leaving a study population of 121,591 deliveries.
Women were categorised as underweight (<18.5 kg/m2), normal (18.5–24.9 kg/m2), overweight (25.0–29.9 kg/m2), obese (30.0–34.9 kg/m2) or morbidly obese (≥35 kg/m2). Information on pregnancy complications/obstetric outcomes known to vary with maternal BMI and/or placental weightReference Wallace, Horgan and Bhattacharya3,Reference Bhattacharya, Campbell, Liston and Bhattacharya7 were summarised and assigned binary terms. These included pre-eclampsia and gestational hypertension, placental abruption, induced labour, emergency and elective Caesarean section, stillbirth and neonatal death (death of a live-born child within a week of delivery). Gestational age was recorded according to the last menstrual period and confirmed by ultrasound from 1986 forwards. Gestational age and delivery type were used to identify preterm (<37 weeks), very preterm (<32 weeks) and spontaneously delivered preterm (<37 weeks) infants.
Births were classified as small (<10th and/or <5th centiles) or large (>90th and/or >95th centiles)-for-gestational-age according to population-based charts that were parity and gender-specificReference Bonellie, Chalmers and Gray19. Customised birthweight standards were additionally adjusted for maternal height, weight and ethnicity as described previouslyReference Gardosi, Mongelli, Wilcox and Chang20, and were determined using Gestation Related Optimal Weight (GROW) software, version 8.0.1., 2018 (www.gestation.net).
Placental weight standards
Placentae were weighed untrimmed to the nearest 10 g. Placental weight was classified as low (<10th and/or 5th centiles) or high (>90th and/or >95th centiles)-for-gestational-age using previously published parity and gender-specific charts for the Aberdeen populationReference Wallace, Bhattacharya and Horgan13. Birthweight:placental weight extremes were similarly defined using gender-specific charts having established that parity did not significantly influence this parameterReference Wallace, Bhattacharya and Horgan13.
To derive coefficients for predicting normal placental weight, records where placental growth/function may have been compromised were excluded. This sequentially included cases of stillbirth (n = 660), neonatal death (n = 387), pre-eclampsia/eclampsia (n = 4858), placental abruption (n = 1247), placenta praevia (n = 474) and thromboembolism (n = 312). In addition, records where either elective caesarean section (n = 810) or induced labour (n = 2023) occurred before 38 weeks gestation were excluded as these were likely to have been clinician-led decisions arising because of fetal well-being concerns including inadequate feto-placental growth. As placentae from spontaneous preterm deliveries are potentially pathological, these were also excluded (n = 3750). A multiple regression model was fitted using the remaining 107,170 deliveries, occurring at 37–43 weeks gestation. The response variable was placental weight. The explanatory variables, which were centred around the median so that the constant term could be interpreted, were
maternal height (median = 163 cm)
maternal weight at booking (62.9 kg)
gestational age at delivery (GA, 40 weeks)
whether nulliparous (parity 0) or multiparous (parity > 1).
gender included with males (+1) and females (−1).
After visualisation of the relationship between placental weight and gestational age, polynomial quadratic and cubic terms were fitted for the centred gestational age at delivery, to account for the nonlinearity of the effect of GA. The resulting regression model has a constant which is then modified by the other terms according to the maternal characteristics.
For nulliparous pregnancies
Predicted placental weight = 627.318 + 1.512 × height deviation + 1.946 × weight deviation + 7.231 × sex + 13.429 × GA deviation − 0.953 × GA deviation2 − 0.066 × GA deviation3
For multiparous pregnancies, the constant was 659.187 g and the other coefficients were identical.
Using these parity-specific regression equations, predicted placental weight was calculated for the entire data extract (including pregnancies where placental growth/function was potentially impaired), and the difference between actual and predicted placental weight was determined. The cumulative probability distribution was calculated based on this difference using a standard deviation of 134.8 g (estimated in the prediction model) and the resulting z-score transformed to a probability and multiplied by a hundred to derive an individual placental weight centile. These customised placental weight centiles were then categorised on the same basis as above, namely low (<10th and/or 5th centiles) or high (>90th and/or >95th centiles). A similar approach was applied to predicting normal birthweight:placental weight, and in this case the cumulative probability distribution was based on a standard deviation of 1.079.
Predicted birthweight:placental weight = 5.597 + 0.0039 × height deviation − 0.0053 × weight deviation + 0.0459 × sex + 0.0927 × GA deviation − 0.0169 × GA deviation2 − 0.0023 × GA deviation3
Data analysis
Data analysis, including the development of customised placental weight standards, was carried out using Minitab (version 18, Minitab Inc., State College, PA, USA). Maternal characteristics at the first antenatal booking appointment were compared between BMI categories by one-way ANOVA for continuous variables and Tukey’s pairwise comparisons post hoc (Table 1). Chi-square tests were used to test independence among categorical variables. Average placental weight, birthweight and birthweight:placental weight per BMI category was estimated by linear regression (General Linear Model in Minitab) with adjustment for maternal age, height, smoking habit, parity, booking week, year of delivery, gestation age and gender (Table 1). The risk of placental weight and birthweight extremes as defined using population-based and customised weight standards in relation to maternal BMI category was assessed using binary logistic regression (Table 2). Crude (not shown) and adjusted odds ratios (OR) with 95% confidence intervals (CI) were calculated, with the normal BMI category acting as the reference group (OR = 1). Adjustments were made for potential confounders as above and additionally included pre-eclampsia and gestational hypertension. Logistic regression was also used to examine the association between common pregnancy complications and low placental weight defined by the population standard only, the customised standard only or both approaches: the reference category was pregnancies where placental weight was not low by either approach (Table 3).
Table 1. Maternal characteristics, birthweight, placental weight and the incidence of key pregnancy complications in relation to BMI category at booking
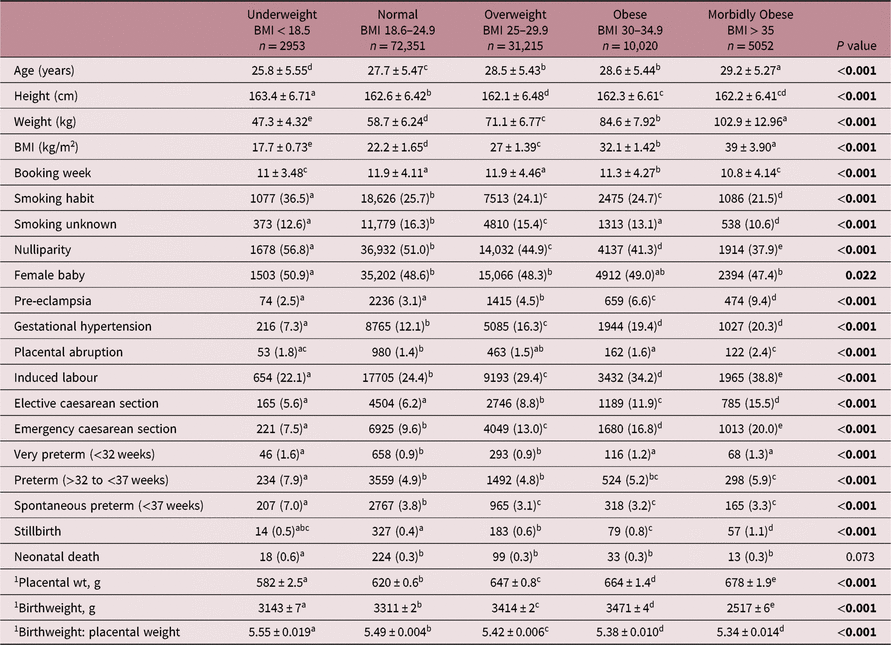
Values are mean ± standard deviation, or number (percent). Within rows values with a superscript letter in common are not different from each other, P > 0.05.
1 Fitted mean (± SEM) adjusted for maternal age, height, smoking habit, parity, booking week, year of delivery, gestation age and gender.
Significant P values are in bold.
Table 2. Frequency rate and adjusted OR for placental weight and birthweight extremes in different BMI categories using population charts compared with the customised approach. Reference category is Normal BMI (OR = 1)
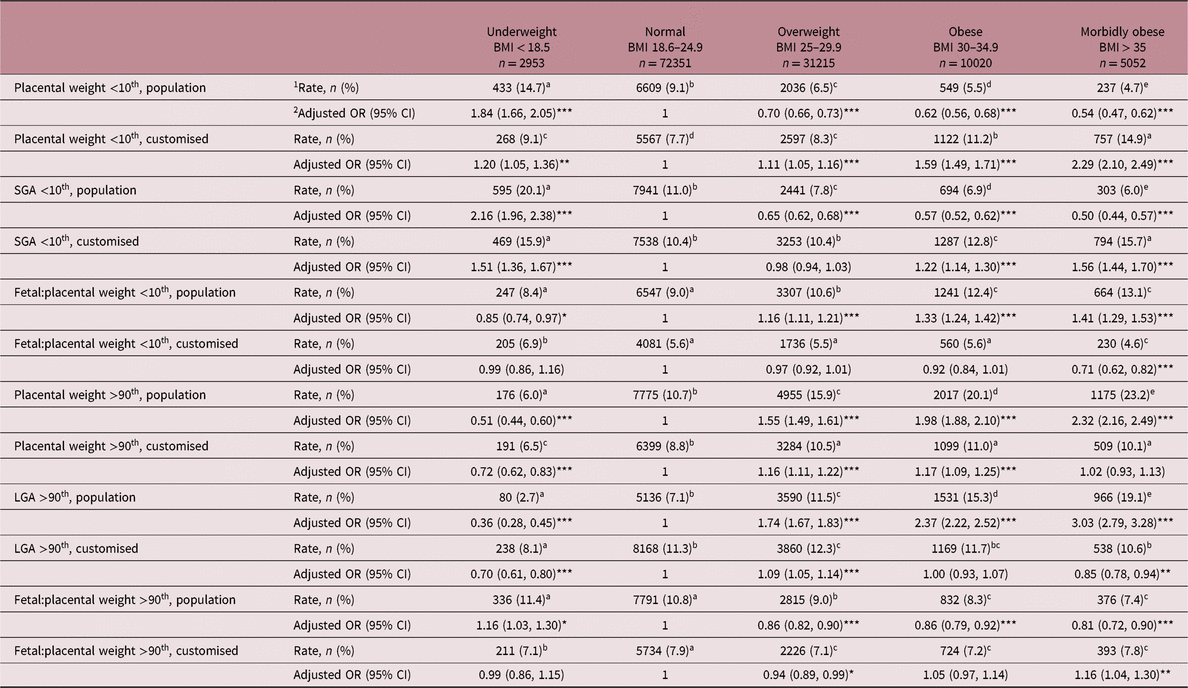
SGA, small-for-gestational-age; LGA, large-for-gestational-age.
Models adjusted for maternal age, height, smoking habit, parity, booking week, year of delivery, baby gender, gestational age and the occurrence of hypertensive disease.
* P < 0.05, **P < 0.01, ***P < 0.001 relative to Normal BMI reference group.
1 For frequency rate, values within rows with a superscript letter in common are not different from each other, P > 0.05.
2 Odds ratios (OR) and 95% confidence limits (CI) from logistic regression.
Table 3. Adjusted OR (with 95% CI) for pregnancy complications in relation to low-for-gestational-age placental weight defined using the population standard only, the customised standard only and by both approaches for the entire cohort delivering between 24 and 43 weeks of gestation (a) and for deliveries between 37 and 43 weeks of gestation only (b). Reference category is maternities where placental weight is not low by either method, OR = 1

Model adjusted for maternal age, year of delivery, booking week and smoking habit.
OR and 95% CI from logistic regression, *P < 0.05, **P < 0.01, ***P < 0.001 relative to placental weight not low by either method.
Results
Maternal characteristics and pregnancy complications
Table 1 provides a summary of the maternal characteristics of 121,591 individual pregnancies distributed according to BMI category measured at first antenatal booking appointment, and the incidence of pregnancy complications variously associated with BMI or placental size. Compared with the normal reference group, overweight, obese and morbidly obese women were older, slightly shorter and less likely to be nulliparous or smokers: obese and morbidly obese women also booked slightly earlier. In contrast, relative to the normal BMI group, underweight women were more likely to be nulliparous, have a smoking habit, booked earlier and were younger and taller. The rates of gestational hypertension, pre-eclampsia, emergency and elective caesarean section, and induced labour increased stepwise with increasing BMI from underweight to morbidly obese, while the stillbirth rate increased stepwise from normal to morbidly obese. Very preterm delivery and placental abruption were most common in the underweight, obese and morbidly obese groups, and underweight mothers had a twofold higher rate of spontaneous preterm delivery and neonatal death compared to all other BMI categories.
Placental weight and birthweight extremes
Both mean adjusted placental weight and birthweight increased stepwise from underweight to morbidly obese categories. Although there is likely to be considerable variation in placental function at any given placental weight, the mass of the placenta was positively associated with birthweight for the entire population, and within each of the five BMI categories separately (range r = 0.62–0.67, P < 0.001). The incidence rate and adjusted risks for placental weight extremes in different BMI categories using population charts compared with the newly developed customised approach are detailed in Table 2 for the <10th and >90th centiles and illustrated in Figs. 1 and 2 for the <5th and >95th centiles, respectively. For the population overall, the incidence of placental weight <5th centile was 4.2% using population charts and 3.6% for the customised approach, while for placental weight <10th centile the incidence rate was 8.2% and 8.5% for population versus customised, respectively. The incidence of placental weight >95th centile was 7.0% using population charts and 5.5% by the customised approach, while for placental weight >90th centile the incidence was 13.2% and 9.5% for population versus customised, respectively. When population charts were used to define placental weight categories, maternal BMI was inversely related to the incidence of low placental weight and positively related to the rate of high placental weight. Accordingly, underweight women had an increased risk of low placental weight [<10th, OR 1.84 (95% CI 1.66, 2.05)] and a reduced risk of having a large placenta [>90th, OR 0.51 (95% CI 0.44, 0.60)] relative to the normal BMI reference group. Furthermore, across the overweight to morbidly obese categories, women were progressively less likely to have a low placental weight and much more likely to have a high placental weight. These relationships changed markedly when maternal height and weight were taken into account. After this customisation, there was no longer a risk of low placental weight <5th centile in underweight compared with normal, and only a slight increased risk (20%) using the <10th centile cut-off. Furthermore, overweight, obese and morbidly obese women were now at greater risk of low placental weight with upward increments in BMI; for the morbidly obese group, the risk was threefold higher than normal (<5th centile, OR 3.00 (95% CI 2.67, 3.36), Fig. 1). Conversely, and as expected, these overweight/obese women now had a much attenuated, yet still significant risk of high placental weight (16% vs. 55%, and 17% vs. 98%, Table 2), but there was no risk whatsoever in the morbidly obese group using either >90th or >95th centile cut-offs. This reversal of the relationship between maternal BMI and placental weight extremes was largely mirrored by the birthweight data. Thus, both the incidence and adjusted risk of SGA birth was low in overweight and obese women as defined using population birthweight charts, but when the customised GROW approach was used the relative risk was enhanced. For morbidly obese women, this equated to a 56% and 65% increase at <10th centile and <5th birthweight centiles, respectively. Similarly, a graded increase in the risk of LGA birth was evident from overweight to morbidly obese categories using population centiles, but this disappeared in obese women when the customised approach was used.

Fig. 1. Adjusted risk (OR and 95% CI) for low placental weight (a and b) and small-for-gestational-age (SGA) birth (c and d), both <5th centile, by BMI category at booking using population charts (a and c) or the customised approach (b and d). ***P < 0.001 relative to the normal BMI reference category. See methods text for details of adjustments for potential confounders.

Fig. 2. Adjusted risk (OR and 95% CI) for high placental weight (a and b) and large-for-gestational-age (LGA) birth (c and d), both >95th centile, by BMI category at booking using population charts (a and c) or the customised approach (b and d). **P < 0.01 and ***P < 0.001 relative to the normal BMI reference category. See methods text for details of adjustments for potential confounders.
The birthweight:placental weight ratio is commonly used as a proxy for placental efficiency, and the adjusted mean decreased through the underweight to obese/morbidly obese categories (Table 1). Likewise, the frequency and adjusted risk of low assumed ‘placental efficiency’ <10th population centile was greatest in the morbidly obese group (Table 2) but after taking account of maternal size this situation was again reversed [OR 1.41 (95% CI 1.29, 1.53) vs. OR 0.71 (95% CI 0.62, 0.82), both P < 0.001].
Population versus customised weight standards
The exclusivity or otherwise of defining low placental weight (<10th centile) and SGA birth using population versus customised weight standards was determined for the entire cohort. For low placental weight: 65.3% of affected pregnancies were classified as such using both methods, 15.5% were exclusively categorised as growth-restricted by the population placental standard only and 19.2% by the customised placental standard only. For these three groups, 6.1%, 3.0% and 9.6% of deliveries occurred before 37 weeks gestation. For SGA births: 67.3% were classified as small using both methods, 11.8% by the population birthweight standard only and 20.9% exclusively by the customised standard. Fig. 3 serves to emphasise the proportion of deliveries that would potentially be missed if only one approach was used – as expected this differs markedly by BMI category, particularly in underweight versus morbidly obese groups. The adjusted placental weight and birthweight for all pregnancies defined as SGA using the contrasting approaches are shown (Fig. 3). When SGA was defined using population charts, placental weight and birthweight were generally similar across BMI categories. However, using the customised approach, the relationship was linear with ever-greater BMI and the average differential in placental weight and birthweight between underweight and morbidly obese categories was 63 and 257 g, respectively.

Fig. 3. Percentage of women per BMI category at booking with low placental weight (a) or small-for-gestational-age (SGA) birth (b), both <10th centile, defined using population charts only (open bar), the customised approach only (grey bar) or by both approaches (hatched bar). Mean (± SEM) placental weight (c) and birthweight (d) for all births defined as SGA per BMI category using population charts (open bar) versus the customised approach (grey bar). Linear regression model adjusted for maternal age, height, smoking habit, booking stage, year of delivery, gestation age and baby sex. Within each classification method, where BMI categories have a different superscript letter, P < 0.01.
Low placental weight standards and pregnancy complications
OR for the association between low placental weight-for-gestational-age and several common pregnancy complications are detailed in Table 3 for the entire cohort delivering between 24 and 43 weeks of gestation, and for deliveries between 37 and 43 weeks gestation only. For the entire cohort, when low placental weight was exclusively defined by the population standard there was no association with the adjusted risk of stillbirth, pre-eclampsia, gestational hypertension, placental abruption or neonatal death, but when low placental weight was defined using the customised standard only, significantly enhanced risks were revealed for each of these complications (all P < 0.001). Broadly similar relationships were evident when the analysis was confined to term deliveries. Moreover, for each pregnancy complication, the logistic regression model using customised centiles had a lower deviance than that observed using population centiles, demonstrating that they are always a better predictor of potential problems.
Discussion
This is the first study to derive coefficients for predicting normal placental weight in nulliparous and multiparous women of differing height and weight with singleton deliveries. The resulting equations, and the difference between actual and predicted placental weight at delivery, allowed an individual customised placental weight centile to be generated. The relationship between maternal BMI category and the risk of abnormal placental weight was then quantified and compared with an existing population-based approach. Using population charts, obese and morbidly obese women had a greater risk of high placental weight (>90th centile) but after taking account of individual height and weight, in addition to parity, baby gender and gestational age, this relationship was attenuated or no longer significant. This suggests that greater placental weight associated with maternal obesity in this and previous studiesReference Wallace, Horgan and Bhattacharya3 , Reference Soliman, Eldabbagh and Saleem4 , Reference Roland, Friis and Godang21 , Reference Strøm-Roum, Tanbo and Eskild22 is overemphasised, and that placental weight is proportionate to maternal size for more women than hitherto suggested. Further, it is this relative placental weight which is of clinical relevance, particularly when the predicted placental weight for any given size of women is not achieved. Similarly, we found no substantive evidence of abnormal presumed placental efficiency in obese women once height and weight were accounted for although we acknowledge that others report obesity-related alterations in placental transport and metabolismReference Higgins, Greenwood, Wareing, Sibley and Mills23 , Reference Gallo, Barrett and Dekker Nitert24, placental pathologyReference Huang, Liu and Feng25 , Reference He, Curran and Raker26 and pro-inflammatory cytokine gene expressionReference Roberts, Riley and Reynolds27 that are not necessarily reflected by changes in placental size. Importantly, when placental weight was defined using customised standards, both obesity and morbid obesity were associated with a markedly enhanced incidence and risk of abnormally low placental weight; at the <5th centile the adjusted risk was 75%–200% higher than normal. This reversal of the relationship between maternal BMI and extremes of placental weight was paralleled by the birthweight data. Thus, consistent with previous comparisons, obesity was a major risk factor for SGA birth when the GROW-customised weight centiles were used to define birthweight, and important confounders such as maternal age, smoking habit and hypertensive disease were adjusted forReference McIntyre, Gibbons, Flenady and Callaway28 , Reference Anderson, Sadler, Stewart, Fyfe and McCowan29. Hence in a proportion of women, maternal obesity is associated with an increased risk of relative placental growth restriction and failure of the fetus to achieve its prenatal growth potential, leading to lower than expected birthweights for maternal size.
A further objective was to investigate the association between common pregnancy complications and low placental weight defined exclusively by the customised versus the population standard, or by both approaches. This revealed considerable overlap in the proportion of placental weights defined as abnormally low using the population and customised approaches (65%), but prior studies indicate that customised birthweight standards, with a strikingly similar degree of overlap (67%), offer better identification of risk for a range of pregnancy outcomes, including threatened preterm labour, stillbirth, hypertensive disease, antepartum haemorrhage and neonatal deathReference Gardosi and Francis15–Reference Gardosi, Francis, Turner and Williams17. Moreover, the relationships were strongest for the subgroup that was unrecognised or missed by the population standardReference Gardosi and Francis15. Our novel data for pregnancy complications associated with low placental weight-for-gestational-age are largely commensurate with these findings and are supportive of the assertion that customised standards that take account of maternal size improve the differentiation between the physiologically small and pathologically small placenta/babyReference Chiossi, Pedroza and Costantine18. The current database was not large enough to specifically test whether these effects differed by BMI category, but 47% of women identified as having low placental weight by the customised standard only were either obese or morbidly obese, implying that relatively impaired placental growth and function is likely to be an important mediator of the adverse pregnancy outcomes linked to maternal obesityReference Wang, Wang and Liu30 , Reference Aune, Saugstad, Henriksen and Tonstad31. The weight of the baby depends heavily on placental function as well as its mass, and although our approach helps to identify relative placental growth restriction that would be missed by population charts particularly in obese women, we were unable to additionally directly measure accepted indices of placental haemodynamic, endocrine or nutrient transfer function in individual cases. Nevertheless, this could be a productive area for future research helping to better define which aspects of placental growth and function are most sensitive to differences in maternal nutrient status.
As this is the first study to derive coefficients for predicting normal placental weight in women of differing height and weight, there are no direct comparisons with other studies. The differential in the placental weight constant from the regression equation for nulliparous versus multiparous women was 31.8 g. This was very similar to the effect of parity reported previously for our population-based chartsReference Wallace, Bhattacharya and Horgan13 and in studies involving Norwegian and Japanese womenReference Thompson, Irgens, Skjaerven and Rasmussen32 , Reference Ogawa, Matsuda and Nakai33. Herein, the gender difference in predicted placental weight (14.5 g, males > females) also mirrored that reported for several ethnically diverse populations (range 10–20 g)Reference Ogawa, Matsuda and Nakai33–Reference L’Abée, Vrieze and Kluck36. The approach described herein allows height and weight to be accounted for in each maternity separately. Nevertheless, for comparative purposes, if we assume no deviation from average height and a 2.6 kg deviation in weight, equating one BMI unit, the predicted difference in placental weight is 5.1 g per BMI unit. This value for women with normal placental growth is understandably slightly higher than the estimated increase in placental weight of 4.5 g per BMI unit derived for the entire cohort, irrespective of pregnancy outcome, as the latter includes pregnancies with known placental pathology (Table 1). Furthermore, it agrees well with adjusted estimates in studies of healthy pregnant women from the Netherlands, and in both cohort and population-wide studies in Norway (range 3.6–6.7 g placenta per BMI unit)Reference Roland, Friis and Godang21 , Reference Strøm-Roum, Tanbo and Eskild22 , Reference L’Abée, Vrieze and Kluck36. Taken together this strong consensus between studies for the influence of parity, gender and BMI on placental weight helps validate our approach and suggests that the individual coefficients generated by our regression model are likely to be relevant to other populations. Nonetheless, we accept that external validation in a separate cohort is required to confirm reliability of the entire regression equation across settings.
A strength of the study is that height and weight were measured at the first hospital booking appointment in a large number of women whose pregnancies were well characterised and where placental weight was recorded at delivery. The placenta was weighed untrimmed but strong correlations (r = 0.98) between trimmed and untrimmed weights have been reportedReference Leary, Godfrey, Greenaway, Davill and Fall37. Although the data were collected over a 40-year period, they were adjusted for year of delivery. A limitation of our study was the inability to adjust for pre-existing or gestational diabetes.
Conclusion
We produced customised placental weight standards that can be used to define abnormal placental growth in women of all sizes. This novel approach could help better define the relationship between placental growth and its eventual size, perinatal outcomes and lifelong disease risk. Given that SGA per se is challenging to detect antenatally in obese womenReference Williams, Southam and Gardosi38, the placenta, which is routinely assessed for location, cord insertion and structure, arguably offers an alternative target that could be assessed at an earlier stage of pregnancy when the clarity of the image is better. In support, measuring placental volume by three-dimensional ultrasound in the first trimester is an effective predictor of SGAReference Schartz, Sammel, Leite and Parry39 and LGA birthReference Plasencia, Akolekar, Dagklis, Veduta and Nicolaides40, and importantly is correlated with placental weight at deliveryReference Effendi, Demers and Giguère41. However, the real value of producing customised placental weight standards to more accurately diagnose relative growth restriction and/or oversize in women of varying height and weight may lie beyond the perinatal period as placental phenotypes, including extremes of weight, are considered a central driver of many adult-onset chronic diseasesReference Burton, Fowden and Thornburg1 , Reference Barker and Thornburg2 , Reference Thornburg and Marshall6. Indeed, the placenta influences the ontogeny of most major fetal organ systems, and placental weight, shape and size have already been linked to an elevated risk of hypertension, heart disease and specific cancersReference Kermack, Van Rijn, Houghton, Calder, Cameron and Macklon42. On this basis, we suggest that recording placental weight requires to be integrated into routine clinical care across populations and settings.
Acknowledgements
We thank the GROW international team of the Perinatal Institute, Birmingham for facilitating access to the Bulk Birthweight Centile Calculator.
Financial Support
JW and GH were funded by the Scottish Government’s Rural and Environmental Science and Analytical Services Division (RESAS) who had no input into the content or preparation of the manuscript.
Conflicts of Interest
None of the authors have any conflict of interest and all have seen and approved the final version of the manuscript.
Ethical Standards
This was a retrospective cohort study using data from the Aberdeen Maternity and Neonatal Databank (AMND). Permission to access the data was obtained from the Steering Committee of the AMND (Caldicott guardians) and the North of Scotland Research Ethics Service granted ethical approval (REC Ref 13/NS/0050) on this basis.


