


Introduction
Although trauma and adversity are common, individuals vary widely in how they respond to these negative exposures. For example, although early life adversity is one of the strongest risk factors for later mental disorders (Gilbert et al., Reference Gilbert, Widom, Browne, Fergusson, Webb and Janson2009), a substantial number of individuals who experienced early life adversity do not develop psychological distress and instead recover or maintain psychological health (Green et al., Reference Green, McLaughlin, Berglund, Gruber, Sampson, Zaslavsky and Kessler2010). This concept of psychological resilience, broadly defined as successful adaptation to environmental risks that would be expected to bring about negative psychological sequelae (Luthar, Cicchetti, & Becker, Reference Luthar, Cicchetti and Becker2000), is highly relevant for individual wellbeing and population health. Psychological resilience encompasses not only resistance against psychological distress, but also capacity for positive experiences or even growth in the face of trauma (Bonanno & Mancini, Reference Bonanno and Mancini2008; Calhoun, Cann, & Tedeschi, Reference Calhoun, Cann and Tedeschi2010).
However, the lack of a consistent definition of psychological resilience remains a major obstacle to the field. Measures of psychological resilience have varied widely across the literature (Table 1), ranging from self-reported personality traits to empirically derived outcomes. How congruent are such measures of psychological resilience? Do they capture similar or fundamentally distinct underlying dimensions of resilience? And, do these measures yield similar findings when used as predictors or outcomes in research studies?
Table 1. Typology of psychological resilience measure types described in the literature for adult populations
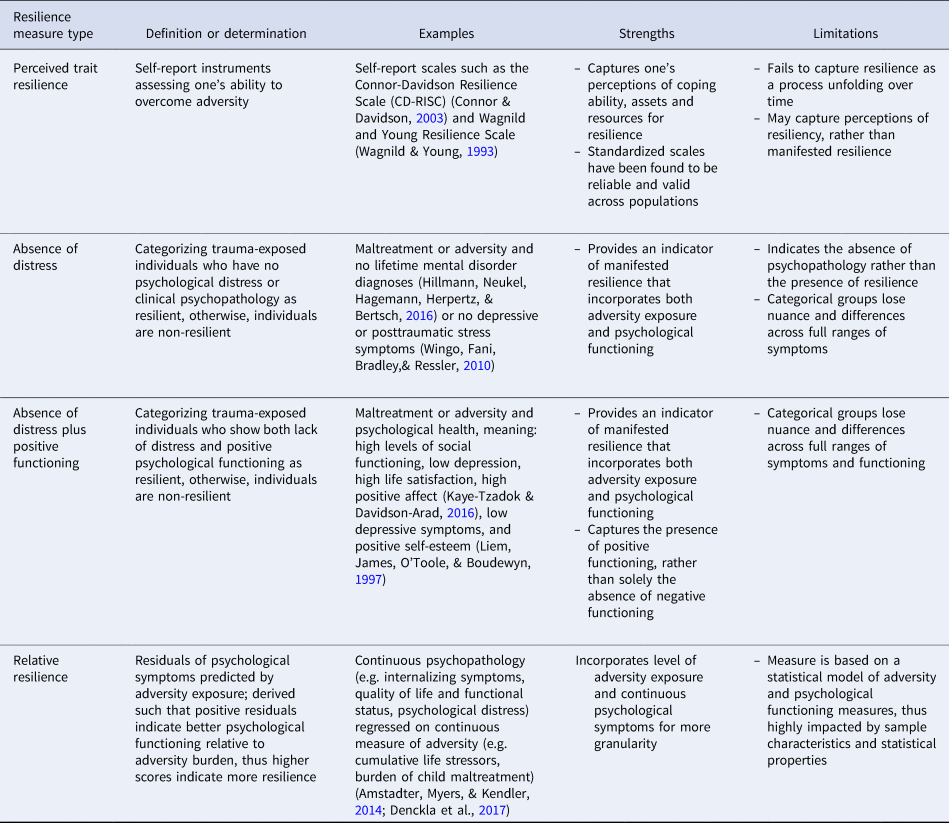
This listing is not meant to be exhaustive, but rather a description of common measurement methods used for psychological resilience among adult samples. For the purposes of this paper, we focused on measures that are both widely used and can be assessed in our current dataset in order to test empirical comparisons. We have not included resilience measures that use trajectory models, meaning definitions of resilience where classes of symptom patterns are studied over time following trauma exposure, as these types of classifications were not possible in our current cross-sectional data.
One way to assess the degree of overlap between resilience measures is through their relationship to sociodemographic factors – if these measures show divergent patterning across these factors, then they are unlikely to be fundamentally similar. In the literature, there is some evidence for this divergence; while higher socioeconomic status (SES) and racial majority status are generally associated with higher resilience (Ungar, Ghazinour, & Richter, Reference Ungar, Ghazinour and Richter2013), this is not always the case, particularly when utilizing an absence of distress definition (Bonanno, Galea, Bucciarelli, & Vlahov, Reference Bonanno, Galea, Bucciarelli and Vlahov2007). There is also mixed evidence regarding sex as a predictor of resilience (Bonanno & Mancini, Reference Bonanno and Mancini2008; Wagnild, Reference Wagnild2009). For these sociodemographic factors, it is unclear how much variation across findings is attributed to different measurements of resilience or to other factors (e.g. sample characteristic differences, study design). Thus, the relationship between different measures of resilience and sociodemographic factors warrants examination, potentially informing the specific dimensions of psychological resilience relevant to different population groups.
In addition, downstream outcomes may represent another way to compare the underlying congruence and real-world relevance of different resilience definitions. Resilience may represent a protective factor that buffers against long-term negative health outcomes often associated with adversity exposure (Hourani et al., Reference Hourani, Bender, Weimer, Peeler, Bradshaw, Lane and Larson2012). Body mass index (BMI) is an anthropometric indicator that has been associated with multiple forms of chronic disease (Dixon, Reference Dixon2010). Resilience has been shown to be related to BMI, whereby higher self-reported trait resilience was associated with healthier BMI (Stewart-Knox et al., Reference Stewart-Knox, Duffy, Bunting, Parr, de Almeida and Gibney2012), thus BMI represents a relevant health indicator to examine in this context. As evidence grows, it is critical to identify the extent to which measures of resilience associate differently with various health indicators. Such insights will increase understanding of disease mechanisms and risk factors, which can guide development of effective intervention and prevention efforts.
For the current study, we examined the correlates and possible health implications of psychological resilience among adults exposed to childhood maltreatment, a potent risk factor for many negative psychological and physical health outcomes later in life (Gilbert et al., Reference Gilbert, Widom, Browne, Fergusson, Webb and Janson2009). Specifically, we focused on urban African American adults, a population understudied in epidemiological literature with a high trauma burden (Gillespie et al., Reference Gillespie, Bradley, Mercer, Smith, Conneely, Gapen and Ressler2009). Based on available data in a large population-based sample, the Grady Trauma Project (GTP), and consistent with previously published literature, we created four measures of psychological resilience based on childhood maltreatment exposure and psychological factors. The aim of this study was to determine the correlations between different measures of resilience, assess the distribution of sociodemographic variables across each resilience measure, and determine if these resilience measures were differentially associated with BMI, a physical health indicator that strongly associates with multiple chronic health outcomes.
Methods
Sample population
Data came from the GTP, a National Institute of Mental Health-funded study of determinants of psychiatric disorders conducted between 2005 and 2013 (Gillespie et al., Reference Gillespie, Bradley, Mercer, Smith, Conneely, Gapen and Ressler2009). Participants were recruited from medical (non-psychiatric) waiting rooms in Grady Memorial Hospital in Atlanta, Georgia, USA, an urban hospital serving primarily low-income, minority (>90% African American) individuals. Individuals were approached in waiting rooms; to be eligible, participants had to be 18–65 years of age, with no active psychotic disorder, and able to give informed consent. Approximately 58% of individuals approached by research staff agreed to participate (Binder et al., Reference Binder, Bradley, Liu, Epstein, Deveau, Mercer and Ressler2008). Consenting adults participated in interviews conducted by trained research assistants who assessed demographics, lifetime trauma exposure, and psychological functioning. Due to the small proportion of participants who identified as white or other (3.6% and 3.8%, respectively) and the limited power to determine significant racial/ethnic differences, the analytic sample was restricted to African American individuals. A total of 3364 African American participants had complete data on all measures relevant to our primary analyses and completed the assessment of childhood maltreatment; see online Supplementary Materials for details regarding missing data. Of these individuals, 1429 (42.5%) participants who reported a history of childhood maltreatment were included in the primary analyses; a subset of these participants (N = 807; 56.5% of the primary analytic sample) were included in BMI analyses. As missing data was mainly a function of the clinical waiting room interview procedure and thus likely resulted in the data being missing at random, we performed complete case analyses to derive unbiased estimates (online Supplementary Materials).
Measures
Childhood maltreatment
Exposure to childhood maltreatment was ascertained through the 28-item Childhood Trauma Questionnaire (CTQ) (Bernstein et al., Reference Bernstein, Stein, Newcomb, Walker, Pogge, Ahluvalia and Zule2003), which assesses self-reported childhood abuse (sexual, physical and emotional) and neglect (emotional). We excluded the physical neglect subscale, as previous work in this sample suggested physical neglect was confounded by poverty and was not fully valid in this population (Powers, Ressler, & Bradley, Reference Powers, Ressler and Bradley2009). Ratings from items within each of these maltreatment types were summed to capture total severity scores. As previously recommended (Bernstein et al., Reference Bernstein, Stein, Newcomb, Walker, Pogge, Ahluvalia and Zule2003; Powers et al., Reference Powers, Ressler and Bradley2009), these total scores were then dichotomized to reflect presence (i.e. moderate to severe) or absence (i.e. none to mild) of each maltreatment type based on established cut-off points (online Supplementary Materials). Participants were then grouped into absence (none or mild levels for all maltreatment types) or presence (moderate or severe levels for at least one maltreatment type) of any childhood maltreatment. To assess resilience to early experiences of child maltreatment, only individuals meeting criteria for any childhood maltreatment were included in current analyses [1429 (42.5%) of 3364 GTP participants who completed the CTQ endorsed maltreatment].
Resilience
Psychological Distress. Consistent with previous literature (Matheson, Foster, Bombay, McQuaid, & Anisman, Reference Matheson, Foster, Bombay, McQuaid and Anisman2019), psychological distress was captured using measures of depressive and posttraumatic stress symptoms. These symptoms were chosen as they are common psychological sequelae of early adversity exposure and represent potential, unfavorable psychological responses to maltreatment experiences (De Bellis & Thomas, Reference De Bellis and Thomas2003; Li, D'arcy, & Meng, Reference Li, D'arcy and Meng2016). The Beck Depression Inventory-Second Edition (BDI-II) is a 21-item psychometrically validated and widely used inventory of current depressive symptoms (Beck, Steer, & Brown, Reference Beck, Steer and Brown1996). The 18-item modified Posttraumatic Stress Symptom Scale (mPSS) is a psychometrically validated self-report measure of posttraumatic stress symptoms corresponding to diagnostic symptom criteria (Coffey, Dansky, Falsetti, Saladin, & Brady, Reference Coffey, Dansky, Falsetti, Saladin and Brady1998). Sum scores of both scales were used to assess continuous symptoms (higher scores indicated greater symptom severity). We also used an established clinical cutoff for the BDI-II and a highly sensitive cutoff for the mPSS to distinguish probable depression (BDI total score ⩾10) and probable posttraumatic stress disorder (PTSD; mPSS score ⩾29) (Ruglass, Papini, Trub, & Hien, Reference Ruglass, Papini, Trub and Hien2014).
Positive Affect. Positive affect (i.e. the positive mood or emotions that a person tends to experience) was assessed by the positive affect subscale of the Positive and Negative Affect Schedule-Trait (PANAS-T) (Watson, Clark, & Tellegen, Reference Watson, Clark and Tellegen1988). Participants reported the extent to which they typically experience ten positive feelings and emotions (e.g. excited, inspired); item responses were summed to create a total score (Cronbach's α = 0.89). As there is no standardized cutoff for positive affect scores, we used the top tercile score within the sample (top tercile was ⩾43, range 10–50) to categorize individuals as having relatively higher v. lower positive affect.
Self-Reported Resilience. The 10-item Connor-Davidson Resilience Scale (CD-RISC 10) (Campbell-Sills & Stein, Reference Campbell-Sills and Stein2007) assessed the perceived capacity of an individual to cope adaptively with stressors (e.g. disappointment, stress, catastrophe). Participants indicated how true each of the items were for themselves over the past month on a five-point Likert scale. A total sum-score was created, with higher scores indicating higher levels of resilience. The CD-RISC 10 demonstrated high internal consistency reliability in our sample (Cronbach's α = 0.89).
Resilience measure derivations
We created four psychological resilience measures based on prior literature summarized in Table 1: (1) perceived trait resilience, (2) absence of distress, (3) absence of distress plus positive functioning, and (4) relative resilience. Each measure was defined as follows:
Continuous perceived trait resilience: Self-reported perceived trait resilience was measured using total sum scores on the CD-RISC 10.
Categorical absence of distress: Individuals were classified as absence of distress ‘resilient’ if they currently had no or only very mild depressive symptoms (BDI ⩽10) and no or low posttraumatic stress symptoms (DSM-IV PTSD criteria not met and mPSS ⩽29). Otherwise individuals were classified as ‘non-resilient.’
Categorical absence of distress plus positive functioning: To expand the categorical definition of resilience, binary positive affect scores were incorporated to reflect absence of distress plus positive functioning. Individuals were classified as ‘resilient’ if they had no or only very mild current depressive and no or low posttraumatic stress symptoms (consistent with the absence of distress definition), as well as higher positive affect (positive affect scores>=43, which corresponded to the top tercile). Otherwise individuals were classified as ‘non-resilient.’ This definition was based on prior research using the top tercile to identify people with above sample-average positive affect (Keyes, Reference Keyes2005). Research suggests that psychological resilience includes the ability to experience positive affect at any level, not necessarily high positive affect (Bonanno & Mancini, Reference Bonanno and Mancini2008). However, there are no standard conventions for designating levels of positive affect necessary to classify individuals as resilient. Thus, our definition is notably conservative, capturing above-average positive affect among a sample at higher risk for lower positive affect by virtue of their maltreatment history.
Continuous relative resilience: Relative resilience was calculated from the standardized residuals derived from two separate linear regression models that used continuous overall maltreatment severity (CTQ-total score) as the independent variable to predict outcomes of continuous depressive and posttraumatic stress symptoms, respectively. The inverses of the residuals were used to improve interpretation, so positive residuals indicated lower symptomology than predicted at a given level of maltreatment. The inverse standardized residuals from the depression and posttraumatic stress symptoms models were converted to z-scores and added together, resulting in a z-score sum of relative psychological distress. These sum scores were used as relative resilience scores, with more positive scores indicating higher resilience. Though depression and posttraumatic stress symptoms tend to be comorbid (correlation in our analytic sample: r = 0.66), they capture separate and distinct forms of distress, thus were combined to indicate an underlying level of psychological severity.
Physical health outcome: BMI
BMI values were calculated as kg/m2 based on self-reported height (in inches) and weight (in pounds).
Covariates
Demographic variables included sex (male, female), current age (continuous age in years), and measures of SES, including highest level of education (less than 12th grade, high school graduate or GED, some college or college graduate), monthly household income ($0–499, $500–999, $1000 or more), and employment status (unemployed, unemployed receiving disability support, and employed with or without disability support).
Statistical analyses
We first conducted descriptive statistics to determine univariate distributions of each of the four resilience measures. We then ran Pearson correlations to determine two-way associations between each resilience measure. Next, we used bivariate statistics to determine distributions of each resilience measure across sociodemographic covariates. We also determined whether distributions of covariates differed between the two categorical resilience measures and between the two continuous measures. For categorical measures, we compared distributions of covariates across relevant contrasts: (1) resilient by both definitions (n = 176) v. resilient by absence of distress, but not absence of distress plus positive functioning (n = 149), and (2) non-resilient by both definitions (n = 1104) v. non-resilient by absence of distress plus positive functioning, but not absence of distress (n = 149). For continuous measures, we used repeated measures ANOVA to determine whether mean levels of each standardized resilience measure differed across covariates. We also examined the bivariate relationships between each resilience measure with a count score of lifetime trauma (online Supplementary Materials). Finally, we ran linear regression models with each resilience measure separately predicting continuous BMI, adjusting for all covariates. Continuous resilience measures were standardized (mean = 0, s.d. = 1) for regression models to aid interpretation. We also performed a sensitivity analysis to examine the relationships between resilience measures and BMI accounting for lifetime trauma (online Supplementary Materials). All analyses were performed using SAS Version 9.4 (SAS Institute, Inc., Cary, North Carolina).
Results
The analytic sample (N = 1429) was largely female (84.2%) with a mean age of 39.4 years (s.d. = 12.5). Most participants were of low SES, with 23.6% of the sample having less than a high school degree, 29.6% having a monthly household income of under $500, and 50.2% being unemployed (Table 2).
Table 2. Distribution of covariates and resilience measures in the Grady Trauma Project (GTP) analytic sample (N = 1429)
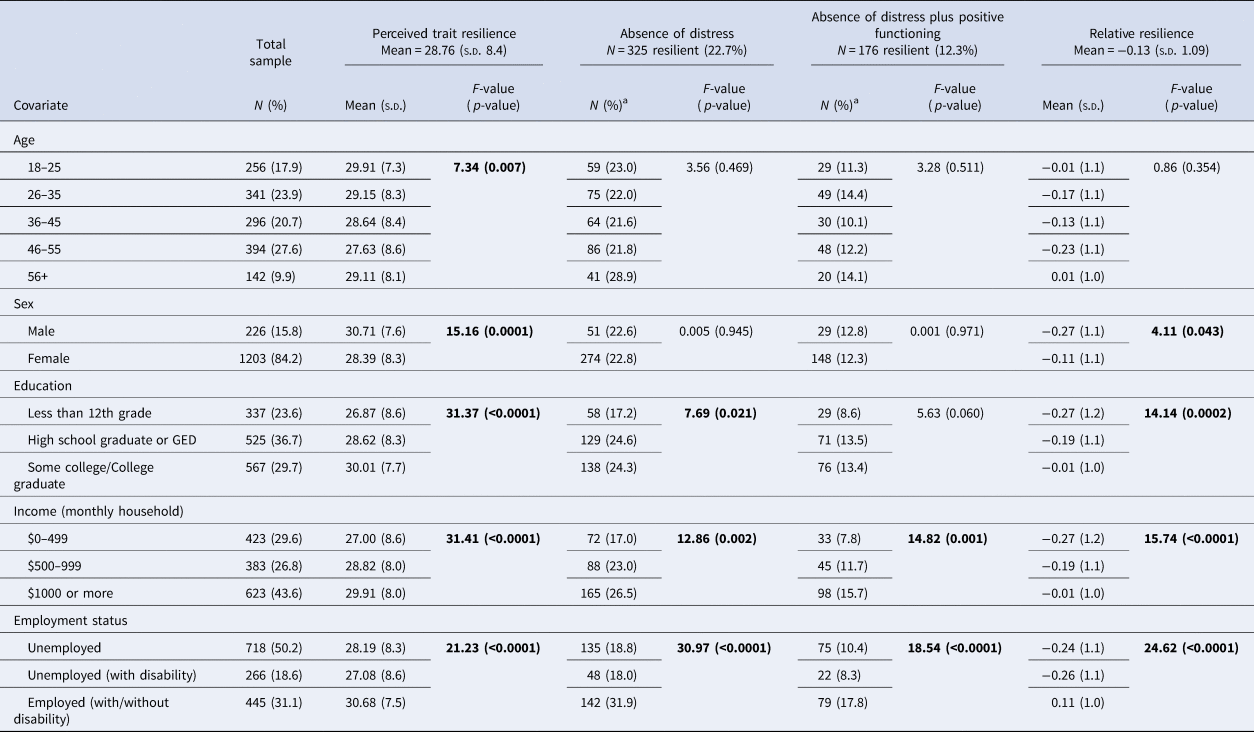
Descriptive statistics are presented for the analytic sample; binary resilience measures (absence of distress and absence of distress plus positive functioning) display N and % of those who are resilient (v. non-resilient). Linear regressions were performed with covariates predicting each resilience measure, with F-statistics and corresponding p-values listed.
Significant effects are shown in bold (p < 0.05).
a Percentages (%) are row percentages, e.g., 23.0% of those age 18-25 were classified as resilient using the absence of distress measure.
Among the BMI analytic sample (n = 807), mean BMI was relatively high (mean = 33.5, s.d. = 8.8), with over 60% (n = 495) of the sample classified as obese (BMI⩾30).
The prevalence of resilience based on the categorical definitions were: absence of distress: 22.7% (n = 325) and absence of distress plus positive functioning: 12.3% (n = 176) (Table 2). The mean values of resilience among the continuous definitions were: relative resilience: mean = −0.13 (s.d. = 1.09) and perceived trait resilience: mean = 28.76 (s.d. = 8.4), with higher scores indicating more resilience.
Correlations between resilience measures
The two categorical measures (absence of distress and absence of distress plus positive functioning) were relatively highly correlated at 0.69, but these measures were only moderately correlated with relative resilience (r = 0.50 and r = 0.32, for absence of distress and absence of distress plus positive functioning, respectively) (Table 3). Moderate correlations were found between the categorical measures and perceived trait resilience (r = 0.35 and r = 0.37, for absence of distress and absence of distress plus positive functioning, respectively) and a slightly lower correlation was found between the two continuous measures (relative resilience and perceived trait resilience, r = 0.27).
Table 3. Distribution of and correlations between resilience measures among the analytic sample (N = 1429)

Cell entries are Pearson correlation coefficients (r) between each resilience measure. All correlations are statistically significant at p < 0.05.
Distribution of resilience measures across sociodemographic variables
With respect to age, only perceived trait resilience was significantly associated with age categories, where resilience appeared to follow a U-shaped pattern, with higher levels reported by youngest (age 18–25) and oldest individuals (age 56+) and lower levels reported by middle-aged individuals (Table 2). While not significant, this general pattern in age and resilience was reflected in the other resilience measures. Further, the age distribution was comparable between the two categorical resilience measures and the two continuous resilience measures (all p > 0.05).
Significant differences by sex were found for relative resilience and perceived trait resilience. This sex difference across resilience measures was statistically significant (p < 0.0001), however, associations were in opposite directions. Relative resilience was higher among females compared to males (female mean = −0.11 v. male mean = −0.27), indicating that female participants showed relatively lower levels of psychiatric distress despite reported trauma exposure, while perceived trait resilience was higher among males compared to females (female mean = 28.4 v. male mean = 30.7), suggesting male participants nonetheless tended to describe themselves as more resilient.
All measures of resilience were significantly associated with most markers of SES, including educational attainment, monthly household income, and employment status. Across categorical and continuous measures of resilience, higher SES was associated with being resilient or having higher levels of resilience. SES patterns was largely comparable between the two categorical resilience measures and the two continuous resilience measures.
Relationships between resilience measures and BMI
The BMI analytic sample had lower perceived trait resilience (mean = 27.81 v. mean = 29.99; p < 0.001) and higher relative resilience (mean = −0.08 v. mean = −0.21; p = 0.029) compared to those in the analytic sample without BMI information (n = 622), while the categorical resilience measures did not differ. The BMI analytic sample also contained a higher proportion of females (90.8% female in BMI analytic sample v. 75.6% female among those excluded).
Two of the four resilience measures were significantly associated with BMI (Table 4): absence of distress plus positive functioning and perceived trait resilience. People categorized as resilient by absence of distress plus positive functioning had BMI scores that were 2 units lower than those categorized as non-resilient (β = −2.10, 95% CI −3.96 to −0.25), adjusting for covariates. One standard deviation difference in perceived trait resilience score was related to 0.63 units lower BMI (β = −0.63, 95% CI −1.25 to −0.01), adjusting for covariates. Neither absence of distress nor relative resilience measures were significantly associated with BMI, however associations were in a similar protective direction. Being resilient or higher levels of resilience on all four measures were associated with lower levels of lifetime trauma. Adjusting for lifetime trauma, the effect of both absence of distress plus positive functioning and perceived trait resilience on BMI persisted and even strengthened in magnitude, while absence of distress and relative resilience remained unassociated (online Supplementary Materials).
Table 4. Associations between each resilience measure and continuous BMI in the BMI sub-sample (N = 807)

Cell entries are βs (effect estimates) and 95% confidence intervals from four linear regression models.
Significant effects are shown in bold (p < 0.05).
Models adjust for age, sex, educational attainment, income, and employment status.
Reference group for categorical measures (absence of distress; absence of distress plus positive functioning) is non-resilient. Continuous measures are standardized (mean = 0, s.d. = 1; perceived trait resilience; relative resilience).
Discussion
To our knowledge, this is the first study comparing different measures of psychological resilience to early life adversity in a community sample. Three primary findings emerged from this study. First, we found that resilience measures shared only moderate correlations. Specifically, correlations between resilience measures ranged from 0.27–0.69, with most between 0.30 and 0.50. One other study has identified low congruence between five distinct measures of resilience in a military/veteran population (Sheerin, Stratton, Amstadter, Education, The VA Mid-Atlantic Mental Illness Research & McDonald, Reference Sheerin, Stratton, Amstadter, Education and McDonald2018). In that study, Sheerin et al. identified modest concordance between their two categorical definitions and, while prevalence estimates of resilience across definitions ranged from 31 to 87%, only 25.7% of the sample were considered resilient by all five definitions. Our findings are generally consistent with these results, suggesting potential inconsistencies in resilience measures among two highly trauma-exposed populations.
The lack of strong correlations between resilience measures in the current study could be due to several factors. For example, we used different variables to derive each measure. While the correlation between categorical resilience measures was relatively high (r = 0.69), this was likely because information on depression and PTSD was included in both definitions. Moreover, our use of continuous maltreatment severity and psychological functioning provided a more granular assessment of relative functioning, potentially leading to lower measurement error in relative resilience compared to categorical variables, which are more susceptible to misclassification. This discrepancy may explain lower correlations between relative resilience and other resilience measures. In addition, perceived trait resilience may better capture one's perceived capacity to overcome stress, reflecting self-efficacy for facing future adversity rather than psychological adaptation from past adversity. Thus, perceived trait resilience may represent a related but distinct construct from manifested resilience outcomes, potentially explaining lower correlations between perceived trait resilience and resilience measures that may capture manifested psychological resilience.
Second, we found that demographic factors, including SES, age, and sex, showed patterns of association with resilience to early adversity. Social and material resources that accompany a higher socioeconomic position may be promotive of positive mental health and may buffer against psychological impacts from early adversity. Operationalized here as a combination of educational attainment, household income, and employment status, individuals with lower SES tended to show lower resilience across all four resilience measures. While there is mixed evidence regarding the relationships between SES and resilience, our results are consistent with some work using self-reported resilience measures (Carli et al., Reference Carli, Mandelli, Zaninotto, Roy, Recchia, Stoppia and Serretti2011) and resilience classifications incorporating adversity exposure and mental health (Chaudieu et al., Reference Chaudieu, Norton, Ritchie, Birmes, Vaiva and Ancelin2011). These consistencies are notable given the restricted SES range in our sample, which may have impacted the distribution of resilience by SES.
We also identified a general curvilinear association between resilience and age across measures. Previous research has shown that older adults tend to have higher self-reported resilience (Campbell-Sills, Forde, & Stein, Reference Campbell-Sills, Forde and Stein2009). However, this is not consistently found in empirical studies, with some studies finding the opposite (Lamond et al., Reference Lamond, Depp, Allison, Langer, Reichstadt, Moore and Jeste2008). Our sample, ranging in age from 18 to 68, provided greater age variation than previous studies and suggested that the relationship between age and resilience may be more complex than a simple linear association.
We found disparities in associations of resilience by sex. Specifically, women had higher relative resilience levels, while men had higher perceived trait resilience levels. In contrast to our finding that relative resilience was higher in women than men, Sheerin et al. found higher levels of resilience (defined using a residual-based measure) among men than women (Sheerin et al., Reference Sheerin, Stratton, Amstadter, Education and McDonald2018). However, that study comprised mostly men and included military personnel, and their residual-based measure was based on distress symptoms relative to past month stressful life events, which may capture a more acute snapshot of resilience compared to our current study focused on a more distal history of early maltreatment. Our finding of higher perceived trait resilience in men compared to women is consistent with other literature, with evidence indicating men tend to report higher scale resilience scores than women (Campbell-Sills et al., Reference Campbell-Sills, Forde and Stein2009). However, there are complexities to sex differences in resilience. Unlike our study, some reviews suggest resilience (when defined by low psychological symptoms over time despite trauma exposure) is more prevalent in men than women (Bonanno & Mancini, Reference Bonanno and Mancini2008). Others report less definitive sex-specific findings with respect to self-reported resilience measures (Wagnild, Reference Wagnild2009), suggesting that sex differences in resilience, while not entirely clear, are important to identify. Internalized gender-based stereotypes, including the idea that women are weak or relatively emotional (Ellemers, Reference Ellemers2018), may influence women's reporting of their behavior and perceptions. Such stereotypes may lead women to report lower perceived resilience as compared to men. Our findings potentially rebuke this hypothesis, suggesting instead that women may manifest better psychological resilience, despite reporting lower perceptions of resiliency.
Third, we identified that both absence of distress plus positive functioning and perceived trait resilience were significantly associated with lower BMI, a widely used indicator of chronic disease risk. This finding is consistent with studies of self-reported trait resilience and BMI in military and civilian adults (Bartone, Valdes, & Sandvik, Reference Bartone, Valdes and Sandvik2016; Stewart-Knox et al., Reference Stewart-Knox, Duffy, Bunting, Parr, de Almeida and Gibney2012). It is unclear why absence of distress and relative resilience were unassociated with BMI. To our knowledge, no epidemiological samples using comparable measures of resilience have assessed group differences in BMI. That the absence of distress plus positive functioning was significantly associated with lower BMI, and the cruder absence of distress measure was unassociated, suggests added explanatory benefit of incorporating positive functioning into definitions of resilience when examining links to physical health outcomes. Resilience may represent more than a return to stasis, but also encapsulate positive or enhanced functioning due to experiences of adversity. Future work should examine the relationships between resilience and the concept of posttraumatic growth, or positive change resulting from struggle with adversity (Calhoun et al., Reference Calhoun, Cann and Tedeschi2010).
Moreover, while few studies have examined the effect of resilience on health outcomes, it is possible that the underlying capacity for psychological resilience may extend to other aspects of health, such as promoting healthy behaviors and positive social functioning (Tugade, Fredrickson, & Feldman Barrett, Reference Tugade, Fredrickson and Feldman Barrett2004). Although more research is needed to establish causality, we have identified suggestive cross-sectional evidence of an inverse association using multiple types of resilience measures. As our current findings related to BMI, a widely-studied health indicator, an important next step in this research will be to examine the influence of resilience on chronic health conditions, such as diabetes and cardiovascular disease.
Study strengths include a large community-based sample of adults where it was possible to examine associations between resilience measures. Further, we included a range of psychological variables, allowing for the derivation and comparison of different operationalizations of psychological resilience. However, findings should be considered in light of several limitations. First, the data were cross-sectional. Thus, we cannot determine a temporal association between resilience and BMI or understand changes in these constructs over time. This limitation may be more impactful for BMI, which likely changes over time, but less of a concern for demographic traits that are fixed or more stable. Resilience itself is a dynamic construct expected to change across time. However, previous work suggests commonly-used trait resilience measures show adequate test-retest reliability (Windle, Bennett, & Noyes, Reference Windle, Bennett and Noyes2011). While the stability of the resilience measures in our analyses is unknown, all were derived from reliable and valid self-report instruments. Second, psychological distress included depression and PTSD, omitting other forms of psychopathology potentially relevant for defining resilience. However, depression and PTSD are consistently identified as two major negative psychological implications of early adversity, suggesting we captured common distress responses (De Bellis & Thomas, Reference De Bellis and Thomas2003; Li et al., Reference Li, D'arcy and Meng2016). Third, all data were self-reported, including retrospective reports of maltreatment. However, retrospective reports of adversity tend to be under- not over-reported (Hardt & Rutter, Reference Hardt and Rutter2004) and consistently identify groups of individuals at high risk for adult outcomes (Hughes et al., Reference Hughes, Bellis, Hardcastle, Sethi, Butchart, Mikton and Dunne2017). Fourth, the sample is African American, largely female, from a single US city, and therefore generalizability is limited. However, this demographic group is largely understudied in epidemiology, and the high rates of adversity in the group warrants analysis of psychological resilience. Despite the homogeneity of this sample, we suspect the findings of low congruence between measures are not unique to our study. CD-RISC 10 scores in our sample were also largely comparable with other community-based (Campbell-Sills et al., Reference Campbell-Sills, Forde and Stein2009; Poole, Dobson, & Pusch, Reference Poole, Dobson and Pusch2017) and trauma-exposed samples (Hammermeister, Pickering, McGraw, & Ohlson, Reference Hammermeister, Pickering, McGraw and Ohlson2012; McCanlies, Mnatsakanova, Andrew, Burchfiel, & Violanti, Reference McCanlies, Mnatsakanova, Andrew, Burchfiel and Violanti2014). Fifth, our study focused on resilience to child maltreatment, rather than resilience to more proximal traumas. Further longitudinal work is needed to examine how trauma exposure across the lifecourse impacts psychological resilience. Such work can build from our finding that greater lifetime trauma associated with lower resilience across all four measures. Moreover, future studies can also investigate whether recent trauma might differentially influence operationalizations of psychological resilience.
How can we interpret these findings regarding the lack of congruence across different resilience measures? It may be helpful to revisit how well each measure used here captured the theoretical construct of resilience. We broadly defined resilience as successful adaptation to environmental risks that would be expected to bring about negative psychological sequelae (Luthar et al., Reference Luthar, Cicchetti and Becker2000). Some have argued that successful adaptation must be conceptualized beyond absence of psychopathology (Southwick, Bonanno, Masten, Panter-Brick, & Yehuda, Reference Southwick, Bonanno, Masten, Panter-Brick and Yehuda2014), which we attempted to do by incorporating presence of positive affect. Arguably, all four resilience measures in the current study included some evidence of ‘successful adaptation’ – absence of distress, presence of positive affect, or perceived adaptability – despite adversity. Future studies may benefit from including broader indicators of positive functioning, to encapsulate a range of positive psychological domains following adversity. For measures to validly measure psychological resilience, operationalizations should carefully consider what ‘successful adaptation’ means in the specific population and adversity context.
Our findings raise several important potential implications. The general lack of congruence between resilience measures observed here and elsewhere suggest that studies using different resilience measures will likely yield discrepant findings about the predictors and consequences of resilience. Such disparities will be difficult to reconcile unless clearly specified definitions are provided (Choi, Stein, Dunn, Koenen, & Smoller, Reference Choi, Stein, Dunn, Koenen and Smoller2019). When possible, triangulating multiple resilience measures may provide a more comprehensive picture of an individual's wellbeing. These findings also suggest caution when comparing descriptive findings across studies, since the estimated prevalence of ‘resilience’ may vary depending on definition(s) applied, level of adversity exposure, timeframe of assessment, and domains of resilience assessed (Vanderbilt-Adriance & Shaw, Reference Vanderbilt-Adriance and Shaw2008). Resilience measures followed similar patterns by age, with younger and older groups showing higher resilience. Future research should not necessarily assume linear associations between age and resilience, especially in samples with broad age ranges. Similarly, the finding of sex differences in self-reported resiliency suggests women may underestimate their resiliency relative to their manifested resilience, while men may endorse higher resiliency while still experiencing elevated distress. Lastly, only resilience measures that included positive functioning – such as positive affect and resiliency perceptions – were associated with BMI. Positive psychological domains may be particularly relevant for physical health and future research on resilience and health should aim to incorporate positive functioning, not solely absence of distress. These findings, coupled with general consensus in the literature that there is no single ‘resilience’ definition (Southwick et al., Reference Southwick, Bonanno, Masten, Panter-Brick and Yehuda2014), emphasize the need for researchers to clearly define the conceptual definition of resilience for the population and research question, and provide a detailed description of the measurement choice. In so doing, the field will be better poised to develop intervention and prevention efforts that ultimately may promote overall positive adaptation in the face of adversity.
Supplementary material
The supplementary material for this article can be found at https://doi.org/10.1017/S0033291720001191.
Acknowledgements
Research reported in this publication was supported by the National Institute of Mental Health within the National Institutes of Health under Award Numbers T32MH017119 (Nishimi and Choi), MH102890 (Powers), K01MH102403 (Dunn), and R01MH113930 (Dunn). The content is solely the responsibility of the authors and does not necessarily represent the official views of the National Institutes of Health. Additionally, the contents of this report do not represent the views of the Department of Veterans Affairs or the US Government.
Conflicts of interest
None.
Ethical standards
The authors assert that all procedures contributing to this work comply with the ethical standards of the relevant national and institutional committees on human experimentation and with the Helsinki Declaration of 1975, as revised in 2008.


