


1.0 INTRODUCTION
The most reliable way to assess the viability of a structural component in aerospace industry is to test it under a condition that closely represents the actual loading and boundary conditions.(Reference Schuster1) This approach becomes more critical when a structure is made of composite materials that are relatively new compared to metals and understanding their behaviour is still under development.
The steadily increased interest in using composite materials in aerospace structures is primarily due to their potential for weight reduction arising from their superior specific properties over metals. Development of advanced composites for aerospace application has been both costly and potentially risky. Development was initiated by the military where the major driving factor is performance. The Bell-Boeing V-22 Osprey uses 50% composites, whereas Boeing’s C-17 contains 7,300kg of structural composites.(Reference Giurgiutiu2) Boeing 787 and Airbus A350 are two examples of large commercial aircraft in which more than 50% of the structural weight (more than 80% by volume) are made from composites.(Reference Giurgiutiu2-4) In particular, thermoplastic composites have recently gained more interest in the aerospace industry due to their potential for recycling, fast forming and weldability, improved fatigue performance, impact properties and fire/smoke/toxicity properties compared to thermoset composites.(Reference Roux, EguÉmann, Dransfeld, ThiÉbaud and Perreux5) Moreover, their potential for out-of-autoclave (OOA) processing make thermoplastic composites more appealing for low-cost and high-rate production. Despite the fact that thermoplastics have found applications in some aircraft including the US military’s F-22 fighter jet landing-gear and weapons-bay doors in the 1980s,(6) leading edges of the aircraft A340 and A380,(Reference Gardiner7) the vertical and horizontal tail plane in the AgustaWestland AW169 rotorcraft23(Reference Roux, EguÉmann, Dransfeld, ThiÉbaud and Perreux8) and the fixed wing leading edge on the Airbus A380,(Reference Pora9) there are still several manufacturing and in-service reliability challenges that need to be addressed to further de-risk use of thermoplastic composites in large primary aerospace structures.
Automated fibre/tape placement (AFP/ATP), as an advanced robotic composite manufacturing technique, has also boosted the interest for using composite components in aircraft structures due to its advantages over conventional hand-layup methods including, but not limited to, higher levels of accuracy, repeatability, higher production rate and its capability to manufacture complex structures that is not possible with conventional methods. One of the unique capabilities of ATP is fibre/tow steering by which the fibre orientations in a composite ply can be continuously changed to make a variable angle tow (VAT) lamina at a ply level. The so called variable stiffness laminates contain VAT plies which give the designers enhanced scope to tailor the stiffness properties of a composite structure for improved load carrying and/or reduced weight. Process-induced defects and presence of gaps/overlaps between the steered tows are among several challenges within tow steering that are the subject of ongoing research.
Wingboxes are one of the heavily loaded primary structures in an aircraft that if made from metals numerous joints are needed to connect several parts of their complex shape into a single assembly. Making them from composites has the potential to minimise the number of connections between its components and reduce the assembly time/cost and maximise weight saving and load carrying capacity, simultaneously. As recently as 2017 Airbus made the first single-piece composite centre wingbox using thermoset material cured in an autoclave with improved load-bearing properties and 20% reduction in manufacturing costs.(10)
Towards addressing these challenges, an OOA, variable stiffness, unitised, integrated-stiffener thermoplastic wingbox demonstrator was successfully designed and manufactured at the University of Limerick. A laser-assisted ATP was used in manufacturing of the wingbox components and with in-situ assembly to a single-piece without any mechanical fasteners or joints. Therefore, the assembly time and cost is significantly reduced. The production time and complexity was also considerably reduced (by up to 70%)Footnote 1 compared to thermoset composites because of using the OOA manufacturing method. By making it blended, in-plane stiffness mismatches between different parts are minimised, and therefore, interlaminar stresses are reduced. The load is also redistributed via stiffness tailoring (tow steering) that results in improved buckling load carrying capacity. This wingbox was successfully tested, loading it with a shear force and bending moment, representative of the load at 85% semi-span of a B-737/A320 sized aircraft. This work has previously been reported by Oliveri et al.(Reference Oliveri, Zucco, Peeters, Telford, Clancy, Rouhi, McHale, O’Higgins, Young and Weaver11)
Currently, we build upon this previous work(Reference Oliveri, Zucco, Peeters, Telford, Clancy, Rouhi, McHale, O’Higgins, Young and Weaver11) by testing the wingbox under another load case in which torsion is also introduced, i.e. a combined shear-bending-torsion (SBT) load. This torsion arises from the offset between the centre of pressure where the resulting lifting force acts and the wingbox centre. To perform the test, the test rig was modified and reassessed to accommodate the combined SBT load case. A thorough finite element (FE) analysis was also performed in advance to investigate the buckling behaviour as well as the stress and strain state of the wingbox subjected to the SBT load. The rest of this paper is organised as follows: The design and manufacture of the wingbox is described in Section 2. The test setup for applying shear-bending-torsion load on the wingbox, computational analysis and predictions are discussed in Section 3. The test results and comparison with analysis are discussed in Section 4. Finally, the concluding remarks are given in Section 5.
2.0 DESIGN AND MANUFACTURE OF THE WINGBOX
The wingbox was chosen to be representative of a civil aircraft (e.g. B-737/A320) with a wingspan (2b) of 36m and maximum take-off weight (MTOW) of 75,000kg, as illustrated in Fig. 1. Since it was a manufacturing demonstrator, it is worth noting that the overall design process does not reflect a real wingbox structure for this type of aircraft. Therefore, the design did not take into account all regulations of real flight vehicle structures. The section was assumed to have a length of  $l=750$
mm in between two ribs referred to as sections A and B in Fig. 1.
$l=750$
mm in between two ribs referred to as sections A and B in Fig. 1.
Table 1 Material properties of the in-situ consolidated thermoplastic tow


Figure 1. Positioning of the wingbox section and loads.
The properties of the carbon fibre thermoplastic material used in manufacturing the wingbox are shown in Table 1 and the geometrical features including the stiffeners shape and geometry are shown in Fig. 2.
The chosen layup is shown in Table 2, where  $(0\pm\langle52|35\rangle)$
denotes the steered parts, which are
$(0\pm\langle52|35\rangle)$
denotes the steered parts, which are  $35^{\circ}$
at the sides of the stiffener and
$35^{\circ}$
at the sides of the stiffener and  $52^{\circ}$
in the middle between the stiffeners connected through a circular path. In this case, tow steering tailors the axial stiffness such that the panel becomes less stiff at the middle and stiffer at the two sides of the skin bays. In this way, the axial load has been redistributed towards the stiffeners that act as supports for the panel such that panel buckling is delayed. Overall, the layup is more constraint-driven than that of a fully optimised design. Therefore, there remains scope for improvement in buckling and postbuckling behaviour for this wingbox, as discussed by Liguori et al.(Reference Liguori, Zucco, Madeo, Magisano, Leonetti, Garcea and Weaver12) The design process of the wingbox is elaborated with more details in Ref. [Reference Oliveri, Zucco, Peeters, Telford, Clancy, Rouhi, McHale, O’Higgins, Young and Weaver11].
$52^{\circ}$
in the middle between the stiffeners connected through a circular path. In this case, tow steering tailors the axial stiffness such that the panel becomes less stiff at the middle and stiffer at the two sides of the skin bays. In this way, the axial load has been redistributed towards the stiffeners that act as supports for the panel such that panel buckling is delayed. Overall, the layup is more constraint-driven than that of a fully optimised design. Therefore, there remains scope for improvement in buckling and postbuckling behaviour for this wingbox, as discussed by Liguori et al.(Reference Liguori, Zucco, Madeo, Magisano, Leonetti, Garcea and Weaver12) The design process of the wingbox is elaborated with more details in Ref. [Reference Oliveri, Zucco, Peeters, Telford, Clancy, Rouhi, McHale, O’Higgins, Young and Weaver11].
A combination of winding and laser-assisted tape placement (LATP) were used to manufacture the wingbox and stiffeners. The stiffeners were made separately first and then were placed in a mould. Afterwards, the first layer, i.e. the  $90^{\circ}$
tows, were placed over the mould and stiffeners to result in a unitised, integrated-stiffener box due to in-situ consolidation of the PEEK material at the interface of skin and stiffeners (Fig. 3). The manufacturing challenges and quality of the final product in terms of the interfacial bond strength and quality of steered parts and corners are described in detail in Refs. (Reference Bandaru, Clancy, Peeters, Oiggins and Weaver13) and (Reference Clancy, Peeters, Oliveri, Jones, Oiggins and Weaver14).
$90^{\circ}$
tows, were placed over the mould and stiffeners to result in a unitised, integrated-stiffener box due to in-situ consolidation of the PEEK material at the interface of skin and stiffeners (Fig. 3). The manufacturing challenges and quality of the final product in terms of the interfacial bond strength and quality of steered parts and corners are described in detail in Refs. (Reference Bandaru, Clancy, Peeters, Oiggins and Weaver13) and (Reference Clancy, Peeters, Oliveri, Jones, Oiggins and Weaver14).
Table 2 Layups used for the wingbox with variable angle tow (VAT) sections


Figure 2. Geometry of the wingbox (dimensions are in mm).

Figure 3. Stiffeners put in place in the mould and skin plies placed over them.
The finished wingbox, with the steered layers on the outside of the skin bays, is shown in Fig. 4. It is worth noting that gaps/overlaps generated in the steered plies are inevitable when conventional AFP/ATP manufacturing is used. In this work our philosophy was not to cut fibres in plies and also to keep plies as plane as possible. The former reduces effects of localised stress concentrations and the latter keeps load paths planar rather than undulating as would happen with overlaps. Therefore, the shifting distance between adjacent steered tows was designed to have small gaps and no overlaps in the tow-steered plies. Notably, the gaps were sufficiently small that they did not result in large thickness variation in the finished wingbox skin. It is also worth stating that the effects of these gaps were not considered in the analyses performed in this study.

Figure 4. Finished wingbox: (a) side view, (b) section view and (c) during strain gauge installation.
3.0 TEST SETUP, MODELING AND ANALYSIS FOR TESTING
The shear force and bending moment were determined by assuming that the wingbox section lies at approximately 85% of the wing semi-span of a B-737/A320 sized aircraft flying in cruise condition. It was assumed that the lift was elliptically distributed over the wing span and the resulting chord-wise aerodynamic moment on the wing was zero, i.e. there was no torsional load on the wingbox cross-section. This last assumption is now challenged: in reality the resulting load acts at the centre of pressure of the airfoil, which usually does not coincide with the centre of the wingbox cross-section. To simulate this state of the loading, the load introduction point was shifted by an offset distance from the centre of the wingbox to generate a torque in addition to shear and bending. The test rig allows maximum value of the offset  $e = 240$
mm from the centre of the wingbox. This offset distance was chosen to apply the maximum torque along with the previously applied shear and bending to assess the viability of the wignbox subjected to the combined SBT load case. The torque to bending ratio at the end section of the wingbox, for such offset distance, was calculated to be
$e = 240$
mm from the centre of the wingbox. This offset distance was chosen to apply the maximum torque along with the previously applied shear and bending to assess the viability of the wignbox subjected to the combined SBT load case. The torque to bending ratio at the end section of the wingbox, for such offset distance, was calculated to be  $T/M = 0.18$
.
$T/M = 0.18$
.
A schematic of the Shear-Bending-Torsion test is shown in Fig. 5, in which the load was applied at one end and reacted by the middle and end supports. To this end, a steel test frame was designed and built. In addition, two dummy wingboxes made of mainly aluminium were designed, manufactured and attached to the composite wingbox to avoid boundary effects and stress concentrations in the composite wingbox during loading, as well as to facilitate the smooth transition of the load from the load introduction mechanism to the supports. The shape of the cross sections, as well as the flexural stiffness of the dummy wingboxes were designed and built so that they conform and match as closely as possible with those of the composite wingbox.(Reference Zucco, Oliveri, Peeters, Telford, Clancy, McHale, Rouhi, O’Higgins, Young and Weaver15) Figure 6 shows the manufactured test frame and the wingbox assembly.

Figure 5. The schematic of the testing assembly and the parts (dimensions are in mm).

Figure 6. The wingbox assembly installed on the test frame: (a) front and (b) rear view.
3.1 Test frame assessment for combined loading
The combined SBT load was applied by shifting the load introduction point by a prescribed offset distance (240mm) from the centre of the wingbox cross-section. To this end, the steel box that supports the load introduction unit (jack-screw) was replaced by a modified one to accommodate the offset. The rest of the test set-up remains as it was for shear-bending. Figure 7 shows the above mentioned modification. The whole test frame as it was for the SB test, as well as the modified one for the SBT test are shown in Fig. 8.

Figure 7. Modification of the load introduction (jack-screw) support steel box for SBT test. (a) Steel box that supports the jack-screw unit in SB test. (b) Steel box that supports the jack-screw unit in SBT test.

Figure 8. Modification of the steel test frame for SBT test. (a) Steel frame in the SB test. (b) Steel frame in the new (SBT) test.
3.2 Dummy wingboxes assessment for combined loading
The highly stressed regions of the dummy wingboxes, i.e. areas in contact with the reaction points and near the load introduction and boundaries, were reinforced by internal support structures to prevent failure.(Reference Zucco, Oliveri, Peeters, Telford, Clancy, McHale, Rouhi, O’Higgins, Young and Weaver15) These regions along with the reaction points were reassessed for the SBT loading because of the non-uniform distribution of the reaction forces in those areas due to the added torsion. The reinforcements were found to be sufficiently strong and no modifications were necessary.
3.3 Wingbox assessment for combined loading
Prior to experimental testing, a numerical study was performed to predict the structural response of the wingbox subjected to the SBT load case. To this end, a finite element model of the wingbox was generated and analysed for the SBT loading. A nonlinear analysis was performed first using a two-dimensional (2D) model in which the composite wingbox was considered as a layered composite shell structure. After identifying the critical regions (highly stressed and strained areas), the 2D model was enhanced by modelling the critical regions with three-dimensional (3D) finite elements. Then this so-called mixed model was analyzed for further investigation of the critical regions for failure prediction.
For the 2D model, ABAQUS S4R shell elements were used with six degrees of freedom (DoF) at each of its four nodes. The S4R element accepts only fixed material properties. Therefore, to model variable material properties in the fibre-steered areas, a piece-wise constant approximation was used. Then, a mesh convergence study was performed that resulted in 3mm  $\times$
3mm as an appropriate element size for converged results, that is the same size previously used for studying the composite wingbox subjected to shear and bending moment.(Reference Oliveri, Peeters, Clancy, O’Higgins, Jones and Weaver16) Using this mesh size, the linear buckling load
$\times$
3mm as an appropriate element size for converged results, that is the same size previously used for studying the composite wingbox subjected to shear and bending moment.(Reference Oliveri, Peeters, Clancy, O’Higgins, Jones and Weaver16) Using this mesh size, the linear buckling load  $\lambda_{cr}$
converged with four significant digits. In the next step, a geometrically non-linear analysis was performed for the wingbox subjected to a load equal to the obtained first linear buckling load using the Riks algorithm.
$\lambda_{cr}$
converged with four significant digits. In the next step, a geometrically non-linear analysis was performed for the wingbox subjected to a load equal to the obtained first linear buckling load using the Riks algorithm.
In the mixed model, the same S4R elements were used in the 2D parts, whereas for the 3D parts (highly stressed regions) C3D8R brick (solid) elements with 4 + 4 nodes and 3 DoF per node were used. The in-plane dimensions of the brick finite elements were kept the same as the shell elements (3mm  $\times$
3mm). To have an accurate prediction of the stress and strain fields through the thickness, five brick elements were used for each ply.
$\times$
3mm). To have an accurate prediction of the stress and strain fields through the thickness, five brick elements were used for each ply.
In the SBT load case the critical regions were expected to be the corner regions between the skin and the spar webs, and also at the interface between the skin and the stiffeners. Therefore, the stresses and strains were investigated in these areas in the FE models to assess the risk of applying the SBT load.
It is worth noting that in all analyses the critical regions were solely identified based on their maximum strains. In other words, the maximum strain was considered as the failure criterion for all regions. The skin/stiffener interface was considered to be perfect and delamination was not included in our simulations. As observed in the experimental test, no delamination or failure/damage occurred. However, stiffener/skin failure issues are important and have been considered in parallel works.(Reference Bandaru, Clancy, Peeters, Oiggins and Weaver13,Reference Peeters, Clancy, Oliveri, Oiggins, Jones and Weaver17)
The wingbox with VAT skin section was modelled with the dimensions of  $750\times640\times240$
mm and a clamped boundary condition at the rear section. The 110mm reduced length (i.e. 640mm compared to 750mm in Fig. 2) arises because of 55mm overlap the wingbox has with each of the two dummy wingboxes in assembly. In the SB load case, the wingbox underwent a vertical shear load of
$750\times640\times240$
mm and a clamped boundary condition at the rear section. The 110mm reduced length (i.e. 640mm compared to 750mm in Fig. 2) arises because of 55mm overlap the wingbox has with each of the two dummy wingboxes in assembly. In the SB load case, the wingbox underwent a vertical shear load of  $23.8$
kN and a bending moment of
$23.8$
kN and a bending moment of  $14.3$
kNm. Both loads were introduced at the shear centre of the front section as point loads and distributed along the whole section via rigid links between the loading point and the cross section of the wingbox in that location. A torsional moment of
$14.3$
kNm. Both loads were introduced at the shear centre of the front section as point loads and distributed along the whole section via rigid links between the loading point and the cross section of the wingbox in that location. A torsional moment of  $5.76$
kNm was also considered in the combined SBT load case. This value for the torsional moment was obtained from the eccentricity
$5.76$
kNm was also considered in the combined SBT load case. This value for the torsional moment was obtained from the eccentricity  $e=240$
mm of the applied shear load from the centre of the section. The material properties of the unidirectional ply, layups of skin, stiffeners and spar webs, are the same as those considered in the previous work(Reference Oliveri, Peeters, Clancy, O’Higgins, Jones and Weaver16) and listed in Tables 1 and 2. The nonlinear analysis was performed using Riks algorithm in Abaqus FE software.
$e=240$
mm of the applied shear load from the centre of the section. The material properties of the unidirectional ply, layups of skin, stiffeners and spar webs, are the same as those considered in the previous work(Reference Oliveri, Peeters, Clancy, O’Higgins, Jones and Weaver16) and listed in Tables 1 and 2. The nonlinear analysis was performed using Riks algorithm in Abaqus FE software.
In the Riks analysis the loads corresponding to the linear buckling load were applied comprising a transverse shear of  $28.0$
kN, a resulting bending moment of
$28.0$
kN, a resulting bending moment of  $16.8$
kNm and a torsional moment of
$16.8$
kNm and a torsional moment of  $6.72$
kNm due to the 240mm offset. The displacement contour maps corresponding to this combination of loads are shown in Fig. 9. In particular, Fig. 9(a) and (b) show the out-of-plane displacements in the skin and the web, respectively. The buckling occurrence can be observed in both skin bays and the web. However, when comparing the maximum out-of-plane displacements due to localised bending it can be observed that in the skin bay (Fig. 9(a)) it is inward and about four times higher than the web (Fig. 9(b)). In other words, the onset of buckling remains in the skin bay for the SBT load case.
$6.72$
kNm due to the 240mm offset. The displacement contour maps corresponding to this combination of loads are shown in Fig. 9. In particular, Fig. 9(a) and (b) show the out-of-plane displacements in the skin and the web, respectively. The buckling occurrence can be observed in both skin bays and the web. However, when comparing the maximum out-of-plane displacements due to localised bending it can be observed that in the skin bay (Fig. 9(a)) it is inward and about four times higher than the web (Fig. 9(b)). In other words, the onset of buckling remains in the skin bay for the SBT load case.

Figure 9. Displacements (in mm) contour map at the buckled state. (a) Displacement  $\textit{u}_{\textit{y}}$
. (b) Displacement
$\textit{u}_{\textit{y}}$
. (b) Displacement  $\textit{u}_{\textit{x}}$
.
$\textit{u}_{\textit{x}}$
.
Figure 10 shows the shear stress  $\sigma_{\textit{zx}}$
contour maps. As expected, the combination of the shear and torsion results in a nonsymmetric distribution with a relatively low maximum value of
$\sigma_{\textit{zx}}$
contour maps. As expected, the combination of the shear and torsion results in a nonsymmetric distribution with a relatively low maximum value of  $\sigma_{\textit{zx}}=16.4$
MPa in the right side of the wingbox at the corner region. Figure 10(b) shows the shear stress
$\sigma_{\textit{zx}}=16.4$
MPa in the right side of the wingbox at the corner region. Figure 10(b) shows the shear stress  $\sigma_{zx}$
at the skin-stiffener interface and the spar webs. The maximum value of
$\sigma_{zx}$
at the skin-stiffener interface and the spar webs. The maximum value of  $\sigma_{zx}$
in this region also occurs for the two stiffeners on the right side of the wingbox. As expected, its variation remains almost linear with respect to the distance to the shear centre of each section with an insignificant maximum value of 4MPa.
$\sigma_{zx}$
in this region also occurs for the two stiffeners on the right side of the wingbox. As expected, its variation remains almost linear with respect to the distance to the shear centre of each section with an insignificant maximum value of 4MPa.

Figure 10. Shear stress  $\sigma_{\textit{zx}}$
at the buckling load. (a) Maximum values of shear stress
$\sigma_{\textit{zx}}$
at the buckling load. (a) Maximum values of shear stress  $\sigma_{\textit{zx}}$
(MPa). (b) Shear stress
$\sigma_{\textit{zx}}$
(MPa). (b) Shear stress  $\sigma_{\textit{zx}}$
(MPa) at skin-stiffener interface.
$\sigma_{\textit{zx}}$
(MPa) at skin-stiffener interface.
Figure 11 reveals that the shear stresses  $\sigma_{xy}$
at the skin-stiffener interface and at the corner regions are also small. The numerical results show the maximum values of
$\sigma_{xy}$
at the skin-stiffener interface and at the corner regions are also small. The numerical results show the maximum values of  $\sigma_{xy}=2.0$
MPa and
$\sigma_{xy}=2.0$
MPa and  $\sigma_{xy}=3.5$
MPa at the skin-stiffener interface and the corner regions, respectively. As shown in Fig. 12, the numerical results present small values of
$\sigma_{xy}=3.5$
MPa at the skin-stiffener interface and the corner regions, respectively. As shown in Fig. 12, the numerical results present small values of  $\sigma_{zy}$
. In particular, its maximum value is
$\sigma_{zy}$
. In particular, its maximum value is  $\sigma_{zy}=3.5$
MPa in the corner region and
$\sigma_{zy}=3.5$
MPa in the corner region and  $\sigma_{zy}=1.5$
MPa at the skin-stiffener interface.
$\sigma_{zy}=1.5$
MPa at the skin-stiffener interface.

Figure 11. Shear stress  $\sigma_{\textit{xy}}$
at the buckling load. (a) Maximum values of the shear stress
$\sigma_{\textit{xy}}$
at the buckling load. (a) Maximum values of the shear stress  $\sigma_{\textit{xy}}$
(MPa). (b) Shear stress
$\sigma_{\textit{xy}}$
(MPa). (b) Shear stress  $\sigma_{\textit{xy}}$
(MPa) at the skin-stiffener interface.
$\sigma_{\textit{xy}}$
(MPa) at the skin-stiffener interface.

Figure 12. Shear stress  $\sigma_{\textit{zy}}$
at the buckling load. (a) Maximum values of the shear stress
$\sigma_{\textit{zy}}$
at the buckling load. (a) Maximum values of the shear stress  $\sigma_{\textit{zy}}$
(MPa). (b) Shear stress
$\sigma_{\textit{zy}}$
(MPa). (b) Shear stress  $\sigma_{\textit{zy}}$
(MPa) at the skin-stiffener interface.
$\sigma_{\textit{zy}}$
(MPa) at the skin-stiffener interface.
Overall, shear stresses are found to be not critical for the wingbox. Particularly for the skin-stiffener interface (which, at first sight, could be considered as areas prone to failure due to shear debonding), their large distance from the neutral plane of the wingbox results in relatively low shear stresses in this region, so as to be considered to be not critical.
The contour maps of the strain fields are shown in Fig. 13. The FE analysis results show that the maximum shear strain,  $\varepsilon_{\textit{zx}}=3,300\mu\epsilon$
, occurs at the corner region between the skin and the spar web, as shown in Fig. 13(c). This is in agreement with an experienced designer’s intuition that the corner region is the most critical area for the wingbox integrity when loaded under the SBT load case. It is worth noting that although the strain value is high in this region, it is highly localised at the corner region attached to the boundary. Therefore, in reality, for a sufficiently long unitised wingbox with varying thickness this highly localised strain would be alleviated. Note that in the location where the shear strain is maximum, the values of
$\varepsilon_{\textit{zx}}=3,300\mu\epsilon$
, occurs at the corner region between the skin and the spar web, as shown in Fig. 13(c). This is in agreement with an experienced designer’s intuition that the corner region is the most critical area for the wingbox integrity when loaded under the SBT load case. It is worth noting that although the strain value is high in this region, it is highly localised at the corner region attached to the boundary. Therefore, in reality, for a sufficiently long unitised wingbox with varying thickness this highly localised strain would be alleviated. Note that in the location where the shear strain is maximum, the values of  $\varepsilon_{\textit{zz}}$
and
$\varepsilon_{\textit{zz}}$
and  $\varepsilon_{\textit{xx}}$
are considerably less than that as shown in Fig. 13(a) and (b).
$\varepsilon_{\textit{xx}}$
are considerably less than that as shown in Fig. 13(a) and (b).

Figure 13. Strain fields contour maps at the buckling load. (a) Maximum value of strain  $\varepsilon_{\textit{zz}}$
. (b) Maximum value of strain
$\varepsilon_{\textit{zz}}$
. (b) Maximum value of strain  $\varepsilon_{\textit{xx}}$
. (c) Maximum value of shear strain
$\varepsilon_{\textit{xx}}$
. (c) Maximum value of shear strain  $\varepsilon_{\textit{zx}}$
.
$\varepsilon_{\textit{zx}}$
.
Following identification of the critical regions in the 2D model, the mixed FE model partially meshed with 3D elements was generated to further study the stress and strain states in those regions with more accuracy and details. Figure 14 shows the mixed model in which the right hand corner regions were meshed by 3D finite elements.

Figure 14. The mixed model in which the critical region (top right corner) was meshed by 3D finite elements.
Figure 15 shows the displacement contour maps resulting from the nonlinear analysis of the mixed FE model using the Riks algorithm. As expected, the results are in agreement with the 2D model results (Fig. 9) at the same load.

Figure 15. Displacements contour maps at the buckled state using the mixed model. (a) Displacement  $\textit{u}_{\textit{y}}$
. (b) Displacement
$\textit{u}_{\textit{y}}$
. (b) Displacement  $\textit{u}_{\textit{x}}$
.
$\textit{u}_{\textit{x}}$
.
The in-plane shear stress ( $\sigma_{\textit{zx}}$
) contour is shown in Fig. 16. The highest value of this shear stress occurs at the same region that the 2D model predicted (Fig. 10), i.e. in the skin-spar web corner region and its highest value is again highly localised at the boundary side as in the 2D model.
$\sigma_{\textit{zx}}$
) contour is shown in Fig. 16. The highest value of this shear stress occurs at the same region that the 2D model predicted (Fig. 10), i.e. in the skin-spar web corner region and its highest value is again highly localised at the boundary side as in the 2D model.

Figure 16. Shear stress  $\sigma_{\textit{zx}}$
(MPa) at the buckling load using the mixed model.
$\sigma_{\textit{zx}}$
(MPa) at the buckling load using the mixed model.
Figure 17 shows the value of the shear stresses  $\sigma_{\textit{xy}}$
at the the corner region. The numerical results of the mixed model show a higher, yet still small, value of the maximum shear stress
$\sigma_{\textit{xy}}$
at the the corner region. The numerical results of the mixed model show a higher, yet still small, value of the maximum shear stress  $\sigma_{xy}=25$
MPa compared to the 2D model (see Fig. 11).
$\sigma_{xy}=25$
MPa compared to the 2D model (see Fig. 11).
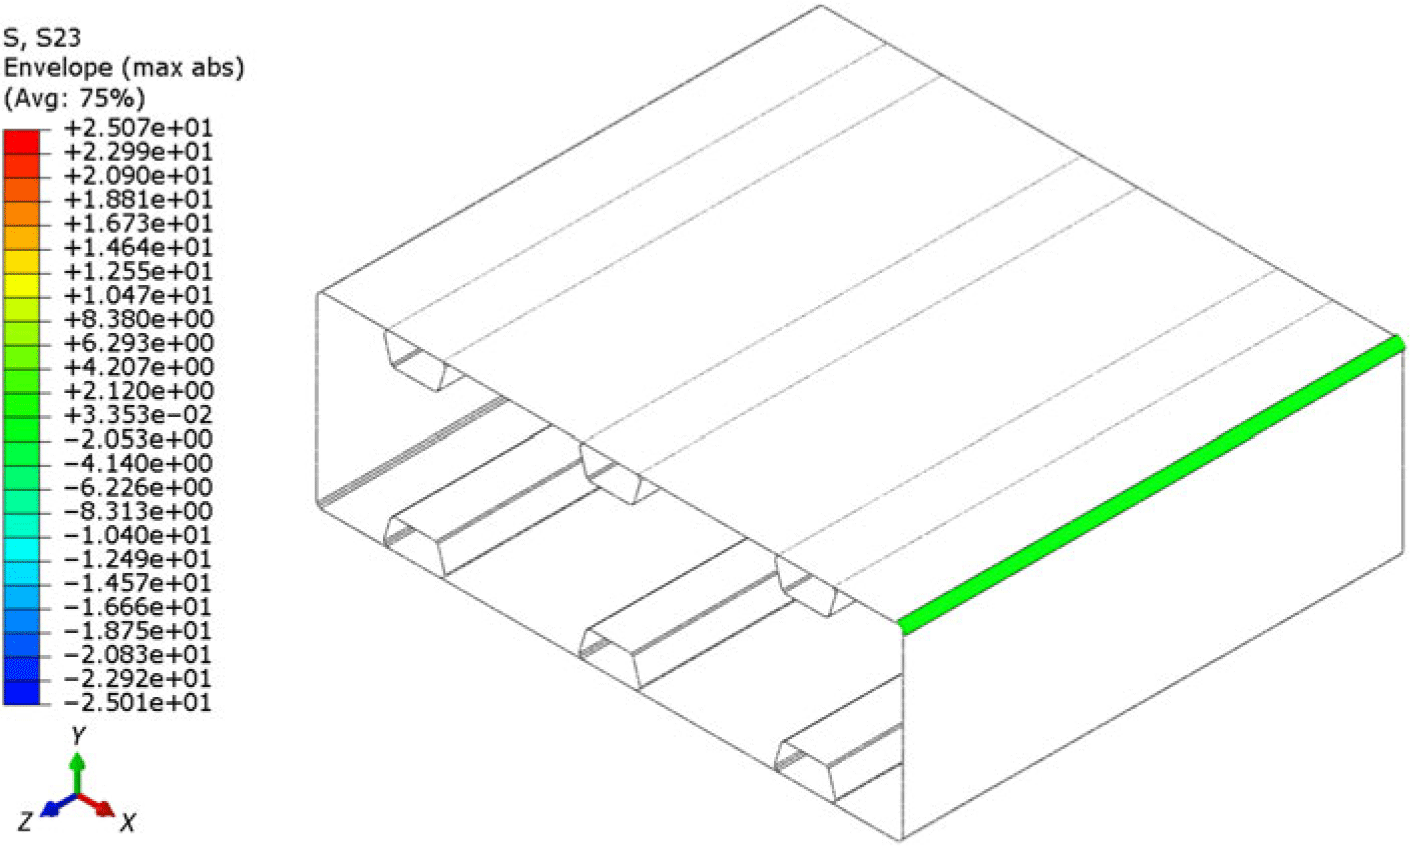
Figure 17. Shear stress  $\sigma_{\textit{xy}}$
(MPa) at the buckling load using the mixed model.
$\sigma_{\textit{xy}}$
(MPa) at the buckling load using the mixed model.
Figure 18 shows the values of the out-of-plane shear stress  $\sigma_{\textit{zy}}$
in the critical regions using the mixed model. Although the maximum value
$\sigma_{\textit{zy}}$
in the critical regions using the mixed model. Although the maximum value  $\sigma_{zy}=22$
MPa is higher than the 2D model (see Fig. 12) it is not significantly high.
$\sigma_{zy}=22$
MPa is higher than the 2D model (see Fig. 12) it is not significantly high.

Figure 18. Shear stress  $\sigma_{\textit{zy}}$
(MPa) at the buckling load using the mixed model.
$\sigma_{\textit{zy}}$
(MPa) at the buckling load using the mixed model.
The normal stresses are also shown in Fig. 19 in which the dominant normal stress is  $\sigma_{\textit{zz}}$
with its largest value in the range of 340–360MPa, yet highly localised at the boundary region.
$\sigma_{\textit{zz}}$
with its largest value in the range of 340–360MPa, yet highly localised at the boundary region.
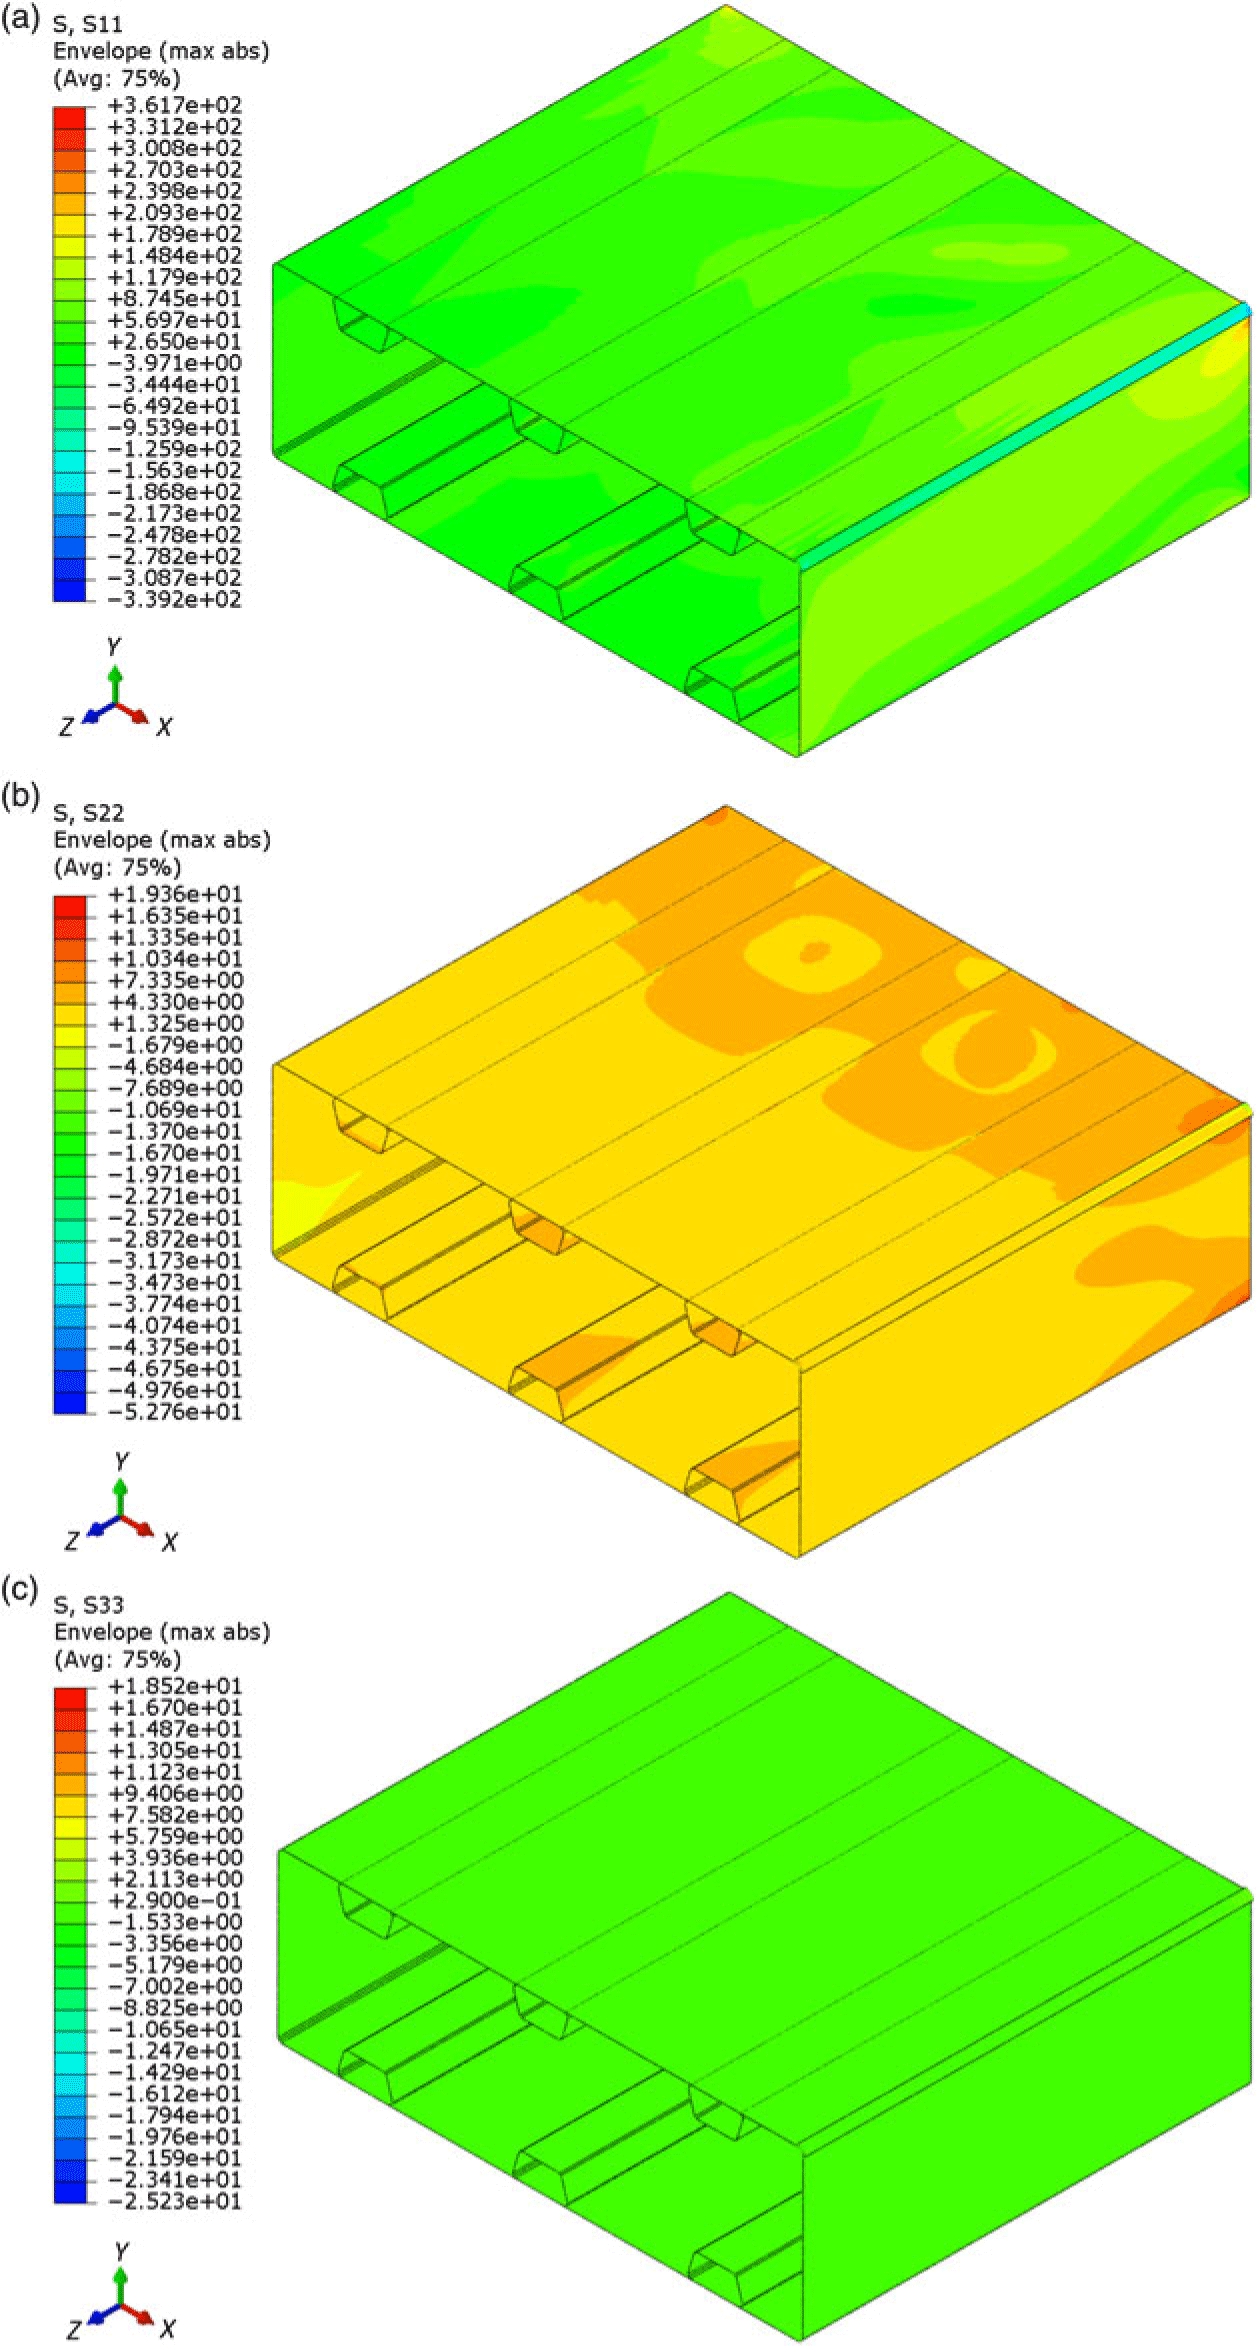
Figure 19. Normal stress fields contour map at the buckling load using the mixed model. (a) Maximum value of normal stress  $\sigma_{\textit{zz}}$
(MPa). (b) Maximum value of normal stress
$\sigma_{\textit{zz}}$
(MPa). (b) Maximum value of normal stress  $\sigma_{\textit{xx}}$
(MPa). (c) Maximum value of normal stress
$\sigma_{\textit{xx}}$
(MPa). (c) Maximum value of normal stress  $\sigma_{\textit{yy}}$
(MPa).
$\sigma_{\textit{yy}}$
(MPa).
The normal and shear strains are shown in Figs. 20 and 21, respectively. As observed, the normal strains are all less than 2,500 $\mu\epsilon$
, which is believed to be below the strain allowable of the thermoplastic composite material that was used in the wingbox. However, the maximum shear strains show large values,
$\mu\epsilon$
, which is believed to be below the strain allowable of the thermoplastic composite material that was used in the wingbox. However, the maximum shear strains show large values,  $\varepsilon_{zx}=$
5,000
$\varepsilon_{zx}=$
5,000 $\mu\epsilon$
and
$\mu\epsilon$
and  $\varepsilon_{xy}=$
3,500
$\varepsilon_{xy}=$
3,500 $\mu\epsilon$
in the corner regions. It is worth noting that these relatively large strains do not occur in the same plies, yet are high and should be avoided to prevent wingbox failure.
$\mu\epsilon$
in the corner regions. It is worth noting that these relatively large strains do not occur in the same plies, yet are high and should be avoided to prevent wingbox failure.

Figure 20. Normal strain fields contour maps at the buckling load using the mixed model. (a) Maximum value of normal strain  $\varepsilon_{\textit{zz}}$
. (b) Maximum value of normal strain
$\varepsilon_{\textit{zz}}$
. (b) Maximum value of normal strain  $\varepsilon_{\textit{xx}}$
. (c) Maximum value of normal strain
$\varepsilon_{\textit{xx}}$
. (c) Maximum value of normal strain  $\varepsilon_{\textit{yy}}$
.
$\varepsilon_{\textit{yy}}$
.

Figure 21. Shear strain fields contour maps at the buckling load using the mixed model. (a) Maximum value of shear strain  $\varepsilon_{\textit{zx}}$
. (b) Maximum value of shear strain
$\varepsilon_{\textit{zx}}$
. (b) Maximum value of shear strain  $\varepsilon_{\textit{zy}}$
. (c) Maximum value of shear strain
$\varepsilon_{\textit{zy}}$
. (c) Maximum value of shear strain  $\varepsilon_{\textit{xy}}$
.
$\varepsilon_{\textit{xy}}$
.
To evaluate the maximum strain values in the SBT load case, an investigation of the strain profile through the thickness was also conducted. In particular, since the highest values of strain were observed at the top right corner of the wingbox in the support side, the strain profiles were obtained for this zone only and compared with the maximum allowable principal strain which was set at 2,500 $\mu\epsilon$
in this study. Figures 22 and 23 show the normal and shear strain profiles through the thickness. All values of strain are normalised by the maximum allowable principal strain. In all plots the red line represents the strain value at the buckling load for the SBT loading condition, whereas the blue dotted line corresponds to the SB loading condition and the green dashed line represents the value of the maximum allowable strain. It is worth noting that the added torsion, which is considerable, did not significantly change the maximum strain values in SBT compared with SB loading case. Although the analysis shows that the maximum shear strains are
$\mu\epsilon$
in this study. Figures 22 and 23 show the normal and shear strain profiles through the thickness. All values of strain are normalised by the maximum allowable principal strain. In all plots the red line represents the strain value at the buckling load for the SBT loading condition, whereas the blue dotted line corresponds to the SB loading condition and the green dashed line represents the value of the maximum allowable strain. It is worth noting that the added torsion, which is considerable, did not significantly change the maximum strain values in SBT compared with SB loading case. Although the analysis shows that the maximum shear strains are  $\varepsilon_{xy}$
and
$\varepsilon_{xy}$
and  $\varepsilon_{zx}$
and occur at the corner which is the most critical area, the contour of the strains (Figs. 20 and 21) show that it is highly localised and is related to boundary effects of the FE analysis. In other words, in reality the strains are expected to be lower than those predicted by FE analysis.
$\varepsilon_{zx}$
and occur at the corner which is the most critical area, the contour of the strains (Figs. 20 and 21) show that it is highly localised and is related to boundary effects of the FE analysis. In other words, in reality the strains are expected to be lower than those predicted by FE analysis.

Figure 22. Through the thickness normal strain profiles at the buckling load evaluated at the right top corner of the support side of the wingbox.

Figure 23. Through the thickness shear strain profiles at the buckling load evaluated at the right top corner of the support side of the wingbox.
To further study the structural behaviour of the wingbox assembly, a full model was also generated including the dummy wingboxes attached to the composite wingbox with their associated loading and boundary conditions. The load was applied at an auxiliary beam linked to the dummy wingbox at the loading side and the other end was simply supported. The middle support condition was also simulated by fixing the vertical movement of the nodes of the assembly at the contact line in that location. The vertical displacement of the assembly in four load values are shown in Fig. 24. It shows a vertical displacement of about 28mm at the loading end bottom part of the wingbox assembly in the load offset side and of about 22mm at the opposite side, where the displacement gauges are installed in the test (Point A and Point B in Fig. 24). The predicted 6mm difference quantifies the amount of twisting at  $F = 31$
kN which is approximately 10% above the predicted buckling load. The load-displacement profile also shows an almost linear behaviour of the wingbox assembly during loading/unloading. It is worth noting that the 2mm initial offset of the load-displacement plot is due to a small gap set initially between the wingbox assembly and the middle support as an initial condition in the finite element simulation.
$F = 31$
kN which is approximately 10% above the predicted buckling load. The load-displacement profile also shows an almost linear behaviour of the wingbox assembly during loading/unloading. It is worth noting that the 2mm initial offset of the load-displacement plot is due to a small gap set initially between the wingbox assembly and the middle support as an initial condition in the finite element simulation.

Figure 24. Load-displacement behaviour of the wingbox assembly predicted by FE analysis of the full model.
4.0 TEST PROCEDURE AND EXPERIMENTAL RESULTS
Interrogation of the wingbox during the test was performed via two methods simultaneously: (1) strain gauging and (2) digital image correlation (DIC) system. Figure 25 schematically shows the location of the strain gauges installed on the wingbox to measure the strains in the regions of interest. For those areas prone to buckling the strain gauges were installed back-to-back, i.e. at the two sides of the skin, to capture the onset of the formation of localised bending due to buckling. Two displacement measuring sensors were also installed at the bottom of the dummy wingbox at the load introduction side (Fig. 26 to record the end displacement of the wingbox assembly). In this way, it was also able to record the twist/rotation of the wingbox assembly due to SBT loading. The load is applied by a vertical displacement introduced by a constant speed (2mm/min) jack-screw unit at the end point of the wingbox assembly. A load cell was placed between the jack-screw and a bar connected to the end of the wingbox assembly to record the load value during the test. Figure 27 shows the whole assembly with the DIC cameras installed above the test rig to capture the deformation of the wingbox in the skin area. It is worth noting that, as only two DIC cameras were available, the test was repeated with the cameras installed at the side to record the side wall deformation during loading/unloading.

Figure 25. Location of the strain gauges installed on the wingbox. (a) Strain gauges outside the wingbox. (b) Strain gauges inside the wingbox.

Figure 26. Location of the displacement gauges installed at the bottom end of the wingbox assembly.

Figure 27. Wingbox assembly and speckled areas for DIC system measurements. (a) Wingbox assembly ready to test. (b) Speckled areas on the top skin and side wall.
The numerical simulations guided the selection of load capacity and displacement range for the load introduction unit (jack-screw and load cell). It also guided appropriate placement of the strain gauges at the most sensitive locations (buckling-induced local bumps) to experimentally measure the buckling load as accurately as possible.
Figure 28 shows the end displacements of the wingbox assembly measured by the displacement gauges during loading and unloading. As expected, the end displacement at the load offset side is approximately 5mm more than the other side because of twisting. A small clearance between the wingbox assembly and middle support resulted in about 1mm end displacements before picking up the load. There was also a small horizontal misalignment that caused a slight twist in the opposite direction of the applied torsion at the beginning of loading, as shown in Fig. 28. It caused the offset-side edge (right hand side in Fig. 26) of the wingbox assembly to reach the middle support first, the load then started to increase until the other edge reaches the middle support at the other side. At this point ( $F = 4$
kN) the wingbox assembly is fully parallel to the middle support and a full contact between them is formed, beyond which the twist due to the torsional load exceeds the opposite initial twist due to misalignment. The effect of friction between the joints in the wingbox assembly is also worth noting from Fig. 28 when the loading path is compared with unloading.
$F = 4$
kN) the wingbox assembly is fully parallel to the middle support and a full contact between them is formed, beyond which the twist due to the torsional load exceeds the opposite initial twist due to misalignment. The effect of friction between the joints in the wingbox assembly is also worth noting from Fig. 28 when the loading path is compared with unloading.

Figure 28. Load vs end displacements of the wingbox assembly.
The axial strain variation during loading/unloading at the top skin at the loading side, resulting from both experimental test and nonlinear FE analysis, is shown in Fig. 29. The test results show that the maximum strain occurs at the load offset side and is slightly more than  $800\mu\varepsilon$
at the maximum applied load (31kN). The deviations of the strain values measured from back-to-back gauges, as well as discrepancies between the test and nonlinear FE analysis, are believed to be related to initial imperfection of the top skin, not due to buckling in this region, as later it is shown that buckling occurred earlier at the support side.
$800\mu\varepsilon$
at the maximum applied load (31kN). The deviations of the strain values measured from back-to-back gauges, as well as discrepancies between the test and nonlinear FE analysis, are believed to be related to initial imperfection of the top skin, not due to buckling in this region, as later it is shown that buckling occurred earlier at the support side.

Figure 29. Load vs strains at the top skin in load side of the wingbox (dashed lines indicate inside) resulting from (a) experiment and (b) nonlinear finite element analysis.
The predicted region for buckling was at the support side as shown in Fig. 9. Therefore, the back-to-back strain gauges at the two skin bays in this area were installed to interrogate these areas, as shown in Fig. 30(a). As observed in both regions a deviation was observed at a load of approximately  $F = 26$
kN. The different slopes of the load-strain behaviour of back-to-back gauges are again related to the initial imperfection of the skin. However, the large change of the slopes (deviation) clearly shows the local bumps due to buckling in these regions. Comparing the two gradients for strain gauges No 4 and 29 shows that it is an outward bump, whereas it was expected to be inward (see Fig. 9). The reason is that the biggest inward half wave occurs at a location a little closer to the support side, where strain gauge No 34 is installed. This strain gauge was not initially installed before the assembly (there was no access to the inside of the wingbox to install another strain gauge inside the skin at this location). However, it shows the inward bump to have a significantly larger strain compared to strain gauges No 4 and No 29. In other words, the main (longest) half wave of the buckled wave is inward and at this location as predicted from the nonlinear finite element analysis (Fig. 9). The nonlinear FE analysis results shown in Fig. 30(b) are also in good agreement with the test regardless of the discrepancies resulting from the initial imperfections of the wingbox and manufacturing-induced residual strains.
$F = 26$
kN. The different slopes of the load-strain behaviour of back-to-back gauges are again related to the initial imperfection of the skin. However, the large change of the slopes (deviation) clearly shows the local bumps due to buckling in these regions. Comparing the two gradients for strain gauges No 4 and 29 shows that it is an outward bump, whereas it was expected to be inward (see Fig. 9). The reason is that the biggest inward half wave occurs at a location a little closer to the support side, where strain gauge No 34 is installed. This strain gauge was not initially installed before the assembly (there was no access to the inside of the wingbox to install another strain gauge inside the skin at this location). However, it shows the inward bump to have a significantly larger strain compared to strain gauges No 4 and No 29. In other words, the main (longest) half wave of the buckled wave is inward and at this location as predicted from the nonlinear finite element analysis (Fig. 9). The nonlinear FE analysis results shown in Fig. 30(b) are also in good agreement with the test regardless of the discrepancies resulting from the initial imperfections of the wingbox and manufacturing-induced residual strains.

Figure 30. Load vs strains at the top skin in support side of the wingbox (dashed lines indicate inside) resulting from (a) experiment and (b) nonlinear finite element analysis.
The other region that was prone to buckling based on the nonlinear FE analysis was the load offset side wall of the wingbox. Figure 31 shows the strain variations at this location. As observed from both test and nonlinear FE analysis, there is no sign of a significant slope change in the strains measured from the back-to-back gauges. The DIC images do show more in this case and are discussed later in this section.

Figure 31. Load vs strains at the side wall in support side of the wingbox (dashed lines indicate inside) resulting from (a) experiment and (b) nonlinear finite element analysis.
As shown in the FE analysis of the mixed model (Fig. 14) the most critical part that experiences severe stresses and strains is the top corner of the wingbox at the load offset side (Figs. 16-21). Figure 32 shows the strains measured at the top surface of this corner during loading/unloading. The maximum strain values are not considerable (below 1,200 $\mu\varepsilon$
), however, a tensile strain in the chord-wise direction (strain gauge 22) shows the considerable expansion of the top skin in that direction due to the Poisson’s ratio effect.
$\mu\varepsilon$
), however, a tensile strain in the chord-wise direction (strain gauge 22) shows the considerable expansion of the top skin in that direction due to the Poisson’s ratio effect.

Figure 32. Load vs strains at the corner of the wingbox resulting from (a) experiment and (b) nonlinear finite element analysis.
Figures 33 and 34 show the out-of-plane displacement contour maps of the top skin and side wall at maximum load (31kN) measured by DIC cameras. The buckling mode shape, as well as the inward bump measured in the skin bay due to buckling, is in good agreement with the predictions made by the nonlinear Riks analysis performed by FE analysis (Fig. 9). It is worth noting that the out-of-plane displacements at the localised buckled area at the side wall, as predicted, are considerably smaller than those of the top skin.

Figure 33. DIC image of top skin showing the out-of-plane displacements at maximum load.

Figure 34. DIC image of side wall showing the out-of-plane displacements at maximum load.
5.0 CONCLUDING REMARKS
A variable-stiffness unitised integrated-stiffener out-of-autoclave thermoplastic composite wingbox demonstrator was designed and manufactured in-house. A bespoke test rig was also designed and manufactured in-house for testing of the wingbox demonstrator under a combined shear-bend-torsion (SBT) load. The SBT load was applied to the composite wingbox and the experimental results were compared to predictions from nonlinear FE analysis. The displacements and strains of the wingbox were measured by several strain gauges in the area of interest and a DIC system. The FE analysis results agreed well with the experimental results, both showing the occurrence of buckling to be in the top skin bays which are under compression. They also predicted a slight localised bending due to torsional load in one of the side walls, which occurs after the top skin buckles. Moreover, the most critical areas for material failure were identified from three dimensional FE analysis and test, with both identifying the top corner at the load offset side to be the critical location. A through-thickness strain analysis was also performed to thoroughly investigate the strain profile in different plies in this region. Up to the point of buckling FE analysis shows that the maximum strain of (2,500 $\mu\varepsilon$
) is not exceeded. However, the test results at approximately 10% above the buckling load (31kN in this study) show failure did not occur at any location suggesting two important points: (1) the composite wingbox originally designed for SB loading has shown itself to be a viable concept for a specific combined SBT load, and (2) buckling occurs before material failure as would be anticipated for a buckling-driven design.
$\mu\varepsilon$
) is not exceeded. However, the test results at approximately 10% above the buckling load (31kN in this study) show failure did not occur at any location suggesting two important points: (1) the composite wingbox originally designed for SB loading has shown itself to be a viable concept for a specific combined SBT load, and (2) buckling occurs before material failure as would be anticipated for a buckling-driven design.
ACKNOWLEDGEMENTS
The authors would like to thank Science Foundation Ireland (SFI) for funding Spatially and Temporally VARIable COMPosite Structures (VARICOMP) Grant No 15/RP/2773 under its Research Professor programme. The authors would also like to thank ICOMP for its help with the LATP.


