INTRODUCTION
The economics profession has by now produced a large number of growth models to better understand the complex process of economic development. This set of models can be divided into two mutually exclusive classes: The first class comprises models of “ergodic economies.” The underlying dynamic system exhibits an unique stable equilibrium. In this case, history does not matter for the long-run evolution of the economy. This class of models is compatible with either absolute or conditional convergence (Galor, 1996). The second class comprises models of “nonergodic economies.” These models feature two or more stable equilibria. In this case, history matters for long-run economic development.1
In an important contribution, Krugman (1991) has clarified that in dynamic general equilibrium models with multiple equilibria both history (initial conditions) as well as expectations may determine the long-run outcome.
The basic features which give rise to multiple equilibria comprise income heterogeneity, human capital, endogenous fertility decisions, along with capital market imperfections, externalities, non-convexities, and imperfectly competitive markets (Galor, 1996).
An important implication of the second class of models is hysteresis in the sense that temporary events may have permanent consequences. There are two basic concepts of hysteresis in the economics literature. The first is based on (a finite number of) multiple equilibria as a result of nonlinearities in the underlying dynamic system. The second relies on a continuum of equilibria, which results from at least one zero eigenvalue of the underlying dynamic system.
The paper at hand shows that hysteresis in the sense of a continuum of equilibria arises naturally from a generic growth model once we depart from the usual one-sectoral formulation and take intersectoral factor reallocation costs (FRC) into account. The economy becomes nonergodic in the sense that initial conditions matter for the long-run evolution and hysteresis occurs implying that even temporary (technology or policy) shocks may permanently affect the intersectoral allocation of resources and, hence, (long-run) growth.
The term FRC is meant to describe the costs associated with the reallocation of input factors. To illustrate, we consider three real-world examples: (i) if labor productivity increases with cumulative output (because of learning by doing), then a sudden drop in productivity occurs in response to factor reallocation (FR); (ii) the requirement of sector-specific human capital implies that workers who want to cross sectoral borders must first invest in sector-specific human capital; (iii) costs associated with the reinstallation of capital goods represent FRC related to physical capital.3
Strongly related and also highly relevant for the analysis of economic dynamics is the concept of capital adjustment costs, that is, costs associated with the installation of new capital goods (e.g., Hayashi, 1982; Abel and Blanchard, 1983).
This paper contributes also to the discussion on flexibility and economic growth. This topic has its roots in the work of Nelson and Phelps (1966). They argue that general human capital generates a comparative advantage in coping with technological change. Modern growth theory adopted this approach and argued that ability and general human capital is critical for the periods of sectoral changes as a result of technological change (e.g., Galor and Tsiddon, 1997; Galor and Moav, 2000; Rubinstein and Tsiddon, 2004).
There is empirical support for the conjecture that flexibility is favorable for economic growth. In this context, “flexibility” describes the ability of an economy to accomplish a reallocation of input factors at comparably low costs. In an empirical study, Burgess and Mawson (2003) find that flexibility is indeed good for growth. The authors first estimate an indicator of labor market flexibility capturing the ability of an economy to reallocate labor. This indicator is then plugged into a standard growth regression (controlling for standard growth correlates), which is estimated using a panel data framework. The main result is that flexibility has a positive impact on growth, which is statistically and economically significant.
Although a positive relationship between flexibility and growth is quite intuitive, it is important to understand the precise mechanisms through which flexibility affects economic growth and to understand the implications of such a model. Employing a stochastic endogenous growth model with heterogeneous firms, Bertola (1994) investigates the consequences of costly labor mobility (using an input-based formulation of reallocation costs) between firms within the manufacturing sector. It turns out that inflexibility (i.e., comparably high labor reallocation costs) depresses long-run growth through a negative impact on the private return on investment. The paper at hand departs from Bertola's analysis by focusing on intersectoral FRC. It will turn out that this aspect leads to additional and important insights into the nexus between flexibility and economic growth.
It is well known that economic development is associated with recurring downturns, that is, periods of negative growth. Standard macroeconomic models have some difficulties in explaining these downturns (Francois and Lloyd-Ellis, 2003). The model presented later is able to shed some light on this issue as well. It is shown that periods of negative growth can result when economies reshuffle their resources in response to (favorable) technology shocks to take full advantage of the technological improvements. This might be especially important in the context of the introduction of new general purpose technologies (GPT). In fact, there are several examples in the growth literature in which an acceleration in the rate of technological progress results in a productivity slowdown. The argument, although different, has a similar flavor to that developed in this paper. As established by Galor and Tsiddon (1997, Remarks 6) and Galor and Moav (2000, pp. 485–486), a sufficiently large increase in the rate of technological progress generates a productivity slowdown in the short run. In the long run, however, the growth rate of productivity is higher than existed initially. Because of the “erosion effect” in technology-specific human capital, a sufficiently large increase in the rate of technological progress reduces the growth rate in total factor productivity (TFP), as measured by the Solow residual. However, once the rate of technological progress reaches a steady state, the “erosion effect” is constant, whereas the “productivity effect” grows at a constant rate. TFP therefore grows in the long run at a higher constant rate.
Turning to FRC, the focus here is on the costs associated with FR across sectoral borders, that is, on intersectoral FRC. This perspective can be justified on two grounds: (i) intersectoral FRC are probably higher than intrasectoral FRC and, hence, are economically more significant; (ii) intersectoral FRC are more important from the perspective of growth theory. The reason lies in the fact that the sectoral structure (more specifically, the amount of resources allocated to the engine-of-growth sector) might be crucial for the long-run growth rate.
There are a number of empirical studies showing that FRC can be substantial. For instance, Gramm (2002) finds that FR is associated with a (one-time) drop in productivity of 15% for manufacturing labor and 40% for physical capital. Davidson and Matusz (2001) investigate labor reallocation costs in the context of trade reforms and find that these costs amount to 35% to 90% of the long-run gains from trade liberalization.
It is important to note that there are two basic possibilities to accomplish sectoral change. According to the first and most obvious possibility, input factors must explicitly be reallocated from one sector to another. In addition, sectoral change can be managed by the accumulation (or decumulation) of sector-specific inputs. One could argue that this second possibility does not require a reallocation of input factors. This kind of reasoning, however, ignores the fact that the reinforced production of sector-specific inputs unambiguously requires a reallocation of input factors to the sector producing those sector-specific inputs. Hence, sectoral change is inevitably associated with intersectoral FR.
In addition to the papers mentioned earlier, the related literature comprises the following contributions: Kemp and Wan (1974) study a dynamic two-sector model of international trade with labor as the single input. As there is no input factor that can be accumulated, there is no growth in this model. The FRC are formulated as forgone output because of FR (output-based formulation of FRC). Mussa (1978) investigates the process of adjustment in a dynamic version of the Heckscher-Ohlin-Samuelson model. Capital is considered a quasi-fixed factor in the sense that the intersectoral reallocation entails costs, which result in labor not being available for productive uses elsewhere (input-based formulation of FRC). Once more, this paper does not investigate the role of FRC for economic growth. Finally, Huffman and Wynne (1999) set up a two-sector real-business-cycle model with sector-specific capital and intratemporal adjustment costs for new capital goods to replicate empirical cross-sectoral correlations. Because long-run growth is exogenous, this paper is also silent on the question of whether FRC are important for economic growth.
In Section 2, a stylized two-sector growth model with explicit FRC is set up. The implications of this general model are developed in Section 3. An almost linear model is employed in Section 4 to explicitly investigate a number of important implications. At first, the hysteresis range is determined analytically, then the relationship between flexibility and economic growth is discussed and, finally, a growth rate decomposition is employed to demonstrate the implications of FRC for downturns. Section 6 summarizes and provides additional conclusions.
A STYLIZED ECONOMY WITH FACTOR REALLOCATION COSTS
The model of a stylized two-sector growth economy with explicit FRC is set up. On the one hand, the aim is to formulate a model that is general enough to serve as a framework for the analysis of specific growth models. In this sense, the model can be considered as a generic growth model with explicit FRC.4
Implicit FRC arise in two-sector models if the production possibility frontier is strictly concave.
The Model
There is a consumption goods sector (c-sector), an investment goods sector (i-sector) and a reallocation sector (r-sector). The presence of an explicit reallocation sector should not be interpreted literally. It is considered more as a modeling device that is used as an analytically convenient shortcut to investigate the economic consequences of FRC, which can, as described earlier, take very diverse forms. The technology for the consumption and the investment goods sector is f(.) with f′(.) > 0, f″(.) ≤ 0 and f(0)=0.5
The fact that both goods are produced with the same technology is not critical for the derived results. This (simplifying) assumption allows a direct comparison of the model under study to the usual one-sector model implying zero FRC.
A natural way to capture the basic idea of costly FR is to introduce a factor reallocation technology (FRT). Let us assume that FR necessitates the services from other parts of the capital stock. More specifically, the transfer of the amount
during the (short) period dt from the c-sector to the i-sector (or vice versa) can be accomplished according to the FRT g(ϕk) provided that the amount ϕk is used for FR, where
. Hence, the FRT may be expressed as
or
. The function g(.) is assumed to satisfy g′(ϕk)>0, g″(ϕk)≤0 and g(0)=0. Note that the previous formulation captures two different aspects: First, the direction of FR is given by ν∈{−1, +1} and, second, the speed of adjustment, which is determined by ϕk.
The costs of FR show up in the technology of the i-sector given by i=f[(1−θ−ϕ)k]. This formulation implies that the costs of devoting ϕk to FR in terms of inputs withdrawn from the i-sector amount to ϕk. FRC are accordingly modeled as explicit and input-based with the property that marginal FRC do not vanish at the origin.6
Kemp and Wan (1974) and Bertola (1994) also employ cost functions with nonvanishing marginal FRC at the origin. Moreover, Kemp and Wan (1974, p. 223) argue that this functional form is empirically most plausible.
In a more general framework, one could allow for the possibility that resources devoted to FR might be withdrawn from the i-sector as well as from the c-sector. The consequences for growth and convergence are probably different from the specification chosen here. This task is left for future research.
As usual, the objective is to maximize the present value of an infinite utility stream. Instantaneous utility u(c) with u′(c)>0 and u″(c)<0 is of the constant-intertemporal-elasticity-of-substitution type. The dynamic problem of the social planner reads as follows (Table 1 summarizes the notation):
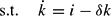


This problem has two control variables, ϕ and ν. The restriction ϕ≤1−θ ensures that the share of k devoted to the i-sector, 1−θ−ϕ, cannot turn negative. There are two state variables, namely the stock of the input factor k and the intersectoral allocation variable θ. It should be observed that θ is the control variable within the underlying model when FR is free of charge.
Equation (5) shows the FRT. As an illustration, let us consider a specific example: Assume that the reallocation of the amount
can be accomplished according to B(ϕk)α with 0 < α ≤ 1 and B > 0 by using the services of ϕk for FR. In this case, the FRT can be stated as
. For the linear case (α=1), the FRT is simply given by
.
Discussion of Critical Assumption
The modeling of FRC is crucial for many of the results derived in this paper. Therefore, a concise discussion of the critical assumption is at order. Equation (4) shows that FRC are modeled as explicit and input-based. Specifically, consider the following parameterization of (4) and (5): i=A(1−θ−ϕ)k and
with A > 0 and B > 0 representing constant technology parameters. In this case, marginal FRC do not vanish at the origin, that is, at ϕ=0. This property of nonvanishing marginal FRC will turn out to be critical for the occurrence of hysteresis.
How plausible is this property in economic terms? To clarify this aspect, consider an alternative model formulation with convex FRC. Instead of equation (4) with i=A(1−θ−ϕ)k one could assume that
(e.g., Krugman, 1991); in this case, equation (5) would become obsolete. With such a convex adjustment cost technology marginal FRC do vanish at the origin. The preceding formulation of FRC has a very different economic interpretation compared to the formulation of FRC employed in this paper. The quadratic formulation captures congestion effects in FR, as stressed by Fukao and Benabou (1993). Reallocation of the first small amount of the input factor is free of charge, that is, the marginal FRC are zero at the origin. The reallocation of a higher amount can then be accomplished only at positive costs; marginal FRC are increasing. Although this intratemporal congestion cost formulation has some appeal, it captures a completely different aspect. The basic point considered in this paper results from the fact that intersectoral FR per se incurs costs. Put differently, the formulation with nonvanishing marginal FRC at the origin implies that even the first unit of the input factor can be reallocated only if costs are incurred. This is clearly appropriate in this context as the focus here is on the fact that the transfer of input factors across sectoral borders is intrinsically costly.
BASIC IMPLICATIONS
The implications of economic growth under FRC are derived. Section 3.1 gives the first-order conditions, Section 3.2 states the basic implications, and Section 3.3 provides the economic interpretations.
First-Order Conditions
The (current-value) Hamiltonian for the problem under study is given by:

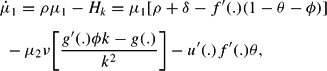
where μ1 and μ2 are the shadow prices of k and θ, respectively. Let ϕ* denote the optimal choice of the control variable and Hx the partial derivative of the Hamiltonian with respect to x. The necessary first-order conditions may then be expressed as follows:


Moreover, the equations of motion for k and θ [equation (2) and (5)] must hold.8
In addition, the transversality conditions for k and θ must be satisfied, that is,
and
. We further assume that the necessary conditions also are sufficient.
Implications
To determine the nature of the solution, corner (i.e., ϕ=1−θ) versus interior (i.e., ϕ<1−θ) and ϕ=0 versus ϕ≠0, we form the derivative of the Hamiltonian with respect to ϕ:

There are three types of interior solutions: (i) ϕ*<0, (ii) ϕ*>0, and (iii) ϕ*=0. It can be readily shown that an interior solution with ϕ*≠0 results provided that the following condition holds (cf. Appendix A.1):

More important, however, there is a continuum of stationary equilibria with ϕ*=0 whenever the conditions resulting from (i) Hϕ=0, equation (12), ν=−1 and ϕ=0 and (ii) Hϕ=0, equation (12), ν=1, and ϕ=0 border a nonempty set in (k, θ)-space.9
Condition (i) with ϕ>0 instead of ϕ=0 would give the necessary condition for interior solutions for adjustment from above (in θ-direction), whereas condition (ii) with ϕ>0 instead of ϕ=0 would give the necessary condition for interior solutions for adjustment from below. By imposing ϕ=0 we determine the borders of the set with ϕ≠0. These borders shape a set in (k, θ)-space within which ϕ*=0 must hold.

Condition (14) is necessary and sufficient for the occurrence of hysteresis. It does not, however, prove that the hysteresis set is actually nonempty. A rigorous existence proof of hysteresis must show that, for some initial values k(0) and θ(0), the initial shadow prices μ1(0) and μ2(0), being endogenous jump variables, which depend on k(0) and θ(0), are such that condition (14) actually holds. Nonetheless, using a specific model it is shown in Section 4 that the hysteresis set is indeed nonempty, that is, there is a combination of k(0) and θ(0) such that hysteresis actually occurs.
We finally turn to the condition for corner solutions. A solution with ϕ*=1−θ is realized provided that the following condition holds (cf. Appendix A.3):

Whether the social planner sets ν=1 or ν=−1 depends on whether θ(0)>θ* or θ(0)<θ*, where θ* denotes the unique optimal value of θ implied by the model under study with zero FRC. It should be noted that the shadow price of the allocation variable μ2 is positive for θ(0)<θ* and negative for θ(0)>θ*.
Table 2 summarizes the optimal solutions together with the necessary and sufficient conditions and indicates the respective dynamic system.

Economic Interpretation
Let us start with interior solutions focusing on the case ϕ=0. Considering condition (14) reveals that the LHS gives the increase in overall welfare provided that a small amount of the input factor is devoted to FR. This is given by the (absolute value of the) shadow price of the allocation variable |μ2| (μ2 might be negative for θ>θ*) times the marginal physical product of capital in FR g′(ϕk), evaluated at ϕ=0. The RHS shows the increase in overall welfare if the same amount of the input factor is devoted to the i-sector. This is given by the shadow price of capital μ1 (multiplied by k) times the marginal product of capital in the i-sector f′[(1−θ)k], assuming that ϕ=0 and, hence, (1−θ−ϕ)k=(1−θ)k.10
The RHS of (15) is multiplied by k since μ1 is the shadow price of a state variable measured in absolute units (i.e. k), whereas μ2 is the shadow price of a state variable measured in proportional units (i.e., θ).
Provided that condition (14) holds, ϕ*=0 and, by equation (5),
as well. The intersectoral allocation pattern accordingly remains constant. The coefficient matrix of the relevant dynamic system [(2), (5), (10) and (11) together with ϕ=0] has one row equal to zero and, therefore, this dynamic system possesses at least one zero eigenvalue. As a result, there is a continuum of stationary equilibria, which constitute the range of hysteresis. Because the hysteresis range implies ϕ*=0, the term “range of inaction” also may be appropriate. Within this range, the adjustment dynamics is degenerate along the θ-dimension. Put differently, the stationary equilibria within the hysteresis range are characterized by indifferent stability properties (as opposed to stability vs. instability) along the θ-dimension.
We now turn to corner solutions. Once more, the economic intuition behind condition (15) is straightforward. The LHS shows the increase in overall welfare provided that a small amount of the input factor is devoted to FR. This is given by the (absolute value of the) shadow price of the intersectoral allocation variable |μ2| times the marginal product of capital in FR g′(ϕk); note that g′(ϕk) is evaluated at ϕk=(1−θ)k. The RHS shows the increase in overall welfare provided that the same small amount of the input factor is devoted to the i-sector. This is given by the shadow price of capital μ1 (multiplied by k) times the marginal product of capital in the i-sector f′[(1−θ−ϕ)k], evaluated at (1−θ−ϕ)k=0. Considering (15) it becomes evident that it is rational to devote the maximum feasible share of the input factor to FR and set, say, ν=1 provided that (i) θ(0)<θ* and (ii) the LHS exceeds the RHS, assuming that ϕ=1−θ, and, hence, (1−θ−ϕ)k=0.
An almost linear economy
It would be highly desirable at this stage to determine the hysteresis range analytically. This would allow an explicit investigation of the specific mechanisms through which FRC affect economic growth. Fortunately, this task can be accomplished by focusing on an almost linear economy, which results from (1) to (7) with
, c=f(θk)=Aθk, i=f[(1−θ−ϕ)k=A(1−θ−ϕ)k], and
with A>0 and B>0 representing constant technology parameters.
Sectoral Hysteresis
For the specific model under study, the hysteresis set can be expressed as a hysteresis range in terms of θ only. Moreover, employing the parameterization given earlier, one can readily derive the borders of the hysteresis range analytically (cf. Appendix A.4). The lower border is denoted as
, whereas the upper border is labeled
.11
is the stationary solution for θ resulting from the dynamic system that governs the evolution of interior solutions for adjustments from below (in θ-direction), whereas
is the stationary solution for θ resulting from the dynamic system that governs the evolution of interior solutions for adjustments from above.
and
, the steady state value of the shadow price of θ at
. Of course, as θ is restricted by (6), we get
for Bρ≥A(B+ρ) and
provided that Bρ<A(B+ρ).12
To keep things simple, we exclude the unlikely case
, that is, we assume that Bρ<A(B+ρ) holds.
. Since
approaches infinity as B−ρ converges to zero,
hits the upper border of the set [0, 1] when B becomes sufficiently small. As θ is restricted by (6),
for Bρ≥A(B−ρ) and
for Bρ<A(B−ρ). The steady state value of the shadow price of θ at
is given by
.
The hysteresis range, defined by the set [
], bears the following implication: Provided that the initial intersectoral allocation θ(0) lies inside this range, it remains unchanged. If the economy starts outside this range, it converges along the θ-dimension (either from below or from above) to the border of this range.
The economic interpretation of the hysteresis range is straightforward: At first, it should be noted that the model with zero explicit FRC implies a unique optimal long-run value for the allocation variable θ. This optimal value is determined such that the marginal present value (PV) of benefits equals the marginal PV of (implicit) FRC because of FR. The model with FRC adds an explicit cost component associated with FR. In this case, it might be optimal not to close the whole gap between the initial value of θ and θ*. Put differently, if the economy would move into the hysteresis range, overall welfare decreases because the marginal PV of costs exceeds the marginal PV of benefits.
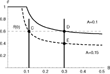
It is especially instructive to consider how the hysteresis range varies with the importance of the FRC, as expressed by B (the productivity of the FRT). Figure 1 illustrates the upper and lower border of the hysteresis range in terms of θ in response to changes in B; based on A=0.1 and ρ=0.05. Moreover, the unique optimal value of θ for the case of zero FRC θ* is represented by the horizontal dashed line. The figure shows that the hysteresis range is smaller, the larger is B and vanishes as B approaches infinity. More specifically, the upper and the lower bound of the hysteresis range both converge to the unique optimal value of θ resulting when FRC is free of charge (i.e., for
). This is readily recognized analytically by applying the rule of L'Hôpital to
and
, which yields
. The economic reason for this observation lies in the fact that the FRC converge to zero as B approaches infinity. This indicates that the underlying growth model with zero FRC (a standard AK-type growth model) represents one limiting case of the model with FRC. The second limiting case (B=0) corresponds to the AK growth model with exogenous investment share (saving rate). In this case, the hysteresis range is maximal, as can be seen by inspecting Figure 1. Any (exogenous) change in θ is permanent. The model under study can hence be viewed as a fairly general framework, which encompasses a number of standard approaches as special cases.

Hysteresis range in terms of θ in response to B.
Consequences for Long-Run Growth
It is well known that, within the endogenous growth framework, differences in the investment rate translate into long-run growth rate differentials. For the linear growth model under study, the long-run growth rate may simply be expressed as
, where a “hat” above a variable denotes its growth rate and
the long-run consumption share.
In order to assess the extent of heterogeneity in long-run growth rates because of diverging initial conditions under FRC, we consider the maximum growth rate differential. Assume that two economies share the same preferences and technologies but differ with respect to initial conditions. The maximum growth rate differential is then given by
. This differential in long-run growth rates would fully apply provided that
and
[or
and
]. If the preceding condition fails, a growth rate differential between zero and
should be observed.
What is the sensible interpretation of this result with respect to economic development? Typically, low-income countries allocate a lower share of resources to the i-sector. For instance, this follows unambiguously when subsistence consumption is taken into account (e.g., Steger, 2000). In the course of economic development, a reallocation of input factors from the c-sector to the i-sector then takes place. The model under study implies that economies with a more efficient FRT increase their investment rate further, that is, a larger part of the gap between θ(0) and θ* is closed, and, hence, do grow faster in the long run.
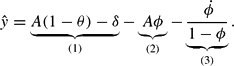
For a first assessment of the quantitative importance of FRC for long-run growth, we assume that the economy exhibits an initial consumption share of
, that is, the stationary equilibrium is at the upper border of the hystersis range with a corresponding growth rate of
. The elasticity of this growth rate with respect to B reads as follows:
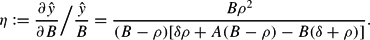
Using a plausible set of parameters, one can readily determine the quantitative importance of FRC, as summarized by Table 3.

This concise sensitivity analysis shows that the effect of FRC on the long-run growth rate, as measured by η, is all but negligible. The values range form η=0.17 to η=1.67, indicating that the impact of FRC on long-run growth is substantial.
Considering historical growth experiences shows that the transition from stagnation to growth was accompanied by a shift from an agricultural to an industrial economy (e.g., Galor, 2005). In recent years, the growth literature was concerned with the forces that triggered or prevented this transition. This discussion shows that sectoral hystersis as a result of intersectoral FRC can prevent a process of sectoral change that otherwise would have taken place. Taking (exogenous) FRC into account can help to explain international diversity in the sectoral structure and, hence, economic development. Moreover, by assuming that FRC are endogenously determined by the level of human capital (general skills) reinforces the importance of human capital accumulation for an economic take-off.
Flexibility and Economic Growth
We are now in the position to investigate the consequences of flexibility for economic growth. An economy is said to be (comparably) flexible, if it can accomplish FR at lower costs than a second economy, which is labeled (comparably) inflexible. In terms of the linear model under study, the economy with a higher productivity in FR (i.e., a higher B) is flexible, whereas the second is inflexible.
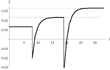
To investigate the consequences of different degrees of flexibility on economic growth let us consider Figure 2, which depicts the upper border of the hysteresis range as a function of B. It is assumed that the initial productivity of capital in both the c-sector and the i-sector is A=0.1. The corresponding upper border of the hysteresis range is represented by the solid curve. Moreover, both economies are supposed to start with θ(0)=0.6. Nonetheless, the two economies differ in terms of flexibility. The inflexible economy is characterized by B ≅ 0.11 (indicated by a vertical line) and accordingly is positioned at point C. The flexible economy has B=0.3 (indicated by a vertical line) and is located at point D. Both economies grow initially along their balanced growth path with the same growth rate. It should be noted that the example is constructed such that the inflexible economy is located within the hysteresis range (point C), whereas the flexible economy is located at the border of the hysteresis range (point D).

Flexibility and economic growth.
We now assume that there is a substantial and permanent increase in A by, say, 50%; this can be interpreted as resulting from the introduction of a new general purpose technology. As a consequence, the hysteresis range shifts downward (remember that θ*=ρ/A). The new upper border of the hysteresis range is represented by the dashed curve, valid for A=0.15.
Although the two economies differ in terms of flexibility, there is no observable difference between the two economies initially. This changes in response to the technology shock. After the shock the inflexible economy is located at the border of the hysteresis range. This implies that its economic structure (measured by θ) remains constant. In contrast, the flexible economy was initially located at the border of the hysteresis range and is now located outside the hysteresis range. This implies that the flexible economy converges from point D to E (the new long-run value of θ). Accordingly, the flexible economy adjusts its intersectoral structure to take full advantage of the favorable technology shock.
It is important to note that both economies increase their long-run growth rate in response to the favorable technology shock. This is immediately recognized by remembering that the long-run growth rate is
. However, the difference lies in the fact that the inflexible economy does not adjust its intersectoral structure, that is, θ remains constant. By contrast, the flexible economy does adjust its intersectoral structure. It can take full advantage of the favorable technology shock by reallocating resources to the engine-of-growth sector, which is the i-sector in the model under study.
In order to illustrate, let us consider a real-world example: The flexible economy may be labeled the USA, whereas the inflexible economy may be labeled Continental Europe. The sudden increase in the technology parameter can be interpreted as the introduction of the new information and communication technologies during the 1980s. The model under study then implies that both the USA and Continental Europe can raise their growth rates. However, the USA experience a higher growth rate because it adjusts its economic structure stronger by reallocating more resources to the engine-of-growth sector.
It is instructive to illustrate how flexibility should be interpreted with respect to the real world. Although there are a bunch of possible interpretations, I believe that flexibility primarily results from a well-educated workforce as well as from a favorable institutional and regulatory framework. As regards education, new jobs often require new job-specific skills, which must be acquired either through formal or informal learning. This process is more efficient, the higher the level of (general) skills already is. Put differently, students at the university level primarily acquire meta-competences, which enable them to learn in a reasonable amount of time. Through this mechanism, a high level of education reduces FRC.13
This kind of reasoning is similar in spirit to Nelson and Phelps (1966) who argue that production management requires adaptation to technological change. This process is more efficient, the more educated managers are.
Downturns
The growth model with FRC has important implications for explaining downturns, that is, periods of negative growth. To explain the main mechanism, a straightforward decomposition of the instantaneous growth rate of output defined by y≡c + i is employed (cf. Appendix A.5):
The first term on the RHS is labeled conventional growth rate; this is the standard expression resulting from the linear growth model. Note, however, that this component may be affected by FRC as a result of hysteresis, as shown earlier. The second term shows the drag-of-resource effect. This component indicates that a share ϕ of the input factor is used for FR in response to shocks. Finally, the last term indicates that input factors gradually return from FR to the i-sector, which can be labeled reverse drag-of-resource effect. Note that both the second and the third term vanish in the long run.
By considering equation (17) it becomes obvious that the instantaneous growth rate can temporarily turn negative, even in response to a favorable technology shock, provided that the drag-of-resource effect (2nd term) is sufficiently strong; at the point in time when the shock occurs, the 3rd term is zero. This requires the share ϕ to become sufficiently large to offset the positive effect of A on
. The implication of potentially negative short run growth rates suggests that downturns can be interpreted as optimal responses of an economy to the introduction of new technologies. The model with FRC can, hence, shed light on the fact that economic development is associated with recurring downturns.
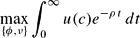
Figure 3 illustrates the time path of the growth rate of per capita output, based on a simple simulation exercise. It is assumed that the economy exhibits an initial consumption share of
, that is, the stationary equilibrium is at the upper border of the hystersis range, with a corresponding growth rate of
. We now consider the dynamic consequences of a sequence of unexpected TFP shocks in final output production, that is, A increases from an initial value of 0.09 to 0.1 and subsequently jumps from 0.1 to 0.11.14
The remaining parameters are: B=0.2, ρ=0.05, and δ=0.02.

Economic growth with downturns.
One could argue that this explanation to some extend implies that downturns result from mismeasurement of GDP since the reallocation of input factors should be considered to represent a service, which should be counted within GDP. This proposition depends largely on whether FRC are implicit or explicit. The case of workers acquiring sector-specific human capital to cross sectoral borders would be an example of explicit FRC, which should (according to usual conventions) be counted within GDP. By contrast, a sudden drop in labor productivity as a result of labor reallocation in a world with learning-by-doing effects is an example of implicit FRC, which are usually not counted within GDP.
The model presented here offers a fairly simple and intuitive explanation for recurring downturns. The explanation is similar in spirit to Francois and Lloyd-Ellis (2003). They employ a Schumpeterian endogenous growth model to show that recessions (downturns) are preceded by in-house R&D.15
Similarly, Hall (2000) argues that recessions should be interpreted as periods of reorganizations, which manifest as temporary unemployment. In addition, Wälde (2005) presents a growth model with endogenous cycles because of endogenous innovations, which give rise to periods of increased capital accumulation. His model is not, however, intended to explain downturns.
Finally, the model presented here implies that large TFP progresses, implying stronger subsequent increases in the growth rate, are more likely to lead to more severe downturns compared to small TFP increases. This implication is broadly consistent with recent empirical evidence on business cycle characteristics and growth. For instance, using a nonlinear VAR model, Altissimo and Violante (2001) find that recessions do entail a positive feedback effect on subsequent growth.
SUMMARY AND CONCLUSION
There is hardly an economist who would deny that, first, sectoral change may be important for economic growth and, second, that the intersectoral reallocation of input factors may incur substantial costs. This alone does not justify integration of FRC into optimal growth models since this makes the analysis more complicated. Provided, however, that we gain new insights into the nature and causes of economic growth, such an investigation appears clearly worthwhile. The set of major insights can be summarized as follows:
- Intersectoral FRC give rise to sectoral hysteresis. Hence, economic development turns out to be nonergodic. There is path-dependency implying that history (initial conditions) matters. Moreover, temporary (policy or technology) shocks may have permanent effects. The only crucial assumption necessary to derive these results is that the marginal FRC do not vanish at the origin, which is clearly appropriate if one is interested in the economic consequences of costly intersectoral factor reallocations.
- Bertola (1994) has shown that inflexibility, that is, comparably high FRC, is detrimental for growth because it depresses the rate of return. The growth model under study describes a new mechanism through which flexibility affects economic growth. Flexible economies can better take advantage of favorable technology shocks, and hence experience a stronger acceleration of output growth in response to such shocks. This is simply because flexible economies are less plagued by sectoral hysteresis.
- It has been demonstrated that downturns can be interpreted as optimal responses of an economy to the introduction of new technologies. This mechanism appears especially relevant in the case of substantial technological improvements. This finding is broadly consistent with recent empirical evidence on the relationship between fluctuations and economic growth. For instance, Altissimo and Violante (2001) find that recessions do indeed entail a positive feedback effect on growth.
There are a number of interesting questions for future research. For instance, the model under study implies that a society's welfare is positively related to flexibility, which becomes especially relevant in a dynamic context. It would, therefore, be interesting to investigate the degree to which welfare depends on economic flexibility. Then the costs of inflexibility and the potential welfare effect of public policy aiming at an enhancement of macroeconomic flexibility can be assessed.
APPENDIX
A.1.THE CONDITIONS FOR AN INTERIOR SOLUTION WITH ϕ*≠0 [CONDITION (13)]
Consider first the case of ν=−1 (adjustment from above in θ-direction). The condition, which must hold for 0<ϕ<1−θ to be optimal, results from Hϕ=0, equation (12) and ν=−1, which yields:

Because we started by assuming that θ>θ* (with θ* denoting the unique optimal value of θ resulting from zero FRC), μ2<0 and, hence, equation (A.1) may be expressed as:

Consider next the case of ν=1 (adjustment from below in θ-direction). The condition, which must hold for 0<ϕ<1−θ to be optimal, results from Hϕ=0, equation (12) and ν=1, which yields:

Because we started by assuming that θ<θ*, μ2>0 and hence equation (A.3) may be expressed as:

This is condition (13) in the main text, which determines the optimal value of ϕ, whereas ν=1 or ν=−1 is determined by θ(0) in relation to θ*.
A.2.THE CONDITION FOR AN INTERIOR SOLUTION WITH ϕ*=0 [CONDITION (14)]
This discussion implies that there is a continuum of stationary equilibria with ϕ*=0 whenever the conditions resulting from (i) Hϕ=0, ϕ=0, ν=−1 and (ii) Hϕ=0, ϕ=0, ν=1 border a nonempty subset in (k, θ)-space.
From Hϕ=0 together with equation (12), ϕ=0 and ν=−1 we get:

Note that μ2<0 because we are considering the case of θ>θ*. Hence, equation (A.5) can be expressed as:

Similarly, Hϕ=0, equation (12), ϕ=0 and ν=1 gives:

In this case, μ2>0, as we are considering the case of θ<θ*. Hence, we can conclude that ϕ*=0 (with either ν=1 or ν=−1) provided that the subsequent relation holds:

This is the hysteresis condition (14) in the main text.
A.3. THE CONDITION FOR CORNER SOLUTIONS [CONDITION (15)]
For Hϕ≤0 a corner solution with ϕ*=1−θ and ν=−1 is realized. The condition, which must hold for this corner solution to be optimal, results from Hϕ≤0, equation (12), ϕ*=1−θ and ν=−1, which yields:

Because ν=−1, θ>θ* implying that μ2<0 and, hence, the preceding condition may be expressed as

Moreover, substituting ϕ by 1−θ leads to:

Similarly, for Hϕ≥0 a corner solution with ϕ*=1−θ and ν=1 is realized. The condition, which must hold for this corner solution to be optimal, results from Hϕ≥0, equation (12), ϕ=1−θ and ν=1, which yields:

Because ν=1, θ<θ* implying that μ2>0 and, hence, the preceding condition may be expressed as:

Moreover, substituting ϕ by 1−θ leads to:

Hence, the preceding condition, which is identical to condition (A.11) shown earlier, represents a general condition for corner solutions. This is condition (15) in the main text.
A.4.THE HYSTERESIS RANGE IN TERMS OF θ FOR THE LINEAR ECONOMY
The linear growth model with FRC results from (1) to (7) with
, c=Aθk, i=A(1−θ−ϕ)k and
. Assuming further that the economy starts below its steady state in θ-direction (hence ν=1), the set of first-order conditions for interior solutions reads as follows:


Note that the second term on the RHS of (10) vanishes in the case of a linear FRT, i.e. g′(.)ϕk−g(.)=0.


This set of equations (together with appropriate endpoint conditions) determines the dynamics for interior solutions with ϕ>0. Moreover, this set of equations also determines a stationary solution for θ, which is the bordering value of θ for adjustments from below (in θ-direction); this solution is labeled
. Because the model is highly linear
can be determined analytically.
From (A.15), we have
, where a “hat” above a variable denotes its growth rate. Equation (A.16) together with the definition of a balanced growth path implies
and hence
. By noting
[from (A.15)] (A.17) can be expressed to read
. Moreover,
together with (A.16) and (A.18) yields
. Hence, we get
and
(the steady state value of the shadow price of θ at
). Of course, as θ is restricted by (7), we get
for Bρ≥A(B+ρ) and
provided that Bρ<A(B+ρ).17
To keep things simple, we exclude the unlikely case
, that is, we assume that Bρ<A(B+ρ) holds.
Provided that the economy starts with
(i.e., above the upper bordering value for θ), ν=−1. Consequently, (A.15) becomes −Bμ2=Akμ1. Carrying out the same steps as before finally yields
. Because
approaches infinity as B−ρ converges to zero,
hits the upper border of the set [0, 1] when B becomes sufficiently small. As θ is restricted by (7),
for Bρ≥A(B−ρ) and
for Bρ<A(B−ρ). The steady state value of the shadow price of θ at
is given by
.
A.5.DECOMPOSITION OF THE GROWTH RATE [EQUATION (17)]
Using c=Aθk and i=A(1−θ−ϕ)k final output defined by y≡c+i can be expressed as: y=A(1−ϕ)k. Differentiating the preceding equation w.r.t. time gives:
Taking the capital accumulation
into account yields:

Dividing both sides by y=A(1−ϕ)k leads to:
This is equation (17) in the main text.
For helpful comments and suggestions I would like to thank Hannes Egli, Josef Falkinger, Volker Grossmann, Chris Papageorgiou, Steve Turnovsky, Klaus Wälde, three anonymous referees, and, especially, Sjak Smulders. Moreover, I am grateful to seminar participants at the Universities of Munich, Washington (Seattle) and Zurich for helpful discussions.