


A long-standing topic of debate in political economy is how international regulatory agreements affect private companies. Classical views maintain that national interests prevent states from credibly committing to global cooperation. Yet, recent research has raised the possibility that international cooperation has real market repercussions. Accordingly, multilateral agreements have significant distributive consequences, provide crucial information on firms’ economic outlooks, and materially affect the financial performance of targeted firms.Footnote 1
This paper explores how interactions between domestic systems and international regulatory cooperation influence private profits in the area of climate policy. In climate politics research, the consensus is that, despite the costly actions domestic compliers face to mitigate their emissions, the effects of international climate agreements on private profits can vary significantly.Footnote 2 While cooperation may hurt the financial gains of some companies, it may generate positive returns for others. However, the open question is what determines these distributive material consequences of international climate policy. It is increasingly clear that some firms have more advantages than others in absorbing (or overcoming) the costs of climate regulation. But what are the conditions in which private companies—and especially polluting companies expected to lose from climate regulation—profit from global climate agreements?
In the attempt to answer this question, some studies point to the heterogeneity of firms with different market attributes. According to recent research, some companies profit from markets generated by international climate regulation because they are willing to invest in innovation, and therefore they align with global environmental policy frameworks.Footnote 3 Other works, however, indicate that investors reward firms that become entrepreneurial about climate change action as the international bodies in charge seem particularly weak.Footnote 4 Along these lines, I maintain that a most crucial condition is the pre-existing domestic policy context in which firms operate. National policy design is often an understated attribute of the private sector's reactions to international environmental cooperation.Footnote 5 Yet, in some cases, domestic policy may protect firms from international regulation, and this may consequently influence investors’ expectations about firms’ profits.
The premise of my argument is, thus, that the regulations implemented within the boundaries of a country (or a set of countries) can create advantages for the absorption—and, thus exploitation—of international climate agreements. Specifically, I maintain that decisions at the United Nations Framework Convention on Climate Change (UNFCCC) that are relevant to firms subject to domestic climate regulations affect investors’ expectations about the profitability of these firms. This is because lax domestic climate policy can, in some cases, offer opportunities for firms to circumvent material costs while still de facto complying with international regulations. For example, UNFCCC decisions on the interlinkage of carbon markets may affect private firms in domestic contexts where non-stringent climate policy is in place. Investors of firms with stakes in carbon regulation through these markets should carefully follow UNFCCC deliberations on carbon market agreements, and buy stocks according to how the multilateral decisions affect domestically regulated firms. If firms are purposefully protected from mitigation costs that may accrue from international accords (e.g., with domestic subsidies), the regulated companies would enjoy “broader” international climate cooperation, because this gives them more benefits—such as access to cheap, market-based instruments for abatement. I then expect that the returns of regulated firms are positive if a new climate agreement strengthens the international supply of cheap mitigation linked to lax domestic regulation.
To test the proposed argument, I examined the financial repercussions of UNFCCC agreements on a number of major European firms between 2005 and 2010. I selected large European firms because these are regulated by the European Union Emission Trading Scheme (EU ETS), the largest mandatory market for pollution permits in the world. I chose these years because in this period, and especially in the early years (2005–07), the EU ETS was by definition a lax domestic regulation.Footnote 6 Crucially, the EU ETS was set up with two important institutional features. Firstly, during this period—and especially in 2005–07—the allowances envisioned by the EU ETS were given to the regulated firms for free to avoid firms’ relocation.Footnote 7 Secondly, while the EU cap-and-trade was intended as a legislatively independent market, during these years it was linked to international offset projects deployed in developing countries. By performing mitigation throughout these projects, European firms could acquire cheaper credits while simultaneously “banking” the more expensive EU ETS allowances at home. Importantly, the UNFCCC could decide on the procedures that ruled the international offset credits. In light of these attributes, the EU ETS firms should have been shielded from any cost of global climate cooperation, because they were involved in mitigation action at virtually zero expense.Footnote 8 In other words, the regulated EU firms would have experienced positive returns following UNFCCC agreements that guaranteed the continuous access to low-cost international permits.
Results from an event study analysis of firms’ yields during the UNFCCC negotiations suggest that international agreements indeed affected the returns of the European firms covered by the EU ETS, as the theory suggests. International climate decisions associated with a sustained flow of cheap carbon permits for regulated companies were received as “good news” from investors, and triggered a significantly positive shot-term profit for the EU ETS firms. This finding corroborates other qualitative research on the EU carbon policyFootnote 9 and is in line with the general belief that governments can complement international political commitments and generate domestic economic advantages.Footnote 10 But the paper also goes a step further. The results indicate that firms can profit not only from how international regulation overlaps with domestic regulation but also from how relevant multilateral announcements at international negotiations sustain the credibility of such domestic regulation. While little research has so far looked at transnational alliances of firms and self-regulatory efforts in the context of global climate policy, this paper suggests that international relations scholars working on climate change should more carefully look at how firms gain benefits and costs from international regulatory arrangements, and then, in turn, how those might affect the behavior of firms.
The argument
International climate change agreements seek to guarantee the stability of the global climate at the cost of private adjustments. The burden of complying with the regulations of international climate agreements often leads firms to lobby against meaningful cooperation. At the same time, not all states experience the same type of lobbying, and not all firms contrast climate cooperation in the same way. Several global firms supported the 1992 UN Climate Convention, and many business associations pushed for strong climate institutions at the 2015 Paris negotiations.Footnote 11
An explanation for why firms may not oppose environmental action (among other examples of public good provision) is that international regulation may support the arrangements of firms in states with favorable domestic regulation. In the case of global climate cooperation, firms’ response to global climate cooperation may vary with the level of domestic policy in the places where they operate, and thus where they are liable for compliance. In regions where domestic policy enforces less reliance on polluting resources, and more adoption of energy efficient production, firms may anticipate high levels of adjustment costs to global climate agreements. After all, credible international agreements require countries with low regulation to increase their regulatory levels, while countries with higher regulatory stringency at the time of the agreement experience lower adjustment costs.Footnote 12 So, if the domestic climate regulation context generates costs for domestic firms, then an international agreement that makes regulation more stringent adds burden to those costs.
Vice versa, in places where firms experience lax environmental regulation—be it, for example, because they were involved in the making of domestic green policy—adjusting to international regulation may be less costly. In fact, in the latter circumstances, there may be international mechanisms that may be even profitable for these firms. This is precisely what I argue in the rest of the paper below. Noticeably, my argument inverts the so-called trading up logic,Footnote 13 according to which firms that already comply with strict environmental regulation due to strong regulation at home profit from international regulation because this levels their uneven playing field. In this paper, I argue that firms due to too lax environmental regulation can profit materially from international regulation.
Winning from climate regulation: Firms and carbon pricing
In order to discuss the implications of lax carbon regulations for trading firms, one should first ask what form climate regulation usually takes. Here, I focus on market-based climate change regulation. This is assumed to have deep implications on firms’ mitigation behavior because, by placing a price on carbon emissions, it seeks to change the economic incentive structure of polluting.Footnote 14 One of the most common forms of market-based climate regulation is emissions trading (also called “cap-and-trade”).Footnote 15
The reason why emissions trading has become the strategy of choice of many governments in recent years is its less intrusive character vis-à-vis a carbon tax. Compared to a plain carbon tax, in an emissions trading scheme (ETS) regulators circulate allowances at a set price. If the price of carbon allowances is high and does not meet ex ante net sales, then firms have to either abate emissions or buy the required allowances. Consequently, regulated firms face an increase in production costs compared to nonregulated firms, and may experience a drop in returns from investors concerned with their profits. However, if the per-unit carbon price is sufficiently manageable and the quantity of allowances equal net sales, then firms have no significant negative effects from this carbon regulation. They may even strike a profit from cheap carbon permits if investors believe in their capacity of trading their free allowances or cheaply adopting new technology.Footnote 16
The magnitude of the revenue produced by an ETS fundamentally depends on how many permits the firm owns.Footnote 17 A “strict” ETS that provides small amounts of allowances to meet a high cap generates high burdens on complying firms.Footnote 18 Vice versa, a “soft” ETS that provides large amounts of cheap allowances protects private profits while stimulating firms’ technological innovation and de facto subsidizing production. Clearly, a soft policy that distributes a number of free allowances equivalent to firms’ future emissions offsets its intrinsic regulatory burden, because firms can clean up for free or otherwise sell permits that were costless to begin with.Footnote 19 Following this logic, firms around the world should have a strong preference for a soft ETS.Footnote 20
Along these lines, history indicates that polluting firms in the most industrialized democracies have often formed well-organized groups to shape regulations and, as far as emissions trading is concerned, industrial has repeatedly obtained free permit allocation. This is the case of the cap-and-trade system discussed in 2008 in Australia, or the sulfur market implemented in the 1990s in the United States. Similarly, the ETS debate in Europe in the 2000s was also skewed by powerful industrial lobbies.Footnote 21 The EU regulators wanted a system that would cover the European emitters in polluting sectors, such as power and manufacturing, while minimizing their potential loss of competitiveness (especially among exporters). Firms were open to a system of compensation in return for abstaining from moving production and investment to areas with laxer climate regulations. Ultimately, the set-up of the EU ETS was negotiated so that initially the regulated firms would have been considered in training, hence receiving a large number of free carbon allowances. Following a certain period (namely, from the third EU ETS “phase” starting in 2013), the cap was meant to be raised so to make the price of allowances more competitive, and the policy more efficient.
These dynamics point to the established fact that a cap-and-trade regulation involving cheap permit allocation creates a set of domestic winners that can profit from price variation of allowances.Footnote 22 What is ignored, however, is whether these winners can also profit from international agreements that affect the ETS mechanism. In the following section, I explore precisely the link between UNFCCC decisions and the EU ETS regulation, and how the feedback between the two may have made the features of a lax climate regulation even more toothless. I focus on the mechanism for which UNFCCC accords on international “offsetting” projects can strengthen how cheaply European firms can fulfill climate regulation.Footnote 23 More specifically, I explicate how the market value of EU-regulated firms may have increased in the aftermath of UNFCCC announcements that strengthened the link between the “soft” EU ETS and cheap international pollution permits.
UNFCCC meetings and the European Emission Trading Scheme
This paper claims that international climate agreements can cause significant variation in investments on polluting firms subject to protective environmental regulations at home. In this section, I further contextualize the argument by describing how UNFCCC deliberation can affect the profits of the European ETS regulated firms scrutinized in this paper.
The UNFCCC was established at the 1992 Rio Earth Summit and is currently the main international organization involved in global GHG abatement. The Convention coordinates quantified reduction targets and seeks to harmonize national regulations for mitigation and adaptation, including the fungibility and security of global emission allowances. Intergovernmental meetings occur twice a year and last roughly two weeks. I focus here mainly on the winter meetings. These correspond to the yearly Conference of the Parties (COPs), which are the main deliberators of the UNFCCC.Footnote 24
Decision-making is based on consensus voting over a long list of issues discussed in the course of the annual meetings. Informally, some parties may have more influence on some issues than on others. For example, countries such as European Union member states “own” some agenda points, and may dictate the multilateral decisions on their salient issues. That said, research indicates that international agreements do not always reflect the interests of the most powerful states. In fact, developing countries have been frequently successful at tilting mitigation policy decisions or linking their policy demands to carbon market strategies.Footnote 25 On the issue of emission trading and carbon pricing in particular, decision-making at the UNFCCC has been historically characterized by uncertainty. And even if there was reason to believe that UNFCCC negotiations and positions are endogenously pre-determined, the timing of the decisions would not be obvious at the outset of the negotiations, so any short-run movement of stock market values in regulated firms may still be causally driven by information about EU ETS profitability emerging from the international talks.
As part of the Kyoto Protocol flexible mechanisms, emission trading is a fundamental agenda point at each annual COP. The UNFCCC can deliberate on “guiding principles,” such as the terms in which emissions market can be monitored and in which permits can be deemed reliable. Evidently, these types of decisions do not have any legal repercussion for compliers. Rather, they release information that regulators like the European Commission can integrate in their approach to regulate emissions permits. Hence, if the UNFCCC collectively decided, for example, to continue distributing allowances in the present instead of enforcing a portioning of current allowances for the future, this would imply less pressure on EU governments to restrict the present provision of carbon allowances.Footnote 26
I concentrate here on the more direct way in which the UNFCCC can materially influence private returns. This involves decisions over the terms in which international abatement projects (also called “offset” projects) can feed in regional carbon markets. While the UNFCCC has no say on the domestic setup of carbon markets, such as the EU ETS, it can set the quantity of carbon permits circulated via the Clean Development Mechanism (CDM) and the Joint Implementation (JI). These are project-based programs led in developing countries linked to carbon markets and de facto accepted by most ETS regulators around the world. Each ton of CO2 equivalent reduced through a CDM and a JI project generates, respectively, a Certified Emission Reduction (CER) and an Emission Reduction Unit (ERU).
In the case of the EU ETS, although the European Emission Allowances (EUAs) are the only cashable units within the European scheme, firms are allowed to use CERs and ERUs to surrender for compliance obligations.Footnote 27 Initially the EU Commission welcomed the linkage between the domestic carbon market and CDM/JI as a way to enhance technology transfer while stimulating a global market for carbon—one of the essential goals of the 1997 Kyoto Protocol.Footnote 28 Starting with a discussion of the problems of CDM/JI monitoring and verification in 2008, and then with formal reforms to the acceptance of ERUs/CERs in 2012, the circulation of offset credits in the EU ETS progressively became more restrictive. So, while today these credits still circulate in several UNFCCC-complying carbon markets, the linkage between the CDM/JI credits and the EU ETS mattered especially in the early pre-2008 stages, before the EU on its own began to restrict use of CDM and JI, and energy prices peaked following the commodity “supercycle.” Notably, by affecting the global supply of the CDM- and JI-generated credits, the UNFCCC can influence the amount of credits available to compliers in carbon markets. So, with regards to the EU ETS in the pre-2008 years, UNFCCC decisions related to international offset credits affected how EU ETS firms could abate emissions at the lowest possible cost. Specifically, UNFCCC outcomes that increased the international supply of CERs and ERUs for carbon market participants would have altered the compliance costs of EU ETS–regulated firms, because the costs of international credits have always been substantially lower than the EU ETS allowance price.Footnote 29 Thus, the option to “clean up” through CDM and JI projects should have created incentives for EU ETS–regulated firms to venture in developing countries and perform easy mitigation tasks in order to cheaply obtain more permits. At least until the reforms tackled in 2008 (which coincided with the collapse of some Western economies and other UNFCCC decisions), it was rational for the European firms to use the converted allowances for compliance and to sell the excess freely allocated allowances to competitors, or bank them to avoid the cost of more stringent compliance in later years.
It is worth noting that high supplies of CERs and ERUs would also put pressure on the absolute value of the original EU ETS carbon allowances, which could also lead to a mixed effect of UNFCCC decisions on offset credits. This is because firms in foreign countries—e.g., Australia and Japan—also have had access to the credits allocated via the CDM and JI projects. Consequently, more international credits could have, in principle, benefited a large range of global firms, and thus reduced the utility of free emissions allowances for EU ETS–regulated compliers. Still, in the years between 2005 and 2012 large countries like the United States did not engage with CERs and ERUs. In fact, in these years it was precisely European firms with carbon allowances that went decisively after international offset credits, possibly to clear the market of these opportunities.Footnote 30
This discussion leads me to expect that, for the early years of the lax EU ETS regulation, international climate agreements that widened the scope of cheap abatement for the European regulated firms increased their short-term profitability. I test this proposition in the empirical section of this paper. To be clear, this hypothesis should hold only if I assume that the UNFCCC is capable of revealing new information on the future of carbon trading that would not otherwise be known to investors beforehand. In other words, the EU ETS should be “informationally efficient,” which means that the firms’ share prices reflect all publicly available information. So, while EU ETS investors may know the preferences of the EU delegation or their national representatives, the final outcome at the UNFCCC negotiations should be unknown before its release. This is plausible because, even when the precise agenda of the meetings is decided beforehand, investors cannot anticipate with precision the final timing and shape of decisions in the final stage of the negotiations. Consequently, if the outcomes of the UNFCCC negotiations cause “abnormal” returns—that is, returns that cannot be explained by regular movements of financial assets—in the books of carbon trading firms at the times of COP meetings, this should be because information from the UNFCCC conferences shapes investors' expectations for EU ETS firms.
Empirical investigation
Sample and firms' measurements
To investigate the link between the outcomes at the UNFCCC climate meetings and financial profits of loosely regulated companies, I concentrate on the daily stock performance of thirty-eight randomly selected publicly-traded companies of the EU ETS. The firms were drawn based on specific criteria. My study is focused on the years before the deepening of the European financial crisis, which inevitably changed the fundamentals of the market performance of all firms around Europe.Footnote 31 This period coincides with the early phases of the EU ETS when pollution allowances were given for free. More prominently, I focus on European firms trading between 2005–07, the years of the laxest phase of the EU ETS (Phase I). I use the years 2008–12 (Phase II) as comparison units.Footnote 32
Of the firms involved in EU ETS in Phase I and II, I discarded the firms with small emitting facilities (<5 installations) and those that stopped existing or were created in the course of the years under analysis. I also ignored those that do not trade in international stock markets, and only considered the firms that are listed on international platforms—namely the SP500 and STOXX600. Following Bushnell et al. (Reference Bushnell, Chong and Mansur2013), I identify 260 companies that at the time had the majority of sales earned in Europe, so that they are credibly exposed to the EU ETS regulation. Of these, 114 have non-zero allowance data in the EU's Community Independent Transaction Log, and are therefore of interest for my analysis of “protected” (i.e., loosely regulated) EU ETS firms. I randomly sampled one third of them (thirty-eight) for the central analysis, i.e., the investigation of the effect of international climate agreements on domestically regulated firms in the EU.Footnote 33 In separate analyses, I match these thirty-eight EU firms to their most-similar non-EU firms. These additional data allows for an alternate comparison with firms at the time not regulated by emission trading schemes, hence not subject to any beneficial domestic carbon policy.
In the focal period the EU ETS firms under investigation were among the five hundred largest global companies, for which the annual value of permits reached nearly $60 billion. The firms are representative of the nature of the EU ETS, as shown by the breakdown by country and sectors of production in figure 1. The sample spreads across the twelve founding EU member states. Several companies have headquarters in London; this makes the United Kingdom the “home” of roughly one third of the observed firms, followed by Germany in terms of represented companies. The comparison between the relative numbers of firms in the sample and in reality indicates that the sample underrepresents firms based in Ireland and Spain and over-represents France, but it is otherwise representative of the other major countries. Across sectors, electricity generation and manufacture are the two largest ISIC industries depicted in the sample. The sectoral breakdown is reflective of the real-world EU ETS, where power generation and manufacturing correspond to more than 85 percent of the regulated GHG emissions.
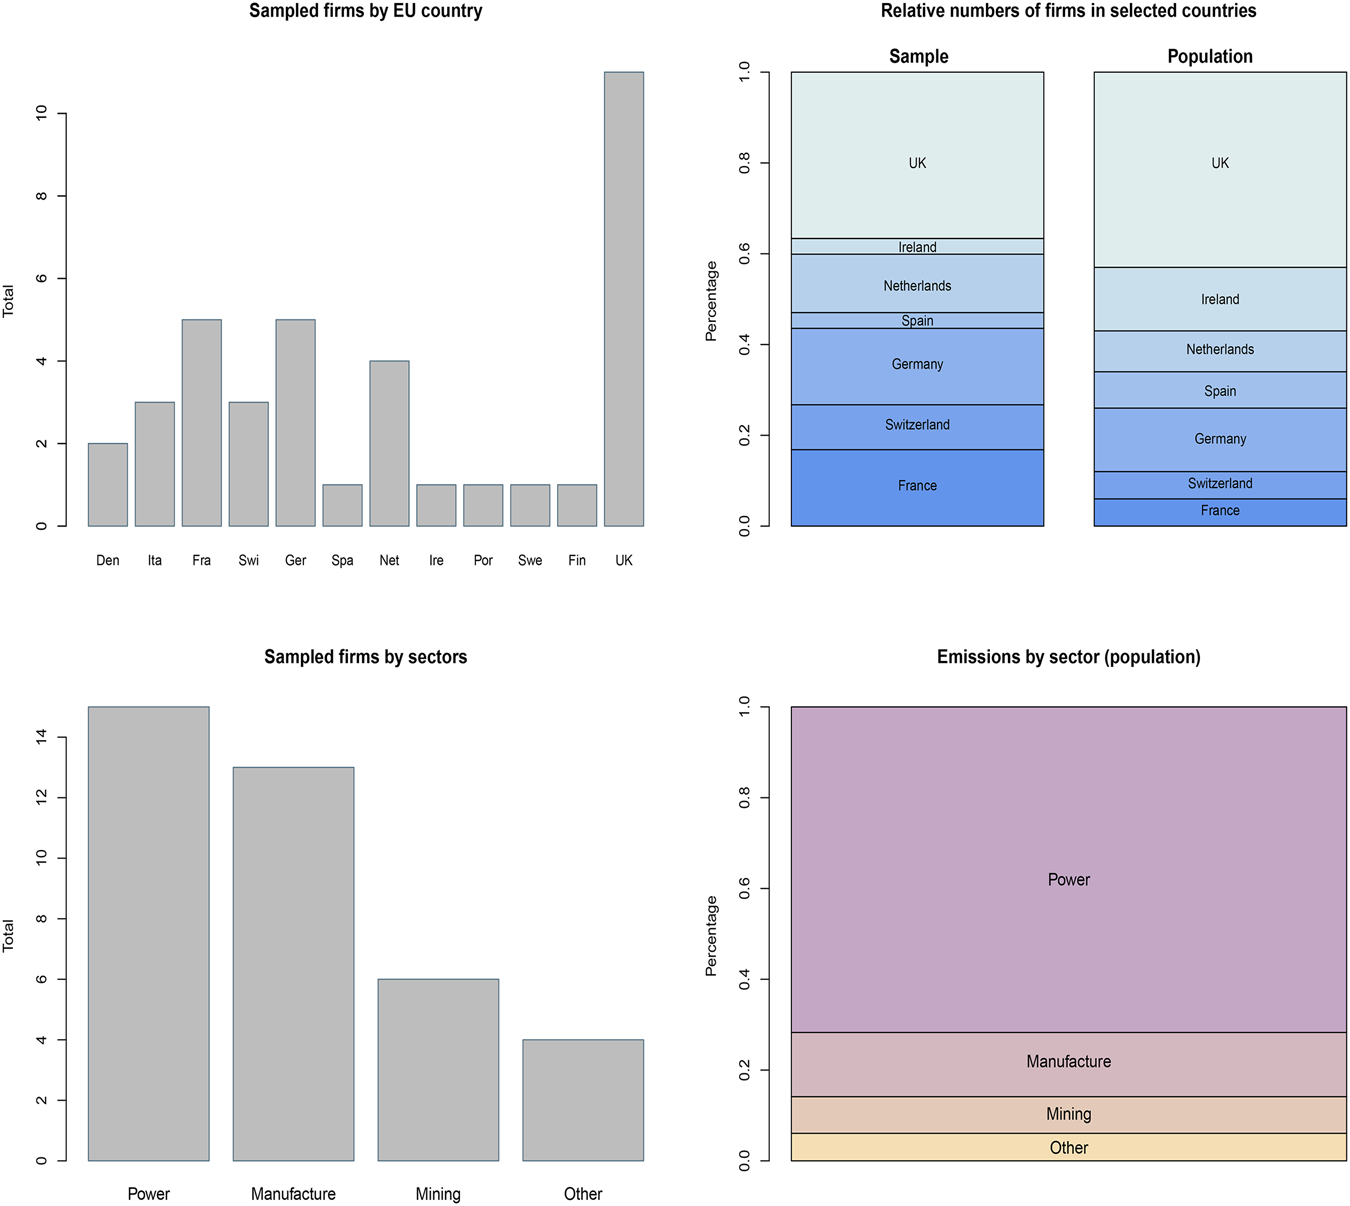
Figure 1: Characteristics of the Sampled EU ETS Firms
This plot describes the selected EU ETS firms according to their distribution by country and sector. The top left shows the distribution of firms' headquarters. The top right panel reports the densities of these firms for the most investment-rich countries, and compares these proportions to the actual numbers of firms located in those same countries (data from the Financial Times fDi Markets database). The bottom left histogram shows the distribution of firms based on their industries defined with UN International Standard Industrial Classification (ISIC) categories. The bottom right plot shows the 2012 emissions proportions from the covered EU ETS sectors.
I collected the firms’ stock prices in current US dollars for the period between April 2005, when the EU ETS was first launched, to December 2010, when the Great Recession in Europe inevitably clouded the relation between financial private returns and any international deliberation, let alone the UNFCCC meetings.Footnote 34 The stock prices were collected through Thomson Reuters Datastream and are equivalent to the Dow Jones STOXX 600 market index.Footnote 35 The first period includes the years between April 2005 and May 2007, which corresponds to the first phase of operation of the EU ETS. The second period corresponds to June 2007 to December 2010. The first phase was by far the more volatile, while the second phase included years of internal negotiations in view of the 2013 reforms. As per my previous discussion, I expect my theory to be most pertinent to the 2005–07 years, because of the mix of lax domestic regulations in combination with uncertainty around cooperation for carbon trading international mechanisms.
Figure 2 provides the basic context of the EU ETS trends between 2005 and 2010. The figure shows that in 2005–07 allowance prices stayed above the threshold of 10 Euro per carbon ton, a price level that suggests that at this stage investors were taking the policy seriously and collecting information about the implications of carbon permits. Importantly, in 2005–07 delegates at international climate meetings were still extensively discussing the setup of carbon trading and the linkage with other market instruments. According to Gupta (Reference Gupta2010, 646), during this phase “the EU had to renew its efforts to convince other countries to ratify the Kyoto Protocol and push implementation efforts further.” As such, this is a period when international cooperation could really make a difference for the future of carbon regulation. It is worth noticing that, as figure 2 shows, prices seemed to react to some COPs. For example, while the day before the Nairobi COP a ton of carbon was valued at 15.6 Euros, the day after the conclusion of the negotiations it was almost 18 Euros. This pattern suggests some connection between COP meetings and EU ETS trends. In what follows, I rely on stock performance measures to systematically examine the effect of international climate policies on the firms’ financial value.

Figure 2: EU ETS Price Trends and International Climate Negotiations
This plot shows the historical series of European Union Allowance daily prices between 2005 and 2011 (source: the Intercontinental Exchange, ICE). Future prices of Phase I allowances are expressed until April 2006. Future prices of Phase II allowances follow. Bars corresponds to the first day of each high-level segment of the Conference of the Parties (COP).
Stock prices show clear signs of non-stationarity (Dickey-Fuller p-value = 0.3), which means that the series present unit roots and cannot be used for consistent estimation. I log-difference the price to obtain continuously compounded returns. This transformation is econometrically preferable but also theoretically useful, because returns capture short-term changes, the primary unit of interest in this study. I calculate first differences to standardize the returns and make them comparable across all thirty-eight firms. Figure 3 illustrates the aggregate average returns for the period between April 2005 and April 2007, which indicate stationarity because the series floats around zero.

Figure 3: EU ETS Average Returns and Prices, 2005–07
The figure illustrates patterns related to the outcome variables of the paper. The top plot shows the average stock return of the 38 selected EU ETS firms, while the bottom plots the stock return (red) and price series (black) for four specific firms. The arrow notes the variation when the first verified emissions from the Phase I were released, though this is outside of the scope of this paper.
The plot noticeably shows that much volatility occurred in April 2006 with the EU first disclosure of verified emissions that led to a sharp drop in carbon prices. This event is unrelated to the international negotiation activities central to this paper; rather, I am interested in the variation around the time of the COPs (the gray bars in figure 3). My hypothesis suggests that, in case of “good outcomes” related to the expansion of offset credits for regulated firms, the price/return of EU ETS firms should increase. Vice versa, outcomes that do not add information about the stream of cheap international permits should not cause positive returns. Similarly, “good outcomes” would also fail to have similar positive effects on firms in countries where domestic carbon policy is not set up to protect their short-term interests. Anecdotally, the sub-plots related to the performance of a few diverse EU firms (bottom of figure 3) indicate that the 2005 and 2006 COPs might have indeed triggered the expected positive market reaction. To rigorously investigate these dynamics and the ramifications of my hypothesis, I now turn to describe the setup of my regression analysis.
Event study setup and outcome variables
The most effective empirical strategy to uncover how decisions at international climate meetings drive profits among European emission trading firms is an event study research design.Footnote 36 Event studies are usually set up in two steps. First, one needs to define a firm i's expected normal return (E[Rit]), that is, the daily return one should expect in the absence of UNFCCC decisions. The simplest assumption here is that investors in the EU ETS would not deviate from trading their favorite product unless they can profit from investing in other markets that better suit their interests. In order to estimate this type of return, I estimate the following linear relationship:
 $${\rm E}\lsqb R_{it}\rsqb = \alpha _i\sum\nolimits_{z = 1}^Z {\beta _iR_{zt} + \varepsilon _{it}} $$
where α is a constant, Rit is the return to a risky alternative asset z at day t, and the β is the weight that reflects how changes in the return of asset z translate into changes in the return Rit, following asset pricing theory.Footnote 37 Empirically, I estimate the weight of Rzt with a combination of three alternative returns: a global stock market index, the NYSE American Stock Exchange Index (Amex), and the Renewable Energy Industrial Index (Renixx), to control for specific types of profits relevant to the energy industry.
In a second step, I estimate the European stock market reactions to the climate negotiation outcomes by calculating the returns that deviate from the normal values at the time of a UNFCCC meeting. As I describe below, I identify as “outcomes” the UNFCCC decisions reported by official sources. Practically speaking, an abnormal return is the difference between the observed return and the “counterfactual” control set of estimations from the normal return (E[Rit]) conditional on the measures of risky assets xt mentioned for equation (1). The abnormal return ARit is then computed with the simple equation:
 $${ A}{ R}_{{ it}}{\rm}= { R}_{{ it}} {-}{ \ E}\lsqb {{ R}_{{ it}}{ \vert }{ x}_{ t}} \rsqb $$
When estimating abnormal returns, one should choose a proper time window where the error term can be also estimated. The annual climate negotiations usually last fourteen days. Realistically, multilateral decisions are rarely made at the beginning of the negotiations, and relevant statements tend to be released towards the end of the UNFCCC meetings.19 I calculate abnormal returns for a window that comprehends all the official negotiation days—roughly two weeks, depending on the meeting—plus three days preceding the negotiations and three days following the negotiations, for a total of twenty days. The returns are compiled for all COPs, where decisions vary in terms of timing and settled terms. I come back to the coding of the substantive terms of the COP agreements below.Footnote 38
Following common practices in the literature, I use the abnormal return series to construct two quantities of interest: the basic abnormal return (AR), which corresponds to the daily stock return on each firm relative to the counterfactual benchmark, and the average abnormal return relative to the whole EU market at the time of each COP (AAR).Footnote 39 Due to the notable sectoral and structural heterogeneity between firms in the selected EU ETS sample, a more relevant quantity of interest may be the AAR, i.e., mean return to the sampled EU ETS firms at time t. Nonetheless, I use both measures for completeness, and expect both quantities of interest to be similarly associated to carbon credit-related UNFCCC outcomes.
Estimation strategy and explanatory variables
In order to estimate the effect of UNFCCC decisions on firms’ returns, I employ a fixed effects linear regression where the left hand side includes the two measures of abnormal returns described in the previous section. The regression models for the two outcome variables follow, respectively, the equations:
 $${\rm AA}{\rm R}_{ijt} = \alpha _0 + \beta _1{\rm Good\ UNFCCC\ Outcom}{\rm e}_t + X_{ijt}\beta _2 + \eta _i + \gamma _j + \zeta _t + u_{ijt}$$
 $${\rm A}{\rm R}_{ijt} = \alpha _0 + \beta _1{\rm Good\ UNFCCC\ Outcom}{\rm e}_t + X_{ijt}\beta _2 + \eta _i + \gamma _j + \zeta _t + u_{ijt}$$
where t indexes time (each day under investigation), i indexes each firm, and j indexes each country where firm i is headquartered. In the above model, X are a set of (firm- and country-level) covariates, η and γ respectively are the estimated firm and country fixed effects, ζ capture time effects, and u is the idiosyncratic error term.Footnote 40 The predictor of interest is Good UNFCCC Outcome. This is an indicator that measures when the governments at the UNFCCC agree on decisions on emissions trading that would increase cheap abatement options and “banking” free allowances for EU ETS firms. As per the theoretical discussion, I expect its coefficient (β 1) to be positive and statistically significant for the early EU ETS years.
In terms of coding, the Good UNFCCC Outcome variable was constructed with a manual content analysis of official UNFCCC documents. Most crucially, I used the daily reports in the Earth Negotiation Bulletin of the International Institute for Sustainable Development (IISD), which I afterwards compared with press releases published on the UNFCCC webpage. The IISD texts are neither a reflection of strategic positions nor a public relation-type of press. They are summaries of independent observers at the UNFCCC negotiations (Castro et al., Reference Castro, Hoernlein and Michaelowa2014). The coding of Good UNFCCC Outcome was performed for all the days within the twenty-day window identified around each UNFCCC meeting. For each of said days, the documents were qualitatively reviewed and relevant decisions were marked down.Footnote 41
Following the content analysis, the Good UNFCCC Outcome variable is assigned the value of 1 to each day in which the official documents report a decision that incentivizes the use of offset credits for current commitment periodsFootnote 42 or that encourage firms to obtain permits generated in CDM and JI projects.Footnote 43 The variable takes a value of 0 otherwise, e.g., if at any specific day the issue of tradable credits is not addressed or no particular agreement is settled. In a separate, ordinal version, Good UNFCCC Outcome also takes a value of -1 if outcomes are “bad,” e.g., if an agreement limits the availability of international credits available to compliers, including decisions of fragmenting carbon markets or constraining mitigation projects under the EU ETS. However, and as discussed later, the results are not driven by the breakdown of this variable, and they are substantively robust if the variable is defined discretely.
To illustrate the coding of the variable, on November 16 2006 the UNFCCC Press reported:
[The Parties agree that] the carbon market has tremendous potential, and the Kyoto mechanisms require continuity after the first commitment period to continue their expansion, and [that] the demand for credits generated through the mechanisms increase in future commitment periods to sustain the market value of carbon.Footnote 44
In this case, the international community agreed to sustain the linkage of credits from CDM/JI and mechanisms such as the EU ETS. Thus, in my coding the day of this decision corresponds to a Good UNFCCC Outcome for EU ETS firms (= 1).
A detailed list of decisions captured by the Good UNFCCC Outcome variable are reported in the Appendix.Footnote 45 Once again, decisions are coded at the day level, in light of the fact that some COP have more than one relevant decision and decisions can be announced at different times during the negotiations. Nevertheless, the final agreement in the last hours of negotiations is often the main output of a COP, and table 1 reports the essential outputs for the five COPs under considerations, suggesting how these should overall affect returns for EU ETS firms. As indicated, the intergovernmental meetings in Montreal (2005) and Nairobi (2006) made the support of complying firms with additional credits a priority. Contrastingly, the following COPs were more mixed. For example, in Bali (2007) countries focused on making carbon markets more efficient, but they also agreed on letting new parties participate in CER provision. And in the 2008–10 years, while EU ETS allocations remained mostly free, EU rules of credit auctioning were discussed and the international community started tackling issues of CDM monitoring more seriously, making “good outcomes” for EU ETS firms less frequent. In light of these considerations, I expect the positive effect of Good UNFCCC Outcome to be most prominent in EU ETS Phase I. Vice versa, I predict this effect to have less influence in later EU ETS years, or for firms without EU ETS permit allocation.
Table 1: Selected UNFCCC Meetings and EU ETS-Relevant Agreements

This table illustrates the dates of the COPs between 2005 and 2010, the relevant decisions for EU ETS firms, and the theorized effect that these decisions should have on returns of EU ETS firms. See Table A.2 in the Appendix for a detailed report of the specific decisions as worded in the Earth Negotiations Bulletin summaries.
Control variables
A main feature of event studies is that they generate counterfactual-like returns to which one can compare the observed returns. Consequently, my research design has the benefit of neutralizing spurious dynamics outside the framework of investigation. Nonetheless, alternative mechanisms may explain the magnitude of abnormal returns during UNFCCC meetings. Hence, I include a set of control variables X in my regressions.
First, the stock value of polluting firms may vary as a function of domestic environmental policy announcements that may fall around the timing of the COP but may be unrelated to international climate negotiations. Consequently, I estimate the effect of the variable Domestic Policy, which is a dummy that takes the value of 1 when any of the EU countries represented in the sample announced a national policy related to climate change mitigation. The coding included new renewable policies, energy efficiency programs, subsidies for biofuels and transportation policies. The variable is coded 0 otherwise.Footnote 46
It is also possible that democratic elections elicit information that may be relevant for the financial performance of polluting firms. For example, elections may generate uncertainty about the incumbent government and anxiety about future cabinets, which may care more or less about the environment.Footnote 47 I control for the timing of these events with the variable National Elections that takes a value of 1 for the scheduled dates of national elections in each of the EU country a firm belongs to, and 0 otherwise. Note that I also mark with 1 the two days before and after election day, to capture electoral campaign spillovers.Footnote 48
Additionally, I make sure to account for the public salience of climate change issues, which may affect decision-makers’ decisions at the UNFCCC as well as investors’ beliefs on the profitability of polluting companies. The salience of climate change may be a function of disastrous events that occur at the time of a climate negotiation, or simply by media attention that convinces the public to closely follow the international meetings. So, I include the measure Relevant Web Searches of climate change to my regression equation. This variable is an indicator that tracks internet-users’ interests in international climate events. I used Google Insights (now called Google Trends) to retrieve the volume of weekly web searches for words such as “climate change negotiations,” “Kyoto Protocol,” and “climate politics.” I restrict my search to English queries in the EU15 countries.Footnote 49 Additionally, I include the value of Carbon Price to make sure that changes in firms’ profits are not driven by regulation-specific mechanisms that influence the price of the EU market. Because Relevant Web Searches and Carbon Price are both non-stationary, both lags and rates are included to account for levels and changes.
Results
I first estimate the linear models for the years of the EU ETS first phase (2005–07), when firms should have been most sensitive to UNFCCC deliberation given the domestic characteristics of the EU regulation and the general uncertainty around carbon trading. The estimates from the econometric models are presented as coefficient plots to ease the interpretation of the findings, although the complete set of coefficients are also reported in tables in the Appendix.
Figure 4 reports the coefficients of two permutations of the AAR and AR models for the initial EU ETS period, which corresponds to the phase between April 2005 and April 2007. The first model (illustrated with a triangle) corresponds to a baseline specification with only the Good UNFCCC Outcome predictor in the right-hand side in addition to the fixed effects dummies. The second model (illustrated with a circle) corresponds to a full specification that includes the fixed effects and all the control variables presented in the previous section. To start with the correlations in the AAR model, I find that positive outcomes are positively and significantly correlated with the average EU ETS abnormal returns. The point estimate suggests that strengthening the provision of carbon permits for EU ETS firms increases average profits by about 0.07 points. This is a relevant amount if one considers the market value of some of the regulated companies. As all the firms in the EU ETS were worth about 16 billion US dollars as of April 2006, a 7 percent change in returns resembles a change of almost a billion US dollars. The estimations of the more restricted model confirm this result. While I also find that the occurrence of national elections, the announcement of domestic climate policies and the public salience of the climate change issue affect the financial returns of polluting firms, the variable Good UNFCCC Outcome that measures announcements of stronger linkage between the EU ETS and cheap offset credits remain robust and significant, everything else constant.

Figure 4: The Impact of UNFCCC Decisions About Abatement Credits (‘Good UNFCCC Outcomes’) on EU ETS returns, 2005–07
The figure illustrates the results of four fixed effects linear models estimated on the 2005-07 data. The outcome variable for the two models at the top is the firms' Average Abnormal Returns, while the outcome variable for the two models at the bottom is the firms' Abnormal Returns. ‘Baseline’ corresponds to coefficients from a model without the control variables described in the text; ‘Full’ corresponds to coefficients from a fully specified model estimated with the control variables. Each dot corresponds to the estimated coefficient of Good UNFCCC Outcome for each of the model. The gray and colored lines correspond to the 95 percent and 90 percent confidence intervals, respectively. See Appendix for the regression tables with the complete set of estimated parameters.
The bottom of figure 4 reports the results for the second outcome variable representing daily varying returns (AR). The baseline model reveals that “good news” from the UNFCCC is positively correlated with the day-varying returns. The uncertainty of the AR estimates is larger than the AAR models due to the larger variation in the abnormal returns data (recall that AR is based on firm-specific sensitivities to the baseline stock market, while AAR is an average measure across the sampled firms). Nonetheless, the magnitude of the Good UNFCCC Outcome effect is qualitatively similar to the one for average abnormal returns. The coefficient becomes larger and more significant by virtue of including the control variables. These results suggest that UNFCCC decisions that seek to sustain the venues of cheap compliance for regulated firms make investors optimistic about the future profits of EU ETS companies. In other words, the findings support the hypothesis that firms privately profit from international agreements if they are adjusted to an ex ante lax policy.Footnote 50
While the 2005–07 data seem to support the theoretical argument of the paper, it is important to investigate the regressions for later periods when information had been provided on the efficiency of offset projects for effective carbon training and efficient abatement. Thus, I run the regression models on the return data centered between 2008 and 2010, i.e., the second EU ETS phase. Figure 5 shows the regressions, which are presented in a similar fashion to the regressions for 2005–07. I find that the neither of the two outcome variables is significantly correlated with Good UNFCCC Outcome. The estimated coefficients of the AAR models are virtually zero. The coefficients of the daily AR regressions are negative both in the unconstrained and the constrained specification models, although they are also statistically insignificant. One interpretation of these null results for the 2008–10 years is that in the second EU ETS phase firms started internalizing the future restrictions of free allowances announced for Phase III. Moreover, in these later UNFCCC negotiations the EU started being more vocal about problems with CDM and JI implementation and monitoring, pre-announcing domestic reforms to the qualitative acceptance of international offset credits. Overall, the null finding is in line with the broad theoretical expectations.

Figure 5: The Impact of UNFCCC Decisions About Abatement Credits (“Good UNFCCC Outcomes”) on EU ETS returns, 2008–2010
The figure illustrates the results of four fixed effects linear models estimated on the 2008–2010 data.
This finding does not mean that the link between multilateral decisions on international offset credits and domestic regulations is outdated or irrelevant today. For example, in 2018 for the first time the South Korean Ministry for Environment allowed the use of international offset credits in the domestic carbon market. So, my theory that international deliberation on emission trading and international credits affect the profitability of firms may be relevant for South Korea and other ETS systems that are still under-researched. More generally, the null results for the 2008–10 years imply that the impact of international agreements on the profits of targeted firms disappears the moment domestic regulation deviates from its protective nature. As domestic regulation becomes less aligned to the interest of private actors, the influence of pertinent intergovernmental decisions may become less effective.
It is worth noting that the results are robust to a number of modeling choices and alternative estimations. They are not sensitive to dropping the UK companies from the sample, which may be warranted given the special status of UK business regulation in the EU and previous cap-and-trade experiments in the UK before the establishment of the EU ETS (see Appendix). In additional analyses, I also explored if the effects of UNFCCC decisions supporting the provision of emissions permits vary across sectors.Footnote 51 The results indicate that, although firms witness positive returns when the UNFCCC is in favor of carbon credit expansion, the main profiteers are manufacturers and, to a lesser extent, mining companies. Accordingly, power firms are neither capable of credibly using opportunities for abatement abroad nor do they credibly gain from emissions trading.Footnote 52 This is evidence that the winners of a “generous” carbon trading system supported by international policy are the more flexible companies, e.g., manufacturers that can feasibly relocate if domestic regulation were to become less generous. With respect to the main hypothesis of this paper, this subsample analysis further supports the conjecture that global agreements influence investors’ beliefs about the advantageousness of lax regulation.Footnote 53
Because “good” outcomes mainly manifest themselves at the end of the COP time window, I also explore if the effects are indeed strongest in the last days and how long they may last. I find that the positive average abnormal return in the EU ETS sample picks up right before the end of a UNFCCC meetings, toward the last two days of a conference, and then starts dissipating after three days. But the implications of international decisions at the UNFCCC remain relevant even if they only have short-term effects.Footnote 54 Furthermore, I investigate how each of the earlier COPs may have affected private returns individually. The single COP estimations show that the Nairobi decisions created the biggest return for EU ETS firms.Footnote 55 This is consistent with reports that depict the Nairobi meeting as particularly supportive of emission trading in the EU, both in terms of allowing EU countries to use most of their reserve allowances for trade or cash-in and in agreeing on new mitigation projects that could generate tradable—and, thus, profitable—emission reduction credits.
My theory puts forward the centrality of domestic regulations to explain why international climate agreements have material effects on domestically regulated companies. In so doing, my argument implies that there should not be such effects for companies whose foreign homes lacked the same type of protective regulations as the “soft” EU ETS. To test this implication of my argument, I perform an additional test by correlating the UNFCCC outcomes codified in my dataset with the private returns of a number of non-EU ETS firms in 2005–07. The Appendix lists the non-European firms that have matching market characteristics according to the 2010 version of the Forbes Global 2000 dataset.Footnote 56 For my thirty-eight EU ETS firms, I searched the non-European companies within the same sector and with the most similar market value, sales, profits, and assets. I then selected two most-similar firms for each EU ETS firm, to avoid systematic upward or downward biases.Footnote 57 Finally, I collected the prices of the non-EU firms following the procedure for the EU firms, i.e., through the Thomson Reuters Datastream.
After generating the two forms of abnormal returns (AAR and AR) as constructed for the EU ETS, I performed the same regressions analysis presented beforehand. Figure 6 reports the coefficients. With respect to the average abnormal returns (AAR) models, I find that in both the unconstrained and constrained models the coefficient of Good Outcomes is negative and statistically significant. This result suggests that an international climate agreement that is interpreted positively by EU ETS investors causes smaller (null or, in fact, potentially negative) returns in firms outside of the EU carbon regulation zone. The results are even more negative if I consider only firms from Annex I countries. In other words, the abnormal returns are even smaller for firms from member states that are in principle part of the international regulation decided at the COPs (see Appendix). At minimum, these data from the non-EU sample indicate that the returns of the non-European firms do not react to decisions at international climate meetings like they do for EU ETS firms, in line with my theoretical expectations.

Figure 6: The Impact of UNFCCC Decisions About Abatement Credits (“Good UNFCCC Outcomes”) on non-European returns, 2005–07
The figure illustrates the results of four fixed effects linear models run on the 2005–2007 data of the matching non-EU firm.
The additional evidence reinsures that my main findings are not an artifact of temporal trends and other omitted phenomena that violate the efficient market assumption upon which the logic of the event study relies. Nonetheless, one may still worry that this data only sheds a limited amount of light on the mechanism at the heart of the paper. Importantly, I have assumed that EU firms and their investors should be sensitive of the importance of UNFCCC decisions of international credit issues in order to profit from them. How can one be sure about this? Are international offset credits more supported among EU ETS firms than unregulated firms without access to allowances?
To answer these questions, I resort to an exclusive dataset of firms’ opinions on the EU ETS called the Carbon Market Survey. First fielded in 2007, this survey is annually conducted by Thomson Reuters Point Carbon. All firms covered by or somehow affiliated to the EU ETS regulation are invited to take part in the survey. Respondents are asked to provide information about their firms in terms of location, sector, emission levels, and access to allowance, and express their views on a number of items. In particular, the questionnaire asks opinions on the CDM/JI projects. On this end, the survey included the questions “Will CDM/JI projects eliminate the need for internal abatement in the EU ETS?” (No/Yes) and “Is CDM/JI the most cost-efficient way to reduce emissions?” (Completely Disagree to Completely Agree). Following my theory, one would expect that the EU ETS–regulated firms (i.e., firms with access to EU allowances) would be more prone to support CDM/JI projects, for these protected firms should be the more enthusiastic supporters of the linkage between the EU ETS and offset credits.
Table 2 reports the results from correlating the responses to these two questions with the structural covariates of the survey firms, including the dummy EU ETS–regulated, which refers to whether a firm has access to free allowances (yes/no). The regression results show that European firms directly regulated by the EU ETS are on average more supportive of CDM/JI links with the EU ETS than unregulated firms. This correlation is significantly positive and robust to controlling the structural features of the responding firms, as well as using different modelling strategies (see Appendix). It is also worth noting that, despite the reforms following the second EU ETS phase, the correlation remains significant for the 2013 survey, at a time where fewer firms were allocated free permits overall. This seems to indicate that even later on firms still preferred international integration of carbon market mechanisms over fragmentation despite the announced EU ETS reforms. More importantly, the survey data provides further confidence about the link between the regulatory advantages of the EU cap-and-trade regulation and the private use of international agreements to access further cheap “solutions” to abatement goals while keeping up business-as-usual profits.
Table 2: Emission Trading Opinions among Firms: Link between EU ETS Allowances and International Abatement Credits

The first model reports coefficients from a probit model (Y: 1 “yes” or 0 “no”), while the second and third models report coefficients from a linear model (Y: 1 “completely disagree” to 5 “completely agree”). Reference category for the Emissions variable is 0 for 2007 year, while it is 0–0.5 Mt for the 2013 year. Standard errors are clustered at the country level. * p < 0.1, ** p < 0.05, *** p < 0.01.
Conclusion
Understanding how global public good cooperation affects private profits is a complex puzzle in international political economy research. In this paper, I focused on how the private sector reacts to international deliberation on issues related to climate change regulation. While there is increasing evidence that the business community occasionally welcomes international climate agreements, it is less clear under which conditions international climate accords positively affect private interests in order to generate such support.
I argued that international climate agreements can have positive material repercussions on the books of polluting private companies if the climate regulation at home is lax and protective. Zooming in on the UN annual climate meetings, I posited that if firms are subject to protective regulatory instruments that put them in the position to profit from abatement credits, they financially gain from climate agreements that globally extend these mechanisms. I focused on emissions trading firms in the European Union as an example of firms regulated by a lax domestic policy that fulfills international climate cooperation while, at least in the early years, protecting the core economic interests of the companies via the over-allocation of cheap allowances. I claimed that UNFCCC announcements related to the linkage of international offset projects and compliance schemes such as the EU ETS may have caused abnormal positive returns for regulated carbon trading firms, everything else constant. I test my proposition with an event study of stock price behavior of 38 major EU ETS–regulated firms during a number of international climate meetings. The analysis lends support to the view that financial markets carefully evaluate the UNFCCC outcomes. Specifically, I find that EU ETS investments react positively to multilateral decisions that reinforce the linkage between the EU ETS and international credits.
This finding is relevant to scholars interested in the interplay of environmental policy and private actors’ behavior. While researchers have already indicated the intimate relationship between international climate regulation and private profits broadly put,Footnote 58 this study sheds new light on the link between international negotiations and private profits, highlighting how multilateral announcements can affect the profitability of regulated firms. Evidently, the study is focused on Europe, but the findings should be of timely relevance for other countries where market-based carbon policies are gaining ground, such as Australia and California, or where organized private interests may have been more or less successful in lobbying beneficial policy terms, such as Canada. The study is also insightful to emerging economies that are piloting carbon trading systems, such as Mexico, South Africa, and China.Footnote 59
For policy makers, the main lesson is that privately-shaped domestic regulations is likely to fulfill private interests at the cost of public good by perpetuating a streak of environmentally inefficient international outcomes that contribute to the revenue of a small group of firms. Fixing domestic regulations is possible and can help strengthening not only the integrity of domestic regulatory institutions but also the credibility of the international climate negotiation process. But of course, regulatory changes entail difficult decisions such as politically unfavorable subsidies or an economically intrusive role of the state. Policy-makers need to reconcile whether and in which fashion these domestic transfers are worth fulfilling.
To the international governance literature, this study provides new insights on the relations between industrial lobbies and international regulators and the synergies of international organizations and domestic politics. By showing the contexts in which international deliberation and decisions yield material benefits to domestically regulated firms, this paper suggests conditions under which private companies may be willing to support or oppose international public policy. Specifically, the article highlighted how interests participating in domestic climate policy-making are able to extract gains from international rules that are favorable to them, but potentially worse for the public.
Supplementary material
To view supplementary material for this article, please visit https://doi.org/10.1017/bap.2020.2.


