Introduction
Growth is a complex biological phenomenon in which cells increase in number and size for a given time. Genetic selection is a powerful method for genetic improvement of quail performance. It could alter some physiological relationships and metabolic processes either in growth (Farahat et al., Reference Farahat, Mahmoud, El-Komy and El-Full2018) or egg production traits (Abou Khadiga et al., Reference Abou Khadiga, Mahmoud, Farahat, Emam and El-Full2017). Growth pattern varies among individuals due to genetic background (Narinç et al., Reference Narinç, Karaman, Firat and Aksoy2010b) and sex (Ojedapo and Amao, Reference Ojedapo and Amao2014). The divergence of selected lines from controls has been found to occur immediately after hatching (Kızılkaya et al., Reference Kızılkaya, Balcıoğlu, Yolcu, Karabağ and Genc2006) and females tend to be heavier than males. Ojedapo and Amao (Reference Ojedapo and Amao2014) reported that Japanese quail did not have the same proportional growth rates, attributing this to genetics that could influence sexual dimorphism significantly. These factors suggest that different subjects need different models to properly describe their growth patterns.
Growth modelling could be a useful tool to study body weight (BW) evolution during the growth period, as it gives biological information on growth components and the effects of genetic improvement studies (Alkan et al., Reference Alkan, Narinç, Karslı, Karabağ and Balcıoğlu2012; Kaplan and Gürcan, Reference Kaplan and Gürcan2018). Non-linear mixed effects modelling of growth considers the random variation between individual growth curves (Kızılkaya et al., Reference Kızılkaya, Balcıoğlu, Yolcu, Karabağ and Genc2006), which results in a reduction in error variance (Wang and Zuidhof, Reference Wang and Zuidhof2004). The superiority of non-linear mixed models over fixed effect models for accurate prediction of BW measurements has been reported previously (Aggrey, Reference Aggrey2009; Karaman et al., Reference Karaman, Narinc, Fırat and Aksoy2013). The most common growth models used in the studies on Japanese quail are Gompertz and Richards. Both models are considered the best to fit data in terms of goodness-of-fit criteria and their biologically interpretable model parameters (Karadavut et al., Reference Karadavut, Taskin and Genc2017; Rossi et al., Reference Rossi, de Grieser, de Conselvan and Marcato2017; Kaplan and Gürcan, Reference Kaplan and Gürcan2018). Inflection point weight in these models is mostly identified as 35–40% of the asymptotic weight (Teleken et al., Reference Teleken, Galvão and da Robazza2017; Kaplan and Gürcan, Reference Kaplan and Gürcan2018).
Although several studies have been conducted on growth curves in Japanese quail, there is a lack of studies investigating gender differences in growth curves as a response to selection and whether one model can fit the data of a specific gender better than another. Therefore, the current study aims to investigate the influence of selection for BW at 4 weeks of age on growth curve parameters in two lines (selected and control) of Japanese quail through a mixed model approach according to gender. Moreover, it was aimed to compare two sigmoid models to detect which model best fits the data from each gender, separately.
Materials and methods
Birds and management
The current experiment was conducted at the farm of the Poultry Research Center, Faculty of Agriculture, Fayoum University, following its guidelines approved by the institutional animal care and use committees. After four generations of selection for BW at 4 weeks of age, the experiment was conducted to describe the growth pattern of birds in two lines (selected and control) of Japanese quail, considering the effect of gender. A total of 1400 Japanese quail (Coturnix coturnix japonica) chicks from one hatch was used in the current experiment. The birds were distributed as 700 selected and 700 control lines (350 males and 350 females in each line).
Birds were wing-banded and kept in wired cages from hatching to 6 weeks of age. All birds were kept under the same management conditions, being fed ad libitum on a starter diet containing 240 g crude protein/kg and metabolizable energy of 12.1 MJ/kg as fed basis, with free access to clean water. The lighting regime consisted of 23 h of light per day during the experiment. Each bird was weighed every 3 days from hatching to 42 days of age and BW recorded.
Statistical analysis
Data analysis was carried out using R (version 3.4.3, R Development Core Team, 2017). General linear model analysis implemented via the lsmeans package (Lenth, Reference Lenth2016) was used to estimate least squares means and their standard errors (s.e.) for BW at different ages from hatching up to 42 days of age. The general model included the effects of line (selected and control), sex (male or female) and their interaction (line × sex). The significance of the fixed effects was tested by the conditional F-tests in the single-argument form of the ANOVA for fitted model. The R package ‘easynls’ (Arnold, Reference Arnold2017) was adopted for growth curve parameters estimation and plotting using two non-linear mixed models:
(1) Gompertz model
 $$\eqalign{ Y =& \beta _0 + \beta _0({\rm sex})({\rm se}{\rm x}_{\rm i}) + u_{1i} \times {\rm Exp}[-(\beta _{1 + }\beta _1({\rm Sex})({\rm Se}{\rm x}_{\rm i})) \cr & + u_{2i}-(\beta _2t)] + e_{ij}} $$
(2) Richards model
 $$Y = \displaystyle{{\beta _0 + \beta _0({\rm sex}) + u_{1i}} \over {{(1 + {\rm Exp}[\beta _1({\rm sex}) + u_{2i}]-(\beta _2t))}^{(1/\beta _3)} + e_{ij}}}$$
where Y is the live BW of the bird at time t, t = age in days, β 0 = asymptotic BW, β 1 = scale parameter, β 2 = growth rate, β 3 = shape parameter, e ij = the residuals which were assumed to be independently and normally distributed with zero mean and variance σ 2e. Parameters were allowed to vary for each bird where the β 1 parameter was fixed for all birds, β 0 and β 2 stand for average parameters of the females in the population and sex represents the deviation of being male. The u 1i and u 2i are random bird effects on mature BW and inflection point with their variances σ 2u1 and σ 2u2, respectively. The covariance structure of the model is:
 $${\mathop{\rm var}} \left[ {\matrix{ {{\bf u}_1} \cr {{\bf u}_2} \cr e \cr}} \right] = \left[ {\matrix{ {{\bf A}\sigma^2u_1} & {{\bf A}\sigma u_1u_2} & 0 \cr {{\bf A}\sigma u_1u_2} & {{\bf A}\sigma^2u_2} & 0 \cr 0 & 0 & {{\bf I}\sigma^2e} \cr}} \right]$$
where A is the numerator relationship matrix, I is the identity matrix and σ u1u2 is the covariance between asymptotic BW and age at inflection point.
Model comparison
Models were compared according to their capability in the goodness-of-fit criteria that explain the growth of Japanese quail. The comparison criteria were determination coefficient (R 2), mean square error (MSE), Akaike information criterion (AIC, Akaike, Reference Akaike1974) and the Schwarz Bayesian information criterion (BIC, Schwarz, Reference Schwarz1978). The values of the common parameters in both models were compared according to Tukey's test. All significance tests were based on P < 0.05.
Results
Line and sex means
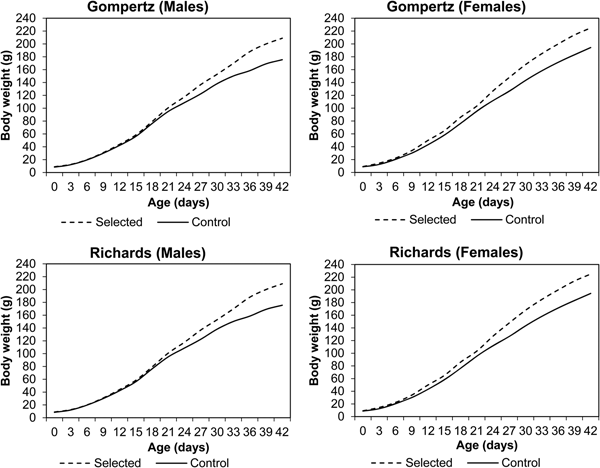
Line and sex differences in BW from hatching to 42 days of age are plotted in Fig. 1. An increasing pattern of line and sex differences was observed in the current experiment. BW of the selected line was significantly higher than the control line (P < 0.05) from the 9th day up to the end of the experimental period. Sex differences were observed after the 6th day, with live BW significantly (P < 0.05) higher in females than males in both lines at all ages. The observed growth curves of both sexes of Japanese quail within selected and control lines according to Gompertz and Richards models are presented in Fig. 2. Both females (after hatching) and males (after 12 days) from the selected line had heavier BW than those from the control line.
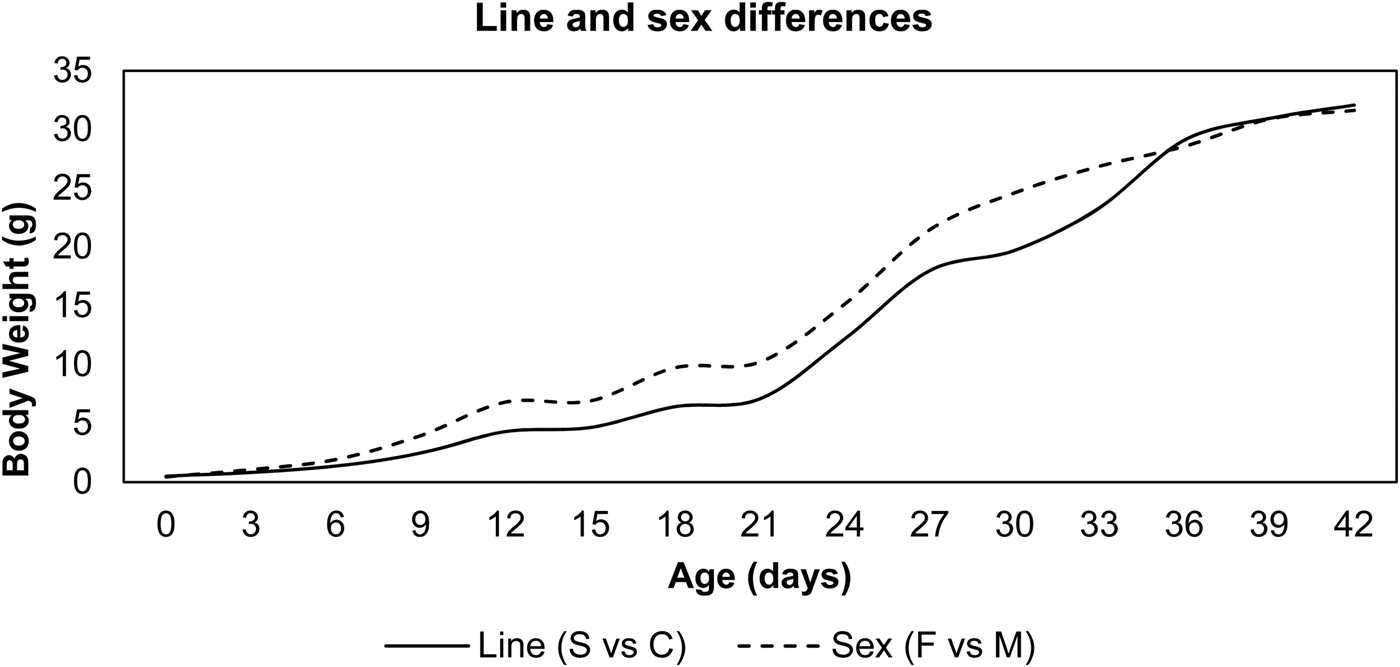
Fig. 1. Line and sex mean differences in BW from hatch to 42 days of age.
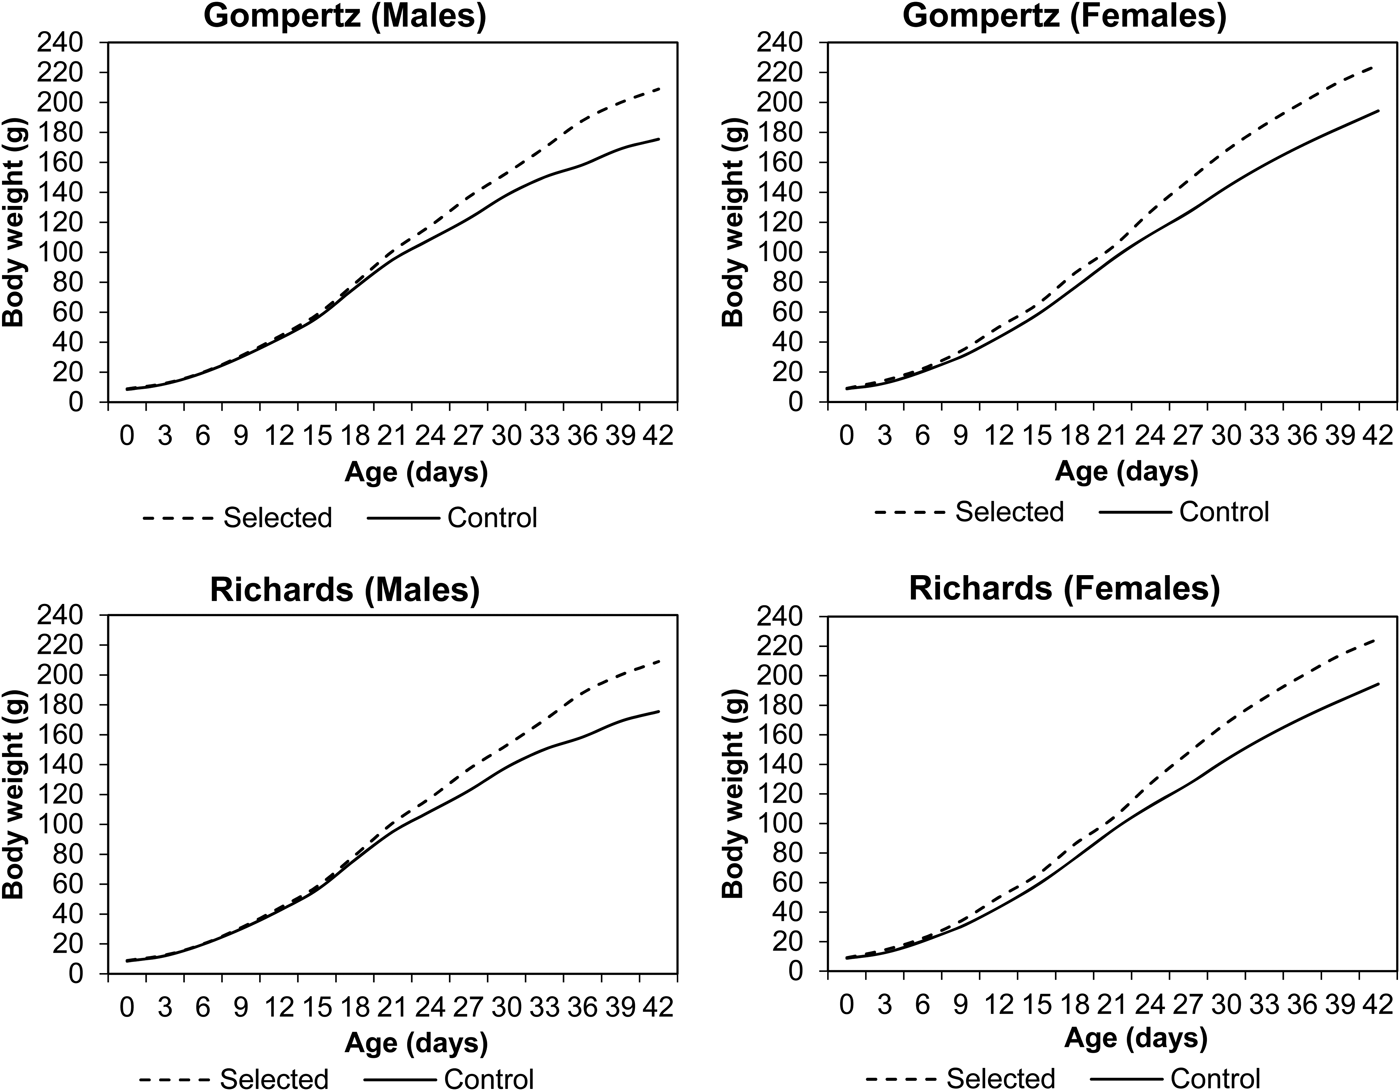
Fig. 2. Observed and predicted BW of male and female Japanese quail in selected (S) and control (C) lines according to Gompertz and Richards models.
Growth curve parameters (fixed)
Growth curve parameters of Gompertz and Richards models for the selected and control lines are presented in Tables 1 and 2, respectively. The asymptotic weight parameter (β 0) values were always higher in the Gompertz model (280 g for males and 303 g for females) than the Richards model (259 g for males and 273 g for females) in the selected line. A similar trend was observed in the control line, as β 0 values of the Gompertz model were 213 g for males and 256 g for females, while it was 199 g for males and 255 g for females under the Richards model. All differences between the two models were significant (P = 0.001) except for females of the control line (P = 0.113). In the current experiment, differences between sexes in values of β 0 in both models were observed, showing higher values for females than males.
Table 1. Growth curve parameters and model comparison criteria of the selected line (±s.e.)
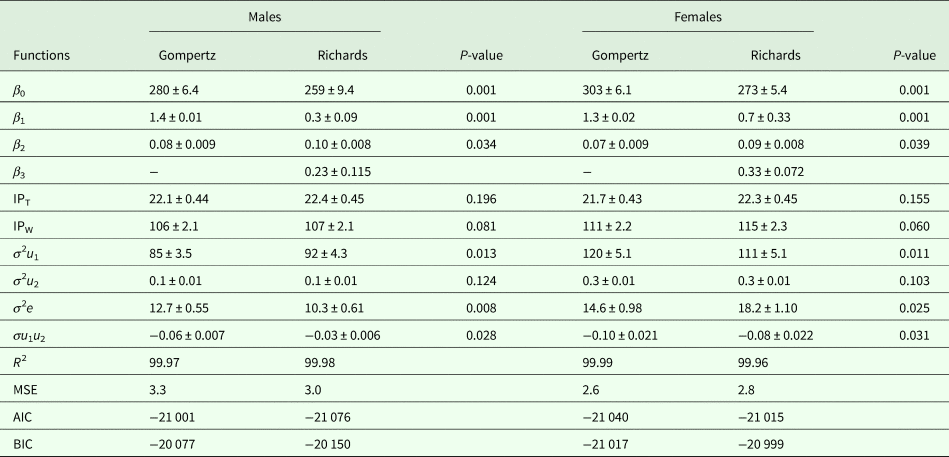
β 0, asymptote weight; β 1, scale parameter; β 2, relative growth rate; β 3, shape parameter; IPT, point of inflection time (days); IPW, point of inflection weight (g); σ 2e, residual error variance; σ 2u 1, variance of asymptotic BW; σ 2u 2, variance of the age at inflection point; σu 1u 2, covariance between asymptotic BW and age at inflection point; R 2, determination coefficient; MSE, mean square error; AIC, Akaike information criterion; BIC, Schwarz Bayesian information criterion.
Table 2. Growth curve parameters and model comparison criteria of the control line (±s.e.)
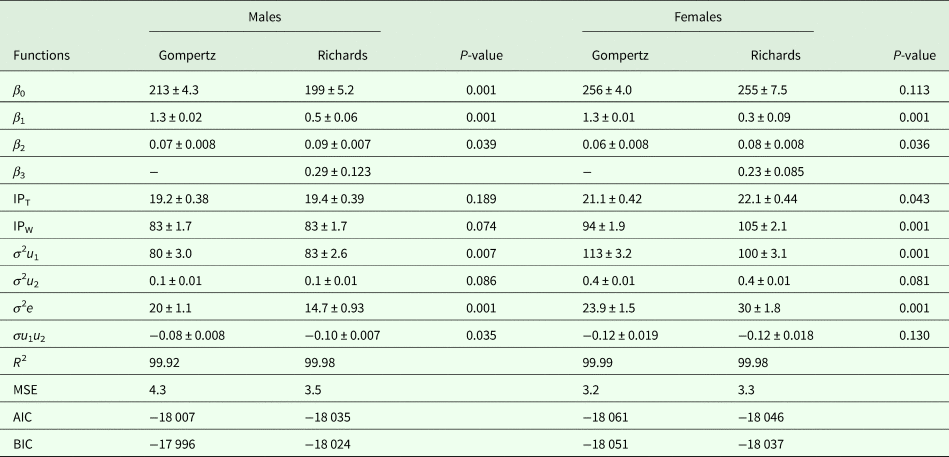
β 0, asymptote weight; β 1, scale parameter; β 2, relative growth rate; β 3, shape parameter; IPT, point of inflection time (days); IPW, point of inflection weight (g); σ 2e, residual error variance; σ 2u 1, variance of asymptotic BW; σ 2u 2, variance of the age at inflection point; σu 1u 2, covariance between asymptotic BW and age at inflection point; R 2, determination coefficient; MSE, mean square error; AIC, Akaike information criterion; BIC, Schwarz Bayesian information criterion.
Estimates of β 1 had only small differences between sexes for both lines. However, within sex, the differences between models were significant (P = 0.001). Estimates of β 1 ranged from 1.3 to 1.4 in the Gompertz model, while the range was 0.3–0.7 in the Richards model in both lines. In terms of β 2 values in the current study, there were differences between sexes in both models. The values of β 2 ranged from 0.06 to 0.10 in both models, favouring males over females in growth rate for both lines. The differences between models within sex were significant for both lines (P = 0.034–0.039). The values of β 3, the shape parameter of the Richards model, were higher in females of the selected line (0.33) than those of the control line (0.23). However, the opposite trend was observed comparing males of the selected line (0.23) to those of the control line (0.29).
The values of inflection points (age and weight) of the selected and control lines are presented in Tables 1 and 2, respectively. In the selected line, inflection points of time (IPT) for the Gompertz model were 22.1 and 21.7 days for males and females, respectively. According to the Richards model, the estimates were 22.4 and 22.3 days for males and females, respectively. However, lower IPT values were seen in the control line: under the Gompertz model these were 19.2 days for males and 21.1 days for females, and 19.4 days for males and 22.1 days for females under the Richards model. The differences between the models were not significant, except for females of the control line (P = 0.043). In the selected line, the inflection points of weight (IPW) for the Gompertz model were 106 and 111 g for males and females, respectively. The corresponding weights at the inflection points for the Richards model were slightly higher (107 g for males and 115 g for females) than for the Gompertz model. Lower weights were observed at the inflection points of both models in the control line. The IPW of the Gompertz model were 83 and 94 g for males and females, respectively. The corresponding weights at the inflection points of the Richards model were 83 and 105 g for males and females, respectively. None of the differences between the models was significant, except for females of the control line (P = 0.001).
Growth curve parameters (random)
All random part parameters were larger in females than males in both lines under both models (Tables 1 and 2). There were two sources of variation among birds due to varying asymptotic BW (σ 2u 1), variance due to differences in age at the inflection point (σ 2u 2) and the covariance among them (σu 1u 2). Between-bird variation was affected mainly by σ 2u 1 rather than σ 2u 2 and σ 2e. The variance estimates in the selected line were observed between 85 and 120, 0.1 and 0.3, 10.3 and 18.2 for σ 2u 1, σ 2u 2 and σ 2e, respectively. The corresponding estimates in the control line were 80 to 113, 0.1 to 0.4 and 14.7 to 30 for σ 2u 1, σ 2u 2 and σ 2e, respectively. Estimates of covariance (σu 1u 2) were negative and ranged from −0.10 to −0.03 in the selected line and −0.12 to −0.08 in the control line. Model differences in random part parameters were mostly significant (P = 0.001–0.035). However, differences between models in σ 2u 2 were not significant.
Goodness of fit
The goodness-of-fit criteria (R 2, MSE, AIC and BIC), estimated using Gompertz and Richards growth models for the selected and control lines, are shown in Tables 1 and 2, respectively. Due to the differences in BW between the sexes at most of the studied ages, comparison of the models was carried out separately for both sexes. The R 2 values of both growth models were high and similar (close to 1). The values of MSE, AIC and BIC ranges for the selected line were 2.6 to 3.3, −21 076 to −21 001 and −21 017 to −20 077, respectively. The parallel estimates in the control line varied between 3.2 and 4.3, −18 061 and −18 007 and −18 051 and −17 996 for MSE, AIC and BIC, respectively.
Discussion
Line and sex means
In the current study, the impact of selection and gender on growth curve parameters was investigated. The growth patterns differed between the sexes; therefore, data were analysed separately for each sex. Differences between lines with different genetic backgrounds were found in the literature (Sezer and Tarhan, Reference Sezer and Tarhan2005; Hyánková and Knížetová, Reference Hyánková and Knížetová2009). Selection effect as a modification in BW at hatching and in the pattern of growth was different between the sexes (Aggrey et al., Reference Aggrey, Ankra-Badu and Marks2003). Hussen et al. (Reference Hussen, Abdulrahman Al-Khdri and Hassan2016) reported a higher response to selection in males than females (7.06 v. 4.87%). Previous studies also have shown that Japanese quail exhibit sexual dimorphism in live BW (Aggrey et al., Reference Aggrey, Ankra-Badu and Marks2003; Sezer and Tarhan, Reference Sezer and Tarhan2005; Gürcan et al., Reference Gürcan, Çobanoğlu and Kaplan2017; Kaplan and Gürcan, Reference Kaplan and Gürcan2018). Kızılkaya et al. (Reference Kızılkaya, Balcıoğlu, Yolcu, Karabağ and Genc2006) reported a significant interaction effect on asymptotic weight in Japanese quail.
Growth curve parameters (fixed)
Growth curve parameters were estimated to describe the growth patterns, quantifying the differences between lines and sexes within a line. The values of the asymptotic weight (β 0) were always higher in the selected than the control line across models and sexes. Higher β 0 was found in the Gompertz compared with the Richards model, in agreement with the results of Akbaş and Oğuz (Reference Akbaş and Oğuz1998), who reported a higher β 0 value of the Gompertz model for the selected line (239.5 g) than the control line (208.3 g). The effect of selection to increase live weight in Japanese quail on β 0 was clear in the current study through the differences between selected and control lines. The differences between lines in β 0 values in the current study, as in previous studies (Kızılkaya et al., Reference Kızılkaya, Balcıoğlu, Yolcu, Karabağ and Genc2006; Alkan et al., Reference Alkan, Mendeş, Karabağ and Balcıoğlu2009; Narinç and Aksoy, Reference Narinç and Aksoy2014), could be evidence of the effect of genetic background on the growth curve parameters of Japanese quail. Kızılkaya et al. (Reference Kızılkaya, Balcıoğlu, Yolcu, Karabağ and Genc2006) reported significant differences in values of β 0 between selected and control lines. The current results could confirm the expectation of breeding programme influence on growth curves and their parameters in Japanese quail (Narinç et al., Reference Narinç, Karaman, Firat and Aksoy2010b).
Alkan et al. (Reference Alkan, Narinç, Karslı, Karabağ and Balcıoğlu2012) found significant differences between sexes in terms of β 0, favouring females rather than males. Karaman et al. (Reference Karaman, Narinc, Fırat and Aksoy2013) confirmed this finding by reporting sex differences in β 0 of 24% favouring females over males of Japanese quail. Similar significant differences in β 0 favouring females over males of Japanese quail, regardless of genetic group have also been reported by Rossi et al. (Reference Rossi, de Grieser, de Conselvan and Marcato2017). Sex differences in growth rate have also been reported in selected and unselected lines of Japanese quail (Aggrey et al., Reference Aggrey, Ankra-Badu and Marks2003; Kızılkaya et al., Reference Kızılkaya, Balcıoğlu, Yolcu and Karabağ2005). Kızılkaya et al. (Reference Kızılkaya, Balcıoğlu, Yolcu, Karabağ and Genc2006) reported higher differences in females (291.78 v. 218.51) than males (228.21 v. 177.12) of selected and control lines, respectively.
Estimates of β 1 in the current study are lower than those of Narinç et al. (Reference Narinç, Aksoy and Karaman2010a, Reference Narinç, Karaman, Firat and Aksoy2010b) and Alkan et al. (Reference Alkan, Narinç, Karslı, Karabağ and Balcıoğlu2012). Small differences between sexes in terms of β 1 implied the similarity of both sexes in integration coefficient in the current study under the same model. As the β 1 parameter is a biological constant related to weight development, it can be influenced by selection programmes for changing BW at or near maturation. Alkan et al. (Reference Alkan, Narinç, Karslı, Karabağ and Balcıoğlu2012) found insignificant difference among different lines in the β 1 parameter but detected significant differences between sexes. Karaman et al. (Reference Karaman, Narinc, Fırat and Aksoy2013) reported no distinction between sexes in the estimates of β 1 under a logistic model.
In both Gompertz and Richards models, the β 2 parameter represents the maturation rate, indicating the growth speed in achieving the asymptotic weight from initial weight. Higher values mean the animal reaches its asymptotic weight faster (Del Garnero et al., Reference Del Garnero, Marcondes, Bezerra, Oliveira and Lôbo2005). This could be an indicator of the faster growth of males than females to reach their weight at the point of inflection and asymptotic weight at a younger age. Similar results for sex difference and the effect of sex in selection experiments for BW in Japanese quail have been reported by others (Akbaş and Oğuz, Reference Akbaş and Oğuz1998; Kızılkaya et al., Reference Kızılkaya, Balcıoğlu, Yolcu, Karabağ and Genc2006). Karaman et al. (Reference Karaman, Narinc, Fırat and Aksoy2013) reported 25% higher β 2 in males than females, and Rossi et al. (Reference Rossi, de Grieser, de Conselvan and Marcato2017) found significant differences in β 2 values between males (0.080) and females (0.059). Aggrey et al. (Reference Aggrey, Ankra-Badu and Marks2003) reported that selection for increasing BW at 4 weeks of age resulted in an increase in the growth rate parameter (β 2) in females but not in males of three lines using the Richards model: they observed that the shape value (β 3) for females from all lines tested were close to one, which means that the Richards model is equivalent to the Gompertz model. Thus, they suggested that females were following the Gompertz model due to the shape value (β 3) of the Richards model in their experiment. In addition, they concluded that selection did not change the shape of the growth curve in females. Kaplan and Gürcan (Reference Kaplan and Gürcan2018) reported similar conclusions for the selection impact on the shape of the growth curve in Japanese quail.
When the inflection points (weight and age) are reached later, higher growth rates are observed for longer periods, which could differ from one group of animals to another. Alkan et al. (Reference Alkan, Narinç, Karslı, Karabağ and Balcıoğlu2012) reported higher IPW averages in female than male quails. The values of the inflection points in the current study are comparable to those estimated by Rossi et al. (Reference Rossi, de Grieser, de Conselvan and Marcato2017) and Kaplan and Gürcan (Reference Kaplan and Gürcan2018). In non-selected lines (Aggrey et al., Reference Aggrey, Ankra-Badu and Marks2003; Gürcan et al., Reference Gürcan, Çobanoğlu and Kaplan2017), lower inflection points were reported for IPT of the Richards model (16.38 to 17.08 days), while IPW was 69.74 g of the Gompertz model. Teleken et al. (Reference Teleken, Galvão and da Robazza2017) observed that for most datasets studied of birds and mammals, including brown and white lines of Japanese quail, the males reached mature weight before the females. In the current study, line effect was clear in this parameter, as IPT values were higher in the selected than control line. Consequently, IPW values were higher in the selected line in both sexes, reflecting the impact of selection on these parameters. Similar results were reported by Kaplan and Gürcan (Reference Kaplan and Gürcan2018). However, other studies (Akbaş and Oğuz, Reference Akbaş and Oğuz1998; Kızılkaya et al., Reference Kızılkaya, Balcıoğlu, Yolcu and Karabağ2005; Alkan et al., Reference Alkan, Mendeş, Karabağ and Balcıoğlu2009) reported lower values (15.68 to 20.20 days and 76.62 to 113 g, respectively) for age and weight at the inflection point using the Gompertz and Richards models in selected and unselected quail lines. The differences between the current results and others could be due to the genetic background and environmental conditions of the experiment. Hyánková and Knížetová (Reference Hyánková and Knížetová2009) indicated a maximum line difference at IPT across genders as a result of selection for the shape of the growth curve and constant adult BW.
Growth curve parameters (random)
Effects of line and sex on parameters of the random part of the mixed model analysis are important in the current study. The current results of the sex effects were similar to those of Aggrey (Reference Aggrey2009) and Karaman et al. (Reference Karaman, Narinc, Fırat and Aksoy2013). Aggrey (Reference Aggrey2009) recommended a similar non-linear mixed model as the best compared with fixed and non-linear with one random effect models in terms of fitting the data. The superiority of such a model was attributed to several reasons: one is the ability of the model to distinguish between the within-bird and between-bird variations. Another is the observed decline of the residual variance by incorporating two random effects in the model compared with the simpler models. In comparison to fixed models, the non-linear mixed model approach and flexible structure models could lead to better prediction of BW at different ages (Aggrey, Reference Aggrey2009; Karaman et al., Reference Karaman, Narinc, Fırat and Aksoy2013; Gürcan et al., Reference Gürcan, Çobanoğlu and Kaplan2017).
Goodness of fit
Compared with mammals, the growth of poultry species was found to be best described by the Gompertz model followed by the Richards model in all non-linear models. Although the Richards model exhibited higher R 2 than the three parameter models, the two criteria based on information theory, AIC and BIC, indicated that the Gompertz model was best for chickens (Teleken et al., Reference Teleken, Galvão and da Robazza2017). In the current study, high R 2 values of both growth models (close to 1) indicate the suitability of the models for describing growth curves of Japanese quail. Similar high values have been reported in previous studies (Narinç et al., Reference Narinç, Aksoy and Karaman2010a; Karadavut et al., Reference Karadavut, Taskin and Genc2017; Kaplan and Gürcan, Reference Kaplan and Gürcan2018). Significant differences between the models for most of the growth curve parameters indicated the peculiarity of each data set and the different potentiality of each model to describe the growth data of each group.
According to the criteria of choice (the highest R 2 and the lowest MSE, AIC and BIC), the Richards growth curve was found to be the best fitting model to the growth data of male quails in both selected and control lines. However, the Gompertz model was the best fit for growth data of female quails in both lines. Several studies (Akbaş and Oğuz, Reference Akbaş and Oğuz1998; Narinç et al., Reference Narinç, Aksoy and Karaman2010a; Rossi et al., Reference Rossi, de Grieser, de Conselvan and Marcato2017) reported that the Gompertz model best fits the growth data of Japanese quail. On the other hand, Beiki et al. (Reference Beiki, Pakdel, Moradi-Shahrbabak and Mehrban2013) found that the Richards model was better than other models in fitting growth data of Japanese quail in both sexes. Kaplan and Gürcan (Reference Kaplan and Gürcan2018) suggested the Gompertz model as the second best, after the Richards model, for fitting growth data of Japanese quail.
Conclusions
From the current results it is clear that selection programmes could influence and alter the growth curves and their parameters. Moreover, sexual dimorphism seemed to be present in describing the growth curves of Japanese quail. The Richards model was better for describing the growth pattern of males, while the Gompertz model was better for female data. It is recommended to apply the most suitable model for data sets of each sex for better prediction of BW at later ages.
Author ORCIDs
G. Abou Khadiga, 0000-0001-8764-8456.
Financial support
This research received no specific grant from any funding agency, commercial or not-for-profit sectors.
Conflict of interest
The authors declared that there is no conflict of interest.
Ethical standards
The current experiment was conducted at the farm of the Poultry Research Center, Faculty of Agriculture, Fayoum University, following its guidelines approved by the institutional animal care and use committees.


