Goat milk and derivative products are considered high-quality products by the dairy industry because of their biochemical, nutritional and organoleptic characteristics. Goat milk is considered a healthy food and its consumption has positive influence on Fe metabolism (Nestares et al. Reference Nestares, Barrionuevo, Díaz-Castro, Lopez-Aliaga, Alférez and Campos2008a, Reference Nestares, Díaz-Castro, Alférez, López-Aliaga, Barrionuevo and Camposb), bone turnover (Díaz-Castro et al. Reference Díaz-Castro, Ramírez, Campos, López-Frías, Alférez, Nestares, Ortega and Lopez-Aliaga2011c) and enzymatic antioxidant defence (Díaz-Castro et al. Reference Díaz-Castro, Alférez, López-Aliaga, Nestares, Granados, Barrionuevo and Campos2008). In addition, the characteristics of goat milk components allow production of highly priced dairy products, such as cheeses, yogurts, and a wide variety of other fermented products (Scatamburlo et al. Reference Scatamburlo, Yamazi, Cavicchioli, Pieri and Nero2015).
Beyond the simple nutritional value of milk compounds, other components in fermented milks (glycoproteins, antibodies and oligosaccharides), may have a key role in reducing the number of pathogen infections and promoting the development of the intestinal epithelium. Although fermented milk products are better preserved than fresh milk, they are nevertheless prone to deterioration by spoilage microorganisms. Several authors have tried to extend the shelf life of fermented milks using different preservation treatments such as pasteurisation (Guldas & Atamer, Reference Guldas and Atamer1995), addition of chemical and bio-preservatives (Von Staszewskia & Jagusa, Reference Von Staszewskia and Jagusa2008), effective packaging (Patidar & Prajapati, Reference Patidar and Prajapati1998), gas flushing (Rosenthal et al. Reference Rosenthal, Rosen and Popel1991), high pressure technology (Walker et al. Reference Walker, Farkas, Loveridge and Meunier-Goddik2006), irradiation (Mainville et al. Reference Mainville, Montpetit, Durand and Farnworth2001) and the combination of two or more of these treatments (Lacroix & Lahance, Reference Lacroix and Lahance1990).
Modern socio-economic changes mean that some traditional technologies for the production of fermented foods might eventually be lost due to the high cost and the difficulty of delivery and preservation of these dairy products (Akabanda et al. Reference Akabanda, Owusu-Kwarteng, Tano-Debra and Glover2013). In the current study we propose a method to extend the shelf-life of two fermented milks: a mild heat treatment below pasteurisation temperature, at 50 °C. This will remove most of the water present in the matrix, leaving a dehydrated product that does not need refrigeration, and which has a low moisture content and is, therefore, economically suitable for transportation and delivery.
The composition of the fermented milks depends on the breed, lactation state, feeding and other environmental conditions; moreover, the values recorded may be affected by the methodology used (Sanz Ceballos et al. Reference Sanz Ceballos, Ramos Morales, De la Torre Adarve, Díaz-Castro, Pérez Martínez and Sanz Sampelayo2009). Thus, in the current study we present the results obtained concerning the composition of two dehydrated fermented milks using the same methodology. We measured the protein composition, amino acid profile, fat composition, fatty acid profile, mineral and vitamins composition in addition to the chemical composition (protein, fat, ash and lactose) in cow and goat dehydrated fermented milk.
Materials and methods
Experimental design and procedure
The fermented milk samples analysed in the current study were obtained from two different farms, one with Murciano-Granadina goats and the other with Holstein Friesian cows. Both farms are located in the same area of southeastern Spain, at 694 m above sea level, with a continental Mediterranean climate. The duration of the assay corresponded to that of two consecutive lactations, taking 17 samples in total during each lactation period. From the start of lactation, both species were kept under intensive feeding conditions, they were indoor-fed ad libitum, with a concentrate and a forage and fresh tap water was always available. They were kept under identical environmental conditions except as concerns the nature and composition of the diet, which in each case was designed in accordance with the nutritional requirements and productive capacity of the species (National Research Council, 2007). The forage fraction of the diets was constituted of alfalfa hay (for the goats) and corn silage + alfalfa hay (for the cows) (Sanz Ceballos et al. Reference Sanz Ceballos, Ramos Morales, De la Torre Adarve, Díaz-Castro, Pérez Martínez and Sanz Sampelayo2009). The health condition of the animals was supervised continuously, and any animal presenting any sign of disease was immediately removed from the study. Milk samples, without added preservatives, were immediately stored at −80 °C until fermentation (within 1 week). Analyses were carried out in triplicate.
Fermentation of the milks
To prepare the fermented milks, raw cow and goat milk was pasteurised at 77 °C for 15 min and cooled to room temperature (25 °C). The milk samples were transferred to sterile Schott flasks inside a laminar flow chamber, and stored at 4 °C for 24 h before use. Subsequently, both milks types were inoculated with traditional yoghurt starters Lactobacillus bulgaricus sub. delbruickii and Streptococcus thermophiles (initial concentration of 1 × 10¹¹ cfu/ml; 1% inoculum) and incubated at 37 °C for approximately 24 h. At the end of fermentation, the fermented milks were cooled to 15 °C in an ice bath, and the clot was broken up with a stainless steel perforated disk with up and down movements for approximately 1 min. The fermented milk samples were evaluated for pH using digital pH meter (Crison, Barcelona, Spain) and the fermentation process ended when the milks reached pH = 4·6. All the experiments were carried out in triplicates.
Dehydration of the fermented milk
Fermented milk samples were subjected to a smooth industrial dehydration process in an air tunnel with internal heaters mounted to the air in independent chamber that allow obtain a uniform distribution of the temperature and a rapid stabilisation. In this device, an internal engine turbine with air flow improved the process of dehydration. The fermented milks were dehydrated in a forced-air tunnel (Conterm Selecta, Barcelona, Spain) at 50 ± 3 °C for 24 h, until the final moisture ranges between 2·5 and 4·5%. These conditions avoid the loss of nutritional properties of the fermented milks.
Total nitrogen, dry matter, ash, total fat and lactose content
The N content was measured using the Kjeldahl method (AOAC, 2005). Protein N content was calculated as the difference between total N and non-protein N. Protein, casein and whey-protein N values were converted to protein, casein and whey-protein by multiplying by a factor of 6·38. Dry matter, ash and total fat were determined according to the methods described by AOAC (1995). Milk lactose was calculated as the difference between the amount of total solids and protein + fat + total ash. The ash content was determined by incineration in an electric muffle furnace at 550 °C.
Amino acid composition
The dehydrated fermented milks were suspended in water such that the concentration was approximately 7 g powder/100 ml. Amounts of 1·28 ml of fermented goat milk and 1·21 ml of fermented cow milk (such that there was an equal amount of protein from each sample) were each aliquoted in duplicate into two series of hydrolysis tubes. One series underwent analysis for the ‘acid-stable’ amino acids and the other underwent analysis for the sulphur amino acids. The tubes used to determine the ‘acid-stable’ amino acids had 1 ml of 6 m HCl containing 0·1% phenol added before being degassed under vacuum (using a vacuum pump) and sealed. After hydrolysis, the tubes were cracked open and norleucine added as an internal standard before being dried down again. Once dry, the amino acids were dissolved by the addition of loading buffer (67 mm sodium citrate, pH 2·2, containing 0·1% (w/v) phenol) before being analysed using a Waters ion-exchange high-performance liquid chromatography system (Waters Corporation, Milford, MA, USA), utilising post-column ninhydrin derivatisation and detection using absorbance at 570 nm (440 nm for proline). The tubes used to determine the sulphur amino acids were treated with performic acid prior to hydrolysis to quantitatively oxidise the cysteine and methionine to the more stable compounds, cysteic acid and methionine sulphone. They were firstly cooled in ice, before 1 ml ice-cold performic acid (9 : 1 ratio of 88% formic acid:30% hydrogen peroxide) was added. The tubes were then incubated on ice in a refrigerator for 16 h. After incubation, 0·15 ml hydrogen bromide was added to the tubes, which were then dried down. Once dry, the tubes underwent acid hydrolysis as described above.
Fatty acids composition
Fatty acid methyl esters were prepared by base-catalyzed methanolysis of the glycerides (KOH in methanol) according to ISO-IDF procedure (ISO-IDF, 2002). Analysis of fatty acid methyl esters with gas chromatography with a flame ionisation detector (GC-FID) was performed on a gas-liquid chromatograph (Agilent 6890 N network system) with an autoinjector. Fatty acid methyl esters profile was determined by split injection (1 : 100) on a CP-Sil 88 fused silica capillary column (100 m × 0·25 mm with 0·20 µm film; Varian, Middelburg, The Netherlands) using a gradient temperature programme. Initial oven temperature was 160 °C. After 80 min, oven temperature was raised at 10 °C/min to 210 °C and then held for 35 min. Helium was the carrier gas, and the injector and detector were at 250 °C.
Mineral analysis
Multielemental analysis by inductively coupled plasma-optical emission spectrometer (ICP-OES) (Perkin-Elmer Optima 8300, Perkin-Elmer, Shelton, CT) was performed to measure Ca, P, Mg, Zn, K, Fe, Cu, Se and I. The fermented milk samples were previously mineralised by wet method in a sand bath (J.R. Selecta, Barcelona, Spain); the samples were placed in a resistant flask and dissolved using nitric acid followed by a mixture of HNO3:HClO4 (69%:70%, v/v; Merck KGaA, Darmstadt, Germany; ratio 1 : 4, v/v) until the total elimination of organic matter. All fermented milk sample analysis was undertaken using an Optima 8300 (PerkinElmer Inc. Waltham, USA) with a segmented-array charge-coupled Device (SCD) high-performance detector. The elements Ca, Mg, Zn, K, Fe, Cu, Se and I were not all measured in the same analysis, because elements can all react differently in certain acid solutions or in certain inductively coupled plasma conditions and so compatible elements were analysed together under an optimised set of conditions. For the calibration of the apparatus, multielemental Astasol calibration solutions (Analytika, Khodlova, Prague) were used.
Phosphorus concentration
The concentrations of P were analysed by visible spectrophotometry (Perkin-Elmer UV/VIS spectrometer lambda 16) using the Fiske–Subbarow technique (Fiske & Subbarow, Reference Fiske and Subbarow1925).
Vitamin composition
Vitamin A, vitamin E, vitamin B6, vitamin B12 and vitamin C were determined in a HPLC system (Hewlett-Packard, Waldbronn, Germany) that consisted of an HP 1050 series degassing device, an HP 1100 (for water-soluble analysis), or a Waters 717 (for liposoluble analysis) (Waters, Milford, Mass.) autosampler, both with 20 ml fixed loop injector, and a variable wavelength HP 1050 series UV detector. Data acquisition was accomplished by a Chemstation system HP 3365-II (Hewlett-Packard). The separation was performed by using a Tracer Spherisorb ODS2 C18 (TR-011019) reversed phase column 250 × 4·6 mm, particle diameter 5 mm (Teknokroma, Barcelona, Spain), with a matching guard cartridge. Both analyses were carried out isocratically at a flow-rate of 1 ml/min. Water-soluble vitamins were determined from 10 g of dehydrated fermented milks with 10 ml of Milli-Q water. The mobile phase used in the HPLC contained 5 mm octanesulfonic acid (ion pairing reagent), 0·5% triethylamine, 2·4% glacial acetic acid, and 15% of methanol in Milli-Q water. Vitamin A and vitamin E were determined from 15 g of dehydrated fermented milks dissolved with 100 ml of Milli-Q water and saponified overnight using absolute ethanol, potassium hydroxide solution, and ascorbic acid as an antioxidant. The samples were extracted with n-hexane, and butylated hydroxytoluene (BHT) was added as an antioxidant, then evaporated and redissolved in methanol. The extracts were injected into the HPLC system. Water-acetonitrile-methanol (4 : 1 : 95, v/v/v) was used as the mobile phase.
Folic acid was determined in a HPLC system (Hewlett-Packard, Waldbronn, Germany) coupled to a Quattro Ultima tandem mass detector (Waters-Micromass, Manchester, UK). The HPLC system was equipped with a 150 × 3 mm, 5 mm XBridge C18 column (Waters, Milford, PA) kept at 40 °C. A binary gradient mobile phase was used at a flow rate of 0·4 ml/min with solvent A (0·1% acetic acid in water) and solvent B (0·1% acetic acid in methanol). The gradient started isocratically for 0·5 min at 10% B, followed by a linear increase to 100% B in 4·5 min. After an isocratic hold at 100% B for 5·9 min, the gradient returned to 10% B in 0·1 min for equilibration of the column for 3 min. The mass spectrometer was operated in electrospray negative mode, and data acquisition was in multiple reaction-monitoring mode. Argon was used as collision gas at 3·2 × 10−3 mbar and the multiplier was operated at 750 V.
Statistical analysis
Prior to perform any statistical analysis, all variables were checked to assess the equality of variances (homogeneity of variance) using the Levene's test. One-way ANOVA was applied to the different parameters in accordance with the general linear model procedure (Steel & Torrie, Reference Steel and Torrie1984). The level of significance was set at P < 0·05. Statistical analyses were performed using SPSS version 22·0, 2014 (SPSS Inc., Chicago, IL, USA) software. The model accounts for variation caused by the species. The tables describe the mean values, residual standard deviations (square root of the mean square errors) and the level of significance of the effects.
Results
Chemical composition
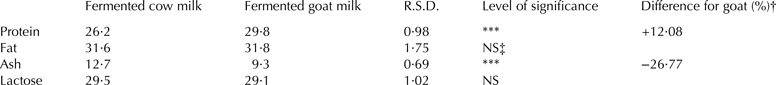
Table 1 shows the chemical composition of the two dehydrated fermented milks. Fermented goat milk had a higher content of protein (P < 0·001), lower ash content (P < 0·001) and similar values of fat and lactose with respect to the fermented cow milk.
Table 1. Chemical composition (%) of dehydrated fermented cow milk (n = 34) and dehydrated fermented goat milk (n = 34)

R.S.D., Residual standard deviation
† Difference (%) for goat milk = [(dehydrated fermented goat milk mean − dehydrated fermented cow milk value)/dehydrated fermented goat milk value] × 100
‡ NS = P > 0·05
***P < 0·001
Amino acid composition
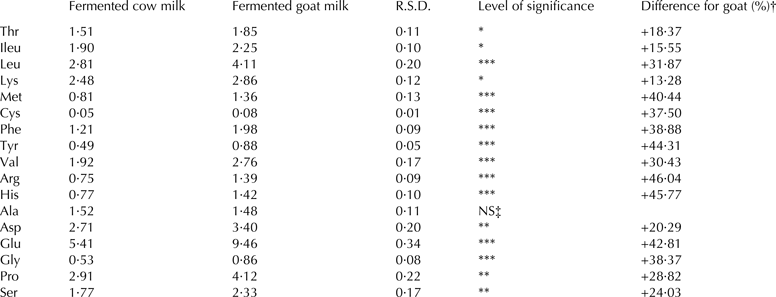
The amino acid composition is summarised in Table 2. In the current study, we have recorded that except for the Ala, in which the differences were not statistically significant, all other amino acids were higher in fermented goat milk than in fermented cow milk between 13 and 46% (P < 0·05 for Thr, Ileu and Lys; P < 0·01 for Pro and Ser; P < 0·001 for Leu, Met, Cys, Phe, Tyr, Val, Arg, His, Asp, Glu and Gly).
Table 2. Amino acid composition (g/100 g amino acids) of fermented cow milk (n = 34) and fermented goat milk (n = 34)
R.S.D., Residual standard deviation
† Difference for dehydrated fermented goat milk (%) = [(dehydrated fermented goat milk mean − dehydrated fermented cow milk value)/dehydrated fermented goat milk value] × 100
‡ NS = P > 0·05
*P < 0·05; **P < 0·01; ***P < 0·001
Fatty acid composition
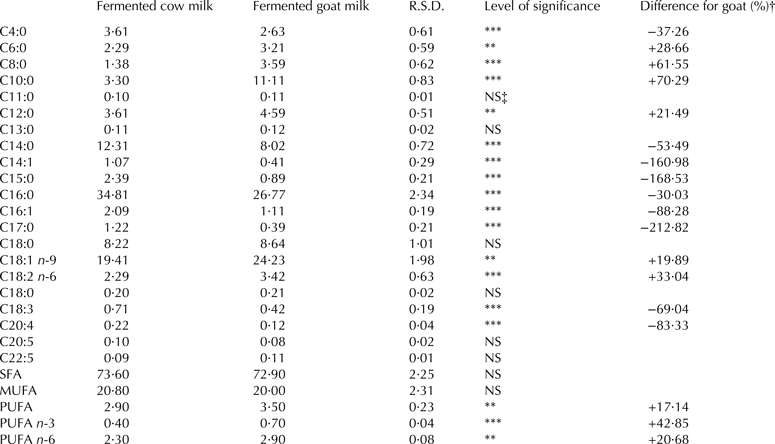
Table 3 shows the fatty acid profile of cow and goat dehydrated fermented milk fat (g/100 g total fatty acids). Except for the values for C11:0, C13:0, C16:0, C18:0, C20:5, C22:5, and the total quantity of saturated and monounsaturated fatty acids, all the other fatty acid studied were significantly different (P < 0·05) in both fermented milks. C4:0, C14:0, C14:1, C15:0, C16:0, C16:1, C17:0, C18:3 and C20:4 were significantly lower in fermented goat milk compared with fermented cow milk (P < 0·001). In contrast, all the other fatty acids studied were higher in goat milk compared with cow milk (P < 0·001 for C8:0, C10:0, C18:2 n-6 and PUFA n-3; P < 0·01 for C6:0, C18:1 n-9, PUFA and PUFA n-6)
Table 3. Fatty acid composition (g/100 g total fatty acids) of fermented cow milk (n = 34) and fermented goat milk (n = 34)
R.S.D., Residual standard deviation
† Difference for dehydrated fermented goat milk (%) = [(dehydrated fermented goat milk mean − dehydrated fermented cow milk value)/dehydrated fermented goat milk value] × 100
‡ NS = P > 0·05
**P < 0·01; ***P < 0·001
Mineral and vitamin composition
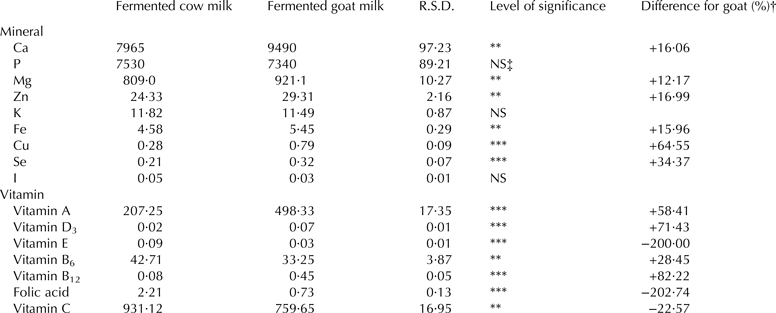
Mineral and vitamin composition are shown in Table 4. Except for K, P and I in which no statistical differences were recorded (P > 0·05), all other minerals studied were higher in fermented goat milk compared with fermented cow milk (P < 0·01 for Ca, Mg, Zn and Fe concentration; P < 0·001 for Cu and Se).
Table 4. Mineral composition (mg/kg) and vitamin composition (μg/100 g) of dehydrated fermented cow milk (n = 34) and dehydrated fermented goat milk (n = 34)
R.S.D., Residual standard deviation
† Difference for dehydrated fermented goat milk (%) = [(dehydrated fermented goat milk mean − dehydrated fermented cow milk value)/dehydrated fermented goat milk value] × 100
‡ NS = P > 0·05
**P < 0·01; ***P < 0·001
In relation to vitamin composition, fermented goat milk had lower amounts of vitamin C (P < 0·01), folic acid and vitamin E (P < 0·001) and higher values of vitamin B6 (P < 0·01), vitamin A, vitamin B12 and vitamin D3 (P < 0·001).
Discussion
Although the basic composition of both fermented milks is similar, both have specific characteristics that have a potential impact on the consumer in terms of both nutrition and health protection.
The protein composition of goat milk has been examined by a number of researchers (D'Urso, Reference D'Urso2000; Roncada et al. Reference Roncada, Gaviraghi, Liberatori, Canas, Bini and Greppi2002), but they have been mainly focused on the relationship between the levels of different milk proteins and the possible allergenic response (Roncada et al. Reference Roncada, Gaviraghi, Liberatori, Canas, Bini and Greppi2002). Some studies have been conducted examining the amino acid composition of casein in goat milk in relation to the lactation stage (Singh & Singh, Reference Singh and Singh1985) and the composition of whole goat milk in comparison with other mammalian milks (Sanz Ceballos et al. Reference Sanz Ceballos, Ramos Morales, De la Torre Adarve, Díaz-Castro, Pérez Martínez and Sanz Sampelayo2009). However, to date scarce information is available about the protein composition of fermented goat and cow milk, despite the fact that is interesting from a nutritional point of view. It has been previously reported that the amount of total solids in goat milk is normally higher than that in cow milk (Sanz Ceballos et al. Reference Sanz Ceballos, Ramos Morales, De la Torre Adarve, Díaz-Castro, Pérez Martínez and Sanz Sampelayo2009). These results are in agreement with those found in the current study in which protein is higher in fermented goat milk. Maerere et al. (Reference Maerere, Kimbi and Nonga2001) reported that goats absorbed N more efficiently than cows, with lower faeces excretion and higher retention, therefore we hypothesise that this increase in the N absorptive capacity will explain the higher protein content in fermented goat milk, observed in the current study. The amino acid composition differs in both fermented milks. The fermented goat milk had higher content of any given amino acid than the fermented cow milk, in agreement with the data previously reported by Sanz Ceballos et al. (Reference Sanz Ceballos, Ramos Morales, De la Torre Adarve, Díaz-Castro, Pérez Martínez and Sanz Sampelayo2009) in non-fermented milks. The most abundant amino acid in fermented goat milk was Glu (42·81% higher in fermented goat milk respect cow milk), in agreement with the reports of Tripaldi et al. (Reference Tripaldi, Martillotti and Terramoccia1998) for fresh goat milk. This is very similar to the pattern in human milk, in which also one of the most abundant free amino acid is Glu (Agostoni et al. Reference Agostoni, Carratu, Boniglia, Riva and Sanzini2000; Chuang et al. Reference Chuang, Lin, Lee, Wang, Shih, Huang and Yeung2005).
With respect to the fatty acid profile from both types of fermented milks, there are several interesting aspects to highlight. Lauric acid (C12:0) was 21·49% higher in fermented goat milk compared with fermented cow milk. This is interesting from a food technology point of view, as lauric acid is known to have antibacterial activity and antiviral activities (Shobharani & Agrawal, Reference Shobharani and Agrawal2009), and this could help to increase the shelf-life of this dehydrated fermented product. Oleic acid (C18:1) was higher in fermented goat milk and it is well known that oleic acid lowers total plasma cholesterol, LDL-cholesterol and triglycerides, and has a potential role preventing cardiac dysfunction and failure (Drosatos & Schulze, Reference Drosatos and Schulze2014). Linoleic acid (C18:2) was also higher in fermented goat milk and the presence of this fatty acid has been also reported to reduce total cholesterol, protect against ischaemic stroke and exert positive effects in reducing heart disease (Farvid et al. Reference Farvid, Ding, Pan, Sun, Chiuve, Steffen, Willett and Hu2014). Myristic acid (C14:0) and palmitic acid (C16:0) were higher in fermented cow milk in comparison with fermented goat milk. These two fatty acids are associated with raising total cholesterol levels in plasma, and have pro-apoptotic properties in cardiomyocytes, increasing the risk of cardiovascular disease (Sparagna et al. Reference Sparagna, Hickson-Bick, Buja and McMillin2001; Miller et al. Reference Miller, LeBrasseur, Cote, Trucillo, Pimentel, Ido, Ruderman and Sawyer2005). C15:0 and C17:0 were much lower in fermented goat milk and according to Annous et al. (Reference Annous, Becker, Bayles, Labeda and Wilkinson1997). These fatty acids have critical roles in maintaining growth of Lysteria monocytogenes at cold temperatures, so the lower content is another positive attribute.
With regard to mineral content of fermented milks, except for P, K and I in which no differences were recorded, mineral content was higher in fermented goat milk, a fact that may influence positively the growth of probiotic bacteria, since they act as cofactors in the enzymatic complexes of lactose fermentation (Slacanac et al. Reference Slacanac, Hardi, Curzik, Pavlovic, Lucan and Vlainic2007). Fermented goat milk has higher levels of Ca than fermented cow milk and it has been previously reported that utilisation of Ca and its deposition in the bone tissue is better with goat milk (Campos et al. Reference Campos, Barrionuevo, Alférez, Nestares, Díaz-Castro, Ros, Ortega and López-Aliaga2007). Mg content is also higher in the fermented goat milk. This element plays a key role in more than 300 enzymatic reactions and is essential for the metabolism of various minerals. This result is in agreement with those reported previously by Nestares et al. (Reference Nestares, Barrionuevo, Díaz-Castro, Lopez-Aliaga, Alférez and Campos2008a, Reference Nestares, Díaz-Castro, Alférez, López-Aliaga, Barrionuevo and Camposb), indicating that goat milk has larger amounts of Mg than cow milk, improving bone turnover and haematological process. Zn content is higher in the fermented goat milk and it has been previously reported that goat milk consumption improved Zn metabolism, increasing its digestive and metabolic utilisation and its deposit in target organs (Díaz-Castro et al. Reference Díaz-Castro, Alférez, López-Aliaga, Nestares and Campos2009). In addition, goat milk plays a positive role in protecting DNA integrity, due to the high levels of bioavailable Mg and Zn in goat milk (Díaz-Castro et al. Reference Díaz-Castro, Hijano, Alférez, López-Aliaga, Nestares, López-Frías and Campos2010). Fermented goat milk has also higher amounts of Cu, mineral required for the efficient utilisation of dietary Fe (Díaz-Castro et al. Reference Díaz-Castro, Alférez, López-Aliaga, Nestares and Campos2011a). Fe was also higher in fermented goat milk, and it has been previously reported that goat milk improves Fe bioavailability, increasing its digestive and metabolic utilisation and Fe deposit in target organs and favouring the recovery of haematological parameters after nutritional ferropenic anaemia (Alférez et al. Reference Alférez, López-Aliaga, Nestares, Díaz-Castro, Barrionuevo, Ros and Campos2006). Therefore, the higher amounts of Fe and Cu in fermented goat milk can have a positive impact on haematological process. Finally, fermented goat milk also has higher amounts of Se and this trace element has important functions in antioxidant effect, alleviating the toxicity of heavy metals, and sperm production (Díaz-Castro et al. Reference Díaz-Castro, Ojeda, Alférez, López-Aliaga, Nestares and Campos2011b).
It is known that milk and dairy products are a good source of vitamins A and E, and the fermented milks analysed in this study also have a good amount of these vitamins, probably because they were obtained and analysed as soon as possible after the sampling. Fermented goat milk was very rich in vitamin A in comparison with fermented cow milk. Generally, vitamin A is accompanied by a variety of carotenoids missing in the cow milk (Gentili et al. Reference Gentili, Caretti, Bellante, Ventura, Canepari and Curini2013). It is known that carotenoids modify the nutritional and sensory properties of milk, contributing to its yellowish colour and oxidative stability along with other antioxidants such as vitamin C, and vitamin E (Gentili et al. Reference Gentili, Caretti, Bellante, Ventura, Canepari and Curini2013). The fermented goat milk analysed in this work showed an intense yellow colour, whereas the fermented cow milk was whiter, being almost devoid of these pigments. Probably the oxidation of vitamin C and E, due to the high amount of carotenoids in goat milk explains the lower amounts of these vitamins in fermented goat milk. It has been previously reported that goat milk folic acid content is much lower than in cow milk (Haenlein, Reference Haenlein2001; Díaz-Castro et al. Reference Díaz-Castro, Sánchez-Alcover, Hijano, Alférez, Nestares, Moreno, Campos and López-Aliaga2014), findings which are in agreement with those obtained in the current study. The concentration of vitamin D in milk depends partly on the animal's exposure to sunlight, however, taking into account the cows and goats were indoor-fed ad libitum, the higher amounts of vitamin D in fermented goat milk may be advantageous from the nutritional point of view in relation to bone turnover (Díaz-Castro et al. Reference Díaz-Castro, Ramírez, Campos, López-Frías, Alférez, Nestares, Ortega and Lopez-Aliaga2011c).
Conclusion
The findings of the present study demonstrate the better nutritional characteristics of fermented goat milk, in comparison with fermented cow milk. This suggests a potential role of this dairy product as a high nutritional value food, with a healthy fatty acid profile, higher protein and amino acid content, and greater mineral content. This included higher amounts of Zn, Mg and Se, minerals which have key roles in antioxidant system, and Ca which plays an important role in bone mineralisation and cell signalling. Fermented goat milk had lower amounts of folic acid, vitamin E and C and higher amounts of vitamin A, D3, B6 and B12. All these findings indicate the nutritional benefit of the fermented goat milk to the consumers. There is one caveat: although the diets of the goats and cows were similar, they were not identical. Further study of animals fed identical diets is warranted.
This study was supported by the Excellence Project (P11-AGR-7648) from the Regional Government of Andalusia. The authors are grateful to Ms Elisa Alcover for her efficient administrative support and to Ms Encarnación Rebollo for her technical assistance.