Introduction
The Anthropocene defaunation, which is caused by excessive hunting, habitat loss and degradation, is one of the most pervasive threats to biodiversity. Besides affecting animal populations, defaunation also has cascading effects on community-level trophic interactions such as animal-mediated seed-dispersal (Markl et al. Reference Markl, Schleuning, Forget, Jordano, Lambert, Traveset, Wright and Böhning-Gaese2012, Peres & Palacios Reference Peres and Palacios2007). A decrease in frugivore diversity may reduce the flux of seeds being disseminated away from parent trees, thus exposing animal-dispersed tree species to high rates of density-dependent mortality (Terborgh Reference Terborgh2013). Large frugivores provide unique services by disseminating many seeds from numerous species, including the largest seeds that smaller-bodied vertebrates cannot disperse (McConkey et al. Reference McConkey, Brockelman, Saralamba and Nathalang2015, Sekar et al. Reference Sekar, Chia-Lo and Sukumar2017). Therefore, the removal of large-bodied species may have particularly severe consequences for forest regeneration such as a shift from a community predominantly composed of large-seeded species to a community predominantly composed of species dispersed by small-bodied frugivores and abiotic means (Effiom et al. Reference Effiom, Birkhofer, Smith and Olsson2014, Harrison et al. Reference Harrison, Tan, Plotkin, Slik, Detto, Brenes, Itoh and Davies2013, Markl et al. Reference Markl, Schleuning, Forget, Jordano, Lambert, Traveset, Wright and Böhning-Gaese2012). Yet, large animals are disproportionately affected by habitat loss and degradation, and hunting (Fa et al. Reference Fa, Ryan and Bell2005, Poulsen et al. Reference Poulsen, Koerner, Moore, Medjibe, Blake, Clark, Akou, Fay, Meier, Okouyi, Rosin and White2017, Ripple et al. Reference Ripple, Abernethy, Betts, Chapron, Dirzo, Galetti, Levi, Lindsey, Macdonald, Machovina, Newsome, Peres, Wallach, Wolf and Young2016).
We only have a vague understanding of the causal link between defaunation and the regeneration of plant cohorts. In particular, even though it is a question of central importance in ecology and conservation (Rother et al. Reference Rother, Pizo and Jordano2016, Schleuning et al. Reference Schleuning, Fru, Klein, Abrahamczyk, Albrecht, Andersson, Bazarian, Bo, Dalsgaard, Dehling and Gotlieb2012), it remains unclear to what extent large seed-dispersers play complementary (or additive) or redundant functional roles in forest regeneration. The answer to this question will advance our understanding of the consequences of trophic downgrading and our ability to predict the long-term capacity of tropical forests to maintain their biodiversity and ecosystem services (Abernethy et al. Reference Abernethy, Coad, Taylor, Lee and Maisels2013).
Pioneer work from Gautier-Hion et al. (Reference Gautier-Hion, Duplantier, Quris, Feer, Sourd, Decoux, Dubost, Emmons, Erard, Heckestweiler, Moungazi, Roussilhon and Thiollay1985) suggested that animal-mediated seed-dispersal was partitioned along fruit syndromes, and recent studies confirm that large vertebrates play complementary roles as seed dispersers (Clark et al. Reference Clark, Poulsen and Parker2001, McConkey & Brockelman Reference McConkey and Brockelman2016, Rother et al. Reference Rother, Pizo and Jordano2016). However, most evidence to date on net effect of large frugivores on seedling recruitment relates to the extirpation of the whole community of frugivores (Harrison et al. Reference Harrison, Tan, Plotkin, Slik, Detto, Brenes, Itoh and Davies2013, Terborgh et al. Reference Terborgh, Nuñez-Iturri and Pitman2008, Wright et al. Reference Wright, Hernandéz and Condit2007) or of particular taxa (e.g. primates: Chaves et al. Reference Chaves, Arroyo-Rodríguez, Martínez-Ramos and Stoner2015, Effiom et al. Reference Effiom, Nuñez-Iturri, Smith, Ottosson and Olsson2013; elephants: Beaune et al. Reference Beaune, Fruth and Bollache2013). In Africa, Effiom et al. (Reference Effiom, Birkhofer, Smith and Olsson2014) and Vanthomme et al. (Reference Vanthomme, Bellé and Forget2010) demonstrated that large birds did not compensate for the loss of large primates for the recruitment of large-seeded species, confirming that these guilds are essential complementary seed dispersers (Clark et al. Reference Clark, Poulsen and Parker2001, Poulsen et al. Reference Poulsen, Clark, Connor and Smith2002).
Whether the contributions of large frugivores to plant recruitment are equivalent is a particularly relevant question in Central Africa, a region that holds the largest frugivores on Earth (Forget et al. Reference Forget, Dennis, Mazer, Jansen, Kitamura, Lambert, Westcott, Dennis, Schupp, Green and Westcott2007) and which experiences an unsustainable rate of bushmeat extraction (Abernethy et al. Reference Abernethy, Coad, Taylor, Lee and Maisels2013, Bennett et al. Reference Bennett, Blencowe, Brandon, Brown, Burn, Cowlishaw, Davies, Dublin, Fa, Milner-Gulland, Robinson, Rowcliffe, Underwood and Wilkie2007). Here, we build on previous studies that assessed the cascading effects of defaunation on forest regeneration (Effiom et al. Reference Effiom, Birkhofer, Smith and Olsson2014, Harrison et al. Reference Harrison, Tan, Plotkin, Slik, Detto, Brenes, Itoh and Davies2013, Vanthomme et al. Reference Vanthomme, Bellé and Forget2010) by evaluating how variation in abundance of the three main groups of large-bodied dispersers (primates, hornbills and forest elephant) influences seedling recruitment in D.R. Congo. Additionally, we tested the indirect effect of the nearby presence of fleshy-fruited trees and percentage forest cover in the landscape on seedling recruitment. These vegetation traits affect seed-disperser activity which subsequently leaves a signal in the seedling community (Clark et al. Reference Clark, Poulsen, Connor and Parker2004, Slocum Reference Slocum2012, Trolliet et al. Reference Trolliet, Forget, Huynen and Hambuckers2017). We hypothesized that due to large differences in size, foraging and ranging behaviour (Campos-Arceiz & Blake Reference Campos-Arceiz and Blake2011, Clark et al. Reference Clark, Poulsen and Parker2001, Trolliet et al. Reference Trolliet, Serckx, Forget, Beudels-Jamar, Huynen and Hambuckers2016, Reference Trolliet, Forget, Huynen and Hambuckers2017), the three taxa should perform complementary functions, and variation in their abundance among sites should cause significant differences in the community of seedlings of animal-dispersed species.
Methods
Study area and forest sites
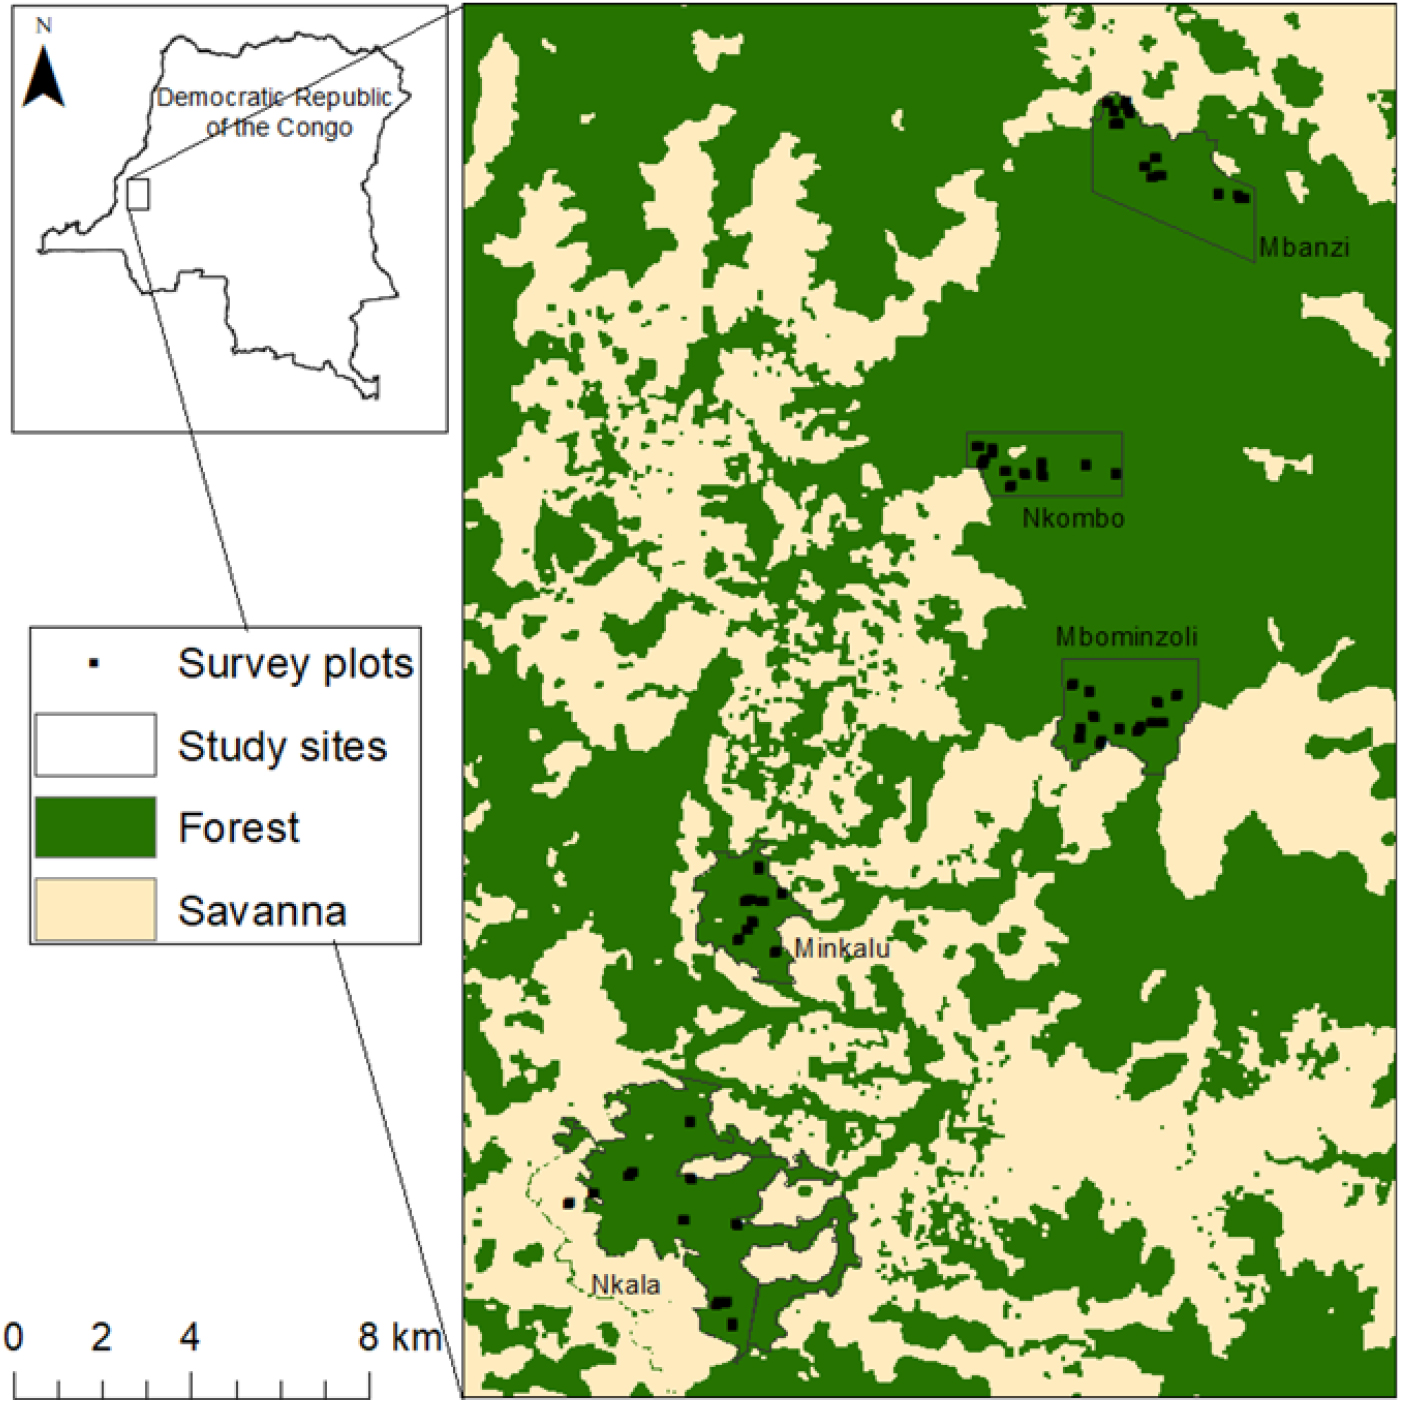
Field data collection took place between June 2013 and May 2015 in the Bandundu province (2°29′3.87′′S, 16°30′4.16′′E) of the D.R. Congo in an area of approximately 30 × 20 km surrounding the WWF (World Wide Fund for Nature) Malebo station. The study area is situated in a forest–savanna mosaic. The forest system includes several forests types such as riverine gallery forest, Uapaca guineensis ecotones, old secondary forest, Marantaceae forest, mature forest dominated by Annonaceae, Fabaceae and Olacaceae, and old-growth monodominant Gilbertiodendron dewevrei forest. Further information on the study area, which has already been used for other studies on animal-mediated seed dispersal, can be found in Trolliet et al. (Reference Trolliet, Serckx, Forget, Beudels-Jamar, Huynen and Hambuckers2016, Reference Trolliet, Forget, Huynen and Hambuckers2017).
We conducted fieldwork within five forested sites that bore different levels of hunting pressure and characteristics. The first three sites, namely Mbanzi, Nkombo and Mbominzoli, were located in an extensive forest block (> 500 km2) visited seasonally by the forest elephant (Loxodonta africana cyclotis) (Appendix 1). Mbanzi village, originally founded as a hunting camp, is home to around 600 people, including a large group of hunters, so the forest was assumed to be under relatively high hunting pressure. To our knowledge, the local human population does not hunt the forest elephant and its poaching in the area is reduced. The Nkombo and Mbominzoli forests were located farther away from human settlements where anthropogenic pressure was probably more limited. The latter site hosts a large-mammal monitoring programme supported by the Mbou-Mon-Tour NGO. The site is also located within the geographic limits of an ethnic group which, because of a traditional taboo, does not hunt the bonobo (Pan paniscus) (Inogwabini et al. Reference Inogwabini, Matungila, Mbende, Abokome and Wa Tshimanga2007). The other two forest sites, Nkala and Minkalu, belong to nearby village communities that practice subsistence hunting. Hunting pressure was high, yet home to the same ethnic group which does not hunt bonobo and which is under the bonobo conservation programmes of the WWF-DRC and Mbou-Mon-Tour NGOs. Thus, Nkala, Minkalu and Mbominzoli hosted relatively higher densities of bonobo compared with Mbanzi and Nkombo. Hornbills, even though they are not the main target of hunters, are increasingly hunted across African forests as other species disappear (Trail Reference Trail2007, Whytock et al. Reference Whytock, Buij, Virani and Morgan2016).
Frugivore community
We characterized the large-frugivore community and hunting levels at each site by conducting surveys on a system of line-transects and forest reconnaissance trails (Hall et al. Reference Hall, White, Inogwabini, Omari, Morland, Williamson, Saltonstall, Walsh, Sikubwabo, Bonny, Kiswele, Vedder and Freeman1998, Walsh & White Reference Walsh and White1999) for a total of 170 km. During the main dry season (June to August) of 2013 and 2014, the first author and two local field assistants recorded all direct (encounters, calls) and indirect signs of primates (faeces, footprints, nests), hornbills, elephants (faeces, footprints) and hunting activity (rifle cartridges, gunshots, traps, fires). We calculated encounter rates (kilometric abundance index (KAI), observations km−1) by summing all observations collected for each of the categories of hunting, primates and hornbills for each site (Appendix 2, Figure 1) (Mathot & Doucet Reference Mathot and Doucet2006, Vanthomme et al. Reference Vanthomme, Bellé and Forget2010). Because elephant tracks that were close to one another could not be considered independent, and due to their large home ranges, the number of tracks encountered was not a reliable indication of elephant relative abundance. We therefore reported its presence or absence at each site.
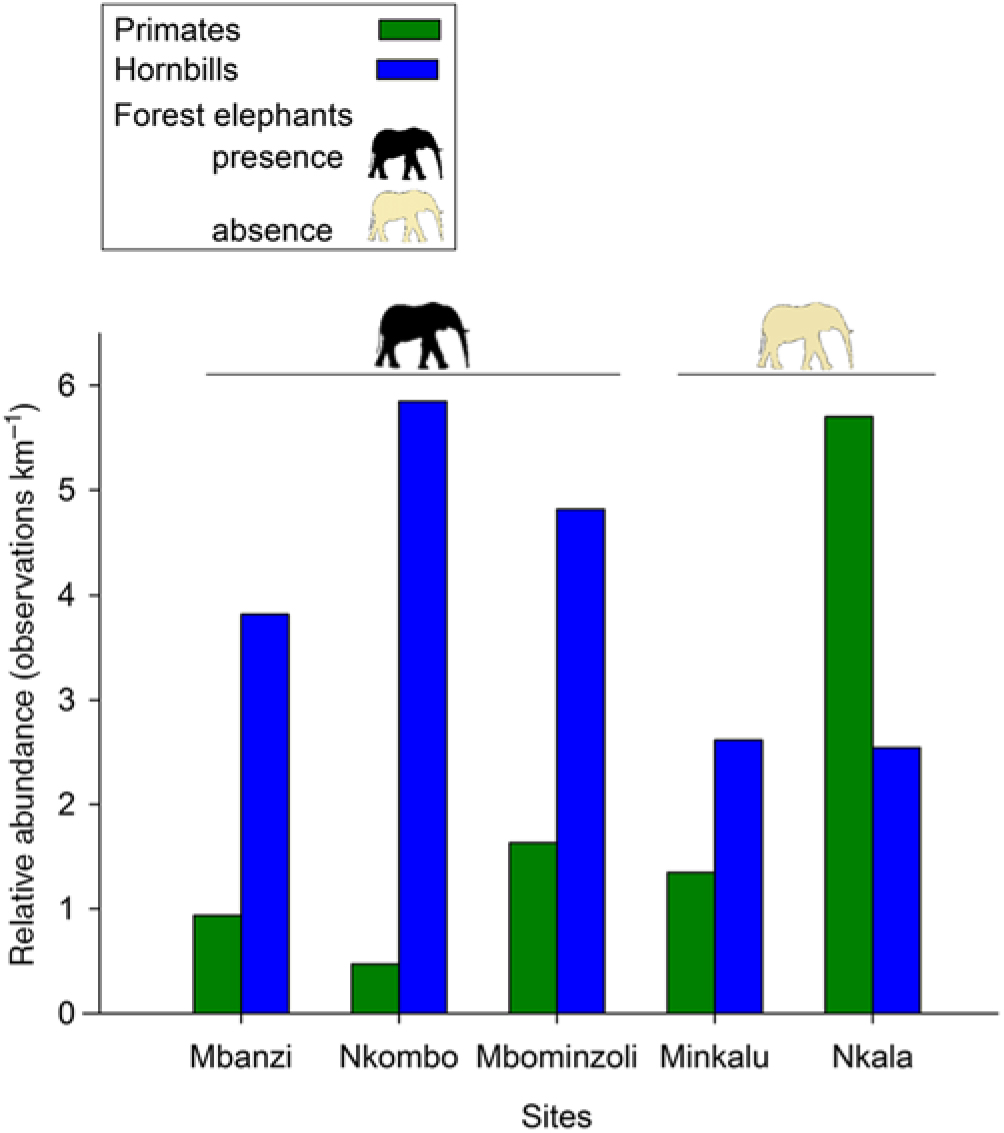
Figure 1. Abundance of the three main large frugivore taxa in five sites in the forest–savanna mosaic around the Malebo field station in the Bandundu province, Democratic Republic of the Congo.
Environmental variables
We included the plot type (under a Staudtia kamerunensis tree, under a Dialium spp. tree, or random) and percentage forest cover in the landscape in our analysis. We calculated the percentage forest cover in circular buffers around each location following the method in Trolliet et al. (Reference Trolliet, Forget, Huynen and Hambuckers2017). Each buffer had a 2500-m radius owing to the fact that the amount of forest cover included in such areas around S. kamerunensis trees is known to influence the seed dispersal of this species (Trolliet et al. Reference Trolliet, Forget, Huynen and Hambuckers2017). Forest cover did not include recently deforested areas such as shifting agriculture mosaics made of cultivated fields and fallows with young secondary vegetation, as visually assessed in the field.
Seedling community
We sampled the seedling community in 25-m2 (5 × 5 m) plots located under the crown of large (dbh > 30 cm) animal-dispersed trees of S. kamerunensis (52 plots under 32 trees) and Dialium spp. (46 plots under 26 trees) and distributed among the five sites (Appendix 1). As far as possible, we established two plots under each tree, but we only established one plot under trees whose crown was not large enough to cover two plots. Staudtia trees produce fruits that primarily attract hornbills, as shown by visual observations conducted in Cameroon (Clark et al. Reference Clark, Poulsen, Connor and Parker2004) and in the study area (Trolliet et al. Reference Trolliet, Forget, Huynen and Hambuckers2017; > 95% of visits by frugivores), although their fruits are consumed by primates too (Gautier-Hion et al. Reference Gautier-Hion, Duplantier, Quris, Feer, Sourd, Decoux, Dubost, Emmons, Erard, Heckestweiler, Moungazi, Roussilhon and Thiollay1985). Dialium spp. trees produce pods that attract primates (Poulsen et al. Reference Poulsen, Clark and Smith2001, Trolliet et al. Reference Trolliet, Serckx, Forget, Beudels-Jamar, Huynen and Hambuckers2016). Surveying heterospecific regeneration under animal-dispersed trees maximizes the amount of information on seed-disperser activity and enables inter-site comparisons (Nuñez-Iturri & Howe Reference Nuñez-Iturri and Howe2007, Vanthomme et al. Reference Vanthomme, Bellé and Forget2010). To account for the activity of frugivores not visiting these areas and to perform a more comprehensive survey of the seedling community, we sampled one or two plots 50 m from the focal tree in a random direction. Each plot or pair of plots is referred to as a location (Appendix 3).
In each plot, we identified all seedlings 0.5–2 m in height (Vanthomme et al. Reference Vanthomme, Bellé and Forget2010) to genus, species or morphospecies level. Plant identification was performed in the field by two locally experienced parataxonomists, who also previously helped in the identification of tree species in the study area. Samples were deposited in the herbarium and botanical library of the Université Libre de Bruxelles (BRLU), with reference IDs Bastin-Serckx#1-474. Botanists (two of us, JLD, JFG, and Olivier Lachenaud at the Herbarium of the National Botanic Garden Meise) double-checked seedling samples and identified unidentified species. For each species, we indicated whether it was dispersed by animals or by abiotic processes, and also determined the seed length with the aid of the literature. We only considered animal-dispersed species for the analyses (Appendix 4).
Statistical analysis
The analyses aimed to explain the variation of three response variables among the locations: seedling density, seedling species richness, and mean seed length of animal-dispersed seedling species (weighted by the abundance of seedlings). We classified the explanatory variables related to the presence or abundance of frugivores in an animal component, and the plot type and percentage forest cover in a vegetation component.
Furthermore, we considered a third – spatial – explanatory component to account for the spatial autocorrelation of both the response and the explanatory variables, both among and within the sites. Using a spatially explicit framework ensures a correct type I error rate by accounting for the non-independence of spatially distributed observations (Diniz-Filho & Bini Reference Diniz-Filho and Bini2005, Dray et al. Reference Dray, Pélissier, Couteron, Fortin, Legendre, Peres-Neto, Bellier, Bivand, Blanchet, De Cáceres, Dufour, Heegaard, Jombart, Munoz, Oksanen, Thioulouse and Wagner2012), and highlight multiscale spatial structures displayed by the response variables. These spatial patterns are signatures of underlying ecological processes and can therefore provide crucial ecological information (Dray et al. Reference Dray, Pélissier, Couteron, Fortin, Legendre, Peres-Neto, Bellier, Bivand, Blanchet, De Cáceres, Dufour, Heegaard, Jombart, Munoz, Oksanen, Thioulouse and Wagner2012, Fortin & Dale Reference Fortin and Dale2014, Legendre & Legendre Reference Legendre and Legendre2012). The spatial component was generated through Moran’s eigenvector maps (MEM, Dray et al. Reference Dray, Legendre and Peres-Neto2006), a spatial eigenvector-based method that breaks down the overall spatial autocorrelation into complementary multiscale spatial patterns. The spatial eigenvectors (hereafter referred to as spatial predictors or MEM variables) were generated following the method and recommendation in Bauman et al. (Reference Bauman, Drouet, Dray and Vleminckx2018 a, Reference Bauman, Drouet, Fortin and Dray2018 b; details presented in Appendix 5). We only used positively correlated spatial variables, as we were interested in contagious ecological processes (i.e. displaying a positive spatial autocorrelation).
We included the animal, vegetation and spatial explanatory datasets in a variation partitioning analysis (Borcard & Legendre Reference Borcard and Legendre1994, Peres-Neto & Legendre Reference Peres-Neto and Legendre2010). The latter allowed the assessment of the shared and pure contributions of the three explanatory components to the total variation of each response variable. A shared contribution was jointly explained by two or more components, while a pure contribution was solely explained by the component itself. The pure spatial component, in particular, allowed us to visualize the spatial patterns remaining in the response variables after removing the effect of the two other explanatory components. These pure spatial patterns can provide insights about possible underlying complementary processes (McIntire & Fajardo Reference McIntire and Fajardo2009, Peres-Neto & Legendre Reference Peres-Neto and Legendre2010). We estimated the explanatory power of the different effects using the adjusted coefficient of determination (R 2 adj ; Peres-Neto et al. Reference Peres-Neto, Legendre, Dray and Borcard2006).
To define the ecologically relevant parameters within the vegetation and the animal components while maintaining a low type-I error rate and controlling for overfitting, we performed a global test of significance separately on the animal and vegetation explanatory variables, and a forward model selection with two stopping criteria following Blanchet et al. (Reference Blanchet, Legendre and Borcard2008). The global tests for the spatial predictors as well as the test of the pure fractions of the variation partitioning were performed using a classical permutation of the model residuals (9999 iterations, Anderson & Legendre Reference Anderson and Legendre1999). The shared fractions of the variation partitioning were tested using Moran spectral randomization (Wagner & Dray Reference Wagner and Dray2015), following the method of Bauman et al. (Reference Bauman, Vleminckx, Hardy and Drouet2019). All analyses were conducted using the R software.
Results
The five sites differed in terms of hunting pressure (0.56–1.28 obs. km−1), abundance of primates (0.47–5.7 obs. km−1), hornbills (2.54–5.85 obs. km−1) and the presence of the forest elephant (Figure 1). The relative abundance of primates in Nkala was particularly high (5.7 obs. km−1) compared with the other sites. Primates were mainly represented by the bonobo, but also by Cercopithecus spp. Hornbills were mainly represented by Bycanistes albotibialis, but also by Ceratogymna atrata and Bycanistes fistulator (Appendix 2). We confirmed the presence of the forest elephant in Mbanzi, Nkombo and Mbominzoli, and did not detect any sign of its presence in Nkala and Minkalu.
Among the 248 morphospecies found during the survey (N = 6300 seedlings), 34 (14%) had an unknown dispersal mode and 185 (86%) were dispersed by animals. Among those, the seed length was unknown for 71 species, representing 1306 individuals (21%). The descriptive statistics (density, species richness and mean weighted seed length) of each site are presented in Appendix 6.
The mean density of seedlings of animal-dispersed species presented no spatial structure at the scales encompassed by the study (P > 0.178 for all candidate spatial weighting matrices), and could not be explained by the animal or the vegetation components (P = 0.206 and P = 0.062, respectively) (Figure 2a, Appendix 7).
Figure 2. Values of the R 2 adj obtained from the partial regressions (variation partitioning analysis) among the animal, vegetation and spatial components. Values of R 2 adj are presented for the three response variables density (a), species richness (b) and mean weighted seed length of animal-dispersed species (c). Circles in the Venn diagrams with plain lines and dotted lines show significant (P < 0.05) and non-significant (P > 0.05) components, respectively. The values indicate pure contributions, except for the underlined values which give R 2 adj computed by subtraction of other R 2, which are therefore non-testable. The asterisks and the double asterisks indicate significant (P < 0.05) and highly significant signals (P < 0.01), respectively. Values < 0 are not shown. No component contained significant explanatory variables to explain variation in the density of seedlings. For species richness, the animal component contained the abundance of primates and the vegetation component contained the plot type and percentage forest cover. For mean seed length, the animal component contained abundance of hornbills and the vegetation component contained the percentage forest cover.
The selected model explaining the variation in the species richness of seedlings of animal-dispersed species displayed a significant animal component (abundance of primates; R 2 adj = 0.08, P = 0.001), and a significant vegetation component (percentage forest cover and plot type; R 2 adj = 0.16, P = 0.001) (Figure 2b, Appendix 7). The abundance of primates and the presence of Staudtia trees were associated with an increase in animal-dispersed species richness (Figure 3a-b). Also, the percentage forest cover was associated with a decrease in animal-dispersed species richness (Figure 3c). The variation in species richness displayed a broad-scale spatial pattern (Appendix 8; R 2 adj = 0.327, P = 0.020). Nearly half of this spatially structured variation of seedling species richness was related to spatial patterns observed in the vegetation and animal explanatory variables, while a residual spatial pattern remained unexplained by these ecological variables (Appendix 8) (R 2 adj = 0.21, P = 0.001; Figure 2b, Appendix 7). However, none of the shared fractions of variation was significant. Together, the three explanatory datasets explained over a third of the total variation of the species richness (R 2 adj = 0.40).

Figure 3. Mean species richness of seedlings of animal-dispersed species per 25 m2 (represented by plain circles) in the forest–savanna mosaic around the Malebo field station in the Bandundu province, Democratic Republic of the Congo. Mean species richness is presented as a function of primate abundance (a), plot type (b) and percentage forest cover (c). In the plot type comparison, solid lines represent the median and black dots represent 5th/95th percentiles. In the two regressions against primate abundance and percentage forest cover, solid lines represent the linear regression.
Finally, variables from the animal component significantly explained variation in mean seed length of animal-dispersed species. More specifically, the mean seed length increased when the abundance of hornbills increased (R 2 adj = 0.12, P = 0.001; Figure 4a-b, Appendix 7). The mean seed length of the animal-dispersed species displayed a fine- to medium-scale spatial structure (R 2 adj = 0.53, P = 0.001). The spatial pattern consisted of a significantly higher value of mean seed length in nearly all the plots of the Mbominzoli site, around half of the plots of the Nkombo site, and a few plots scattered in the Nkala site (Appendix 8). This spatial pattern of the mean seed length was partly related to a similar structure in the distribution of the hornbill abundances (R 2 adj = 0.10, P = 0.17; Figure 2c). In addition, a strong residual spatial pattern remained in the mean weighted seed length, after removing the effect of hornbill abundance and percentage forest cover (R 2 adj = 0.42, P = 0.001; Figure 2c, Appendix 8). Overall, the three components explained over half (R 2 adj = 0.55) of the total variation of the mean seed length of the animal-dispersed species among locations.

Figure 4. Mean weighted seed length of animal-dispersed species of seedlings per 25 m2 in the forest–savanna mosaic around the Malebo field station in the Bandundu province, Democratic Republic of the Congo. Mean weighted seed length is presented as a function of hornbill abundance (a), percentage forest cover (b) and elephant presence (c).
Discussion
Our results highlight the influence of the three explanatory components, i.e. animal, vegetation and spatial components, on species richness and on mean seed length of the animal-dispersed species. The use of spatial predictors in the analyses showed that the effect of the plot type, percentage forest cover and the primate abundance (for the species richness) as well as the effect of the hornbill abundance (for the mean seed length) were spatially structured at different spatial scales. These spatial predictors also highlighted strong residual spatial patterns (R 2 adj = 0.21 and 0.42, for the species richness and mean seed length, respectively), hence indicating that some unmeasured ecological processes are still responsible for a strong spatial pattern in both the species richness and the mean seed length of the animal-dispersed species. This last result stresses the crucial role of spatially explicit statistical methods for the study of ecological processes involving dispersal and landscape properties (Dray et al. Reference Dray, Pélissier, Couteron, Fortin, Legendre, Peres-Neto, Bellier, Bivand, Blanchet, De Cáceres, Dufour, Heegaard, Jombart, Munoz, Oksanen, Thioulouse and Wagner2012).
Frugivores’ influence on the species richness and mean seed length of animal-dispersed species
First, no significant effect of any of the three explanatory components could be detected on the density of seedlings of animal-dispersed species. Notably, this result is in line with the finding of Vanthomme et al. (Reference Vanthomme, Bellé and Forget2010), that the density of seedlings in Central African hunted and non-hunted sites do not differ significantly.
Secondly, the richness of animal-dispersed species was related to the abundance of primates, which supports the importance of primates as seed dispersers (Harrison et al. Reference Harrison, Tan, Plotkin, Slik, Detto, Brenes, Itoh and Davies2013, Nuñez-Iturri & Howe Reference Nuñez-Iturri and Howe2007, Poulsen et al. Reference Poulsen, Clark and Smith2001, Terborgh et al. Reference Terborgh, Nuñez-Iturri and Pitman2008, Vanthomme et al. Reference Vanthomme, Bellé and Forget2010). We also found that species richness decreased with percentage forest cover. Areas surrounding plots with lower amounts of forest cover tend to include more transitional forests at edges (i.e. forests at early successional stages), which have more open understorey and more light reaching the forest floor compared with closed understorey in forest interiors. Such favourable light conditions promote greater survival of light-demanding species which die in low-light conditions. An increasing representation of forests at early successional stages could foster γ-diversity (Arroyo-Rodríguez et al. Reference Arroyo-Rodríguez, Rös, Escobar, Melo, Santos, Tabarelli and Chazdon2013) and allow a subsequent richer seed rain. Thus, we suggest that plots surrounded by less forest receive a richer seed rain that increases the richness of seedlings of animal-dispersed species. In addition to those landscape scale patterns, the richness of the seedling community was found to be influenced at the local scale by the presence of fleshy-fruited trees above survey plots. It has been reported that trees attract seed-dispersing animals and act as centres of regeneration, or seed-dispersal foci (S. kamerunensis: Clark et al. Reference Clark, Poulsen, Connor and Parker2004; Ficus: Cottee-Jones et al. Reference Cottee-Jones, Bajpai, Chaudhary and Whittaker2016). Here, we showed that S. kamerunensis was associated with higher species richness among seedlings. Possible underlying drivers of this pattern could be post-dispersal filtering processes (Fleury et al. Reference Fleury, Silla, Rodrigues, Hilton and Galetti2014), soil heterogeneity (Muledi et al. Reference Muledi, Bauman, Drouet, Vleminckx, Jacobs, Lejoly, Meerts and Shutcha2016, Vleminckx et al. Reference Vleminckx, Doucet, Morin-Rivat, Biwolé, Bauman, Hardy, Fayolle, Gillet, Daïnou, Gorel and Drouet2016), or varying influences of adult trees among sites (Effiom et al. Reference Effiom, Birkhofer, Smith and Olsson2014).
Thirdly, we showed that a decreasing abundance of hornbills significantly reduced the mean weighted seed length of the species in the seedling community. However, considering the strong positive correlation between the presence of hornbills and the forest elephant, we suggest that the observed reduction in seed length is probably associated with the extirpation of both hornbills and elephant. Indeed, the absence of the elephant might have significantly disrupted the dispersal and recruitment of large-seeded species, thus reducing the mean seed length of species of the seedling community (Figure 4c). The remaining spatial pattern (i.e. unexplained by the plant and frugivore variables) detected for the mean seed length indicates that some additional unmeasured ecological processes influence the distribution of the mean seed-length values among seedling communities. Physico-chemical soil heterogeneity, known to typically display spatially autocorrelated patterns and to be crucial for seed germination as well as young life-stages of trees, could be responsible for a portion of the residual spatial patterns of both mean seed length and species richness. A future thorough consideration of soil variables will allow this hypothesis to be tested, therefore helping to better understand the mechanisms influencing species richness and mean seed length of animal-dispersed tree species.
In addition to the previously mentioned mechanisms, we suspect that some variation in the activity level of elephants between Mbanzi, Nkombo and Mbominzoli could account for a proportion of the remaining spatial structure. Also, larger seeds are more prone to predation by rodents and parasitism than smaller seeds (Foster Reference Foster1986), so our results may partly be related to inter-site differences in post-deposition seed survival. The mean seed length increase in plots surrounded by more forest is consistent with our previous explanation related to the effect of understorey light on species richness. Light-demanding tree species, whose seedlings likely show greater survival in areas with relatively less forest cover, tend to have smaller seeds compared with shade-bearer tree species (Foster Reference Foster1986).
Unexplained variation
The unexplained variation (i.e. the residuals of the variation partitioning analyses) could indicate both that some ecological processes other than those measured here influence our diversity indices, and that this variation is neutral (i.e. stochastic). Portions of the residual variability might be related to the activity of some frugivores and granivores (e.g. bats, duikers, rodents, bush pigs) that were not considered here. Particularly, biotic (seed predation, herbivory, pathogen, fungi etc.) and abiotic (amount of light, water etc.) post-dispersal processes (Clark et al. Reference Clark, Poulsen and Levey2012, Mangan et al. Reference Mangan, Schnitzer, Herre, Mack, Valencia, Sanchez and Bever2010, Nicotra et al. Reference Nicotra, Chazdon and Iriarte1999, Wang & Smith Reference Wang and Smith2002) can affect seedling recruitment in a non-random fashion and change the composition pattern of the seedling cohort as regards to the initial seed rain (Alcomb Reference Alcomb2003, Carrière et al. Reference Carrière, Letourmy and McKey2002, Herrera et al. Reference Herrera, Jordano, Lopez-Soria and Amat1994). Spatio-temporal variation in these processes within and among our sites might have eroded the signature of seed-dispersers on the seedling cohort. Additionally, the coarse resolution and limited sampling effort of the frugivore kilometric abundance index is likely to have limited statistical power, hence potentially causing underestimations of the actual frugivore effects. Notably, hornbill abundances were strongly positively correlated with the presence of the elephant (Figure 1), which made their respective influence not fully distinguishable. These collinearity issues, inherent to any ecological study (Dormann et al. Reference Dormann, Elith, Bacher, Buchmann, Carl, Carré, Marquéz, Gruber, Lafourcade, Leitão, Münkemüller, McClean, Osborne, Reineking, Schröder, Skidmore, Zurell and Lautenbach2013), make the task of accurately disentangling the degree of functional complementarity among seed dispersers delicate. Additionally, it is worth mentioning that since the forest elephant represents part of a relic fragile population (Inogwabini et al. Reference Inogwabini, Mbende and Mbenzo2011), its lack of significance in the analyses may have resulted from the partial loss of its ecological function (McConkey & O’Farrill Reference McConkey and O’Farrill2016, Poulsen et al. Reference Poulsen, Rosin, Meier, Mills, Nuñez, Koerner, Blanchard, Callejas, Moore and Sowers2018). Our sampling design contained only five replicates (sites) to explore the effect of frugivores, and plots, used as observations, were nested within sites. The replication of this kind of study with more observations of frugivore communities and the sampling of seed-disperser activity at finer spatial scales will allow further evaluation of the strength and the scale of the effects each taxon actually has on the regeneration of tropical forests. Finally, variation in demographic rates (e.g. birth, death), dispersion and recruitment can be neutral, hence yielding a varying – but common – intrinsic stochasticity in living communities (Bell et al. Reference Bell, Lechowicz and Waterway2006, Hubbell Reference Hubbell2001, Reference Hubbell2006). The extent of this natural stochasticity, however, is impossible to evaluate at this point, as more potentially relevant ecological variables (soil heterogeneity) could still be measured and integrated to our models.
Functional complementarity, or redundancy?
The lack of variation in seedling density could suggest that hornbills, primates and elephant have a redundant functional role for forest regeneration in this forest–savanna mosaic. Given the assemblage of large frugivores at each site, the absence of the forest elephant would seem to be functionally compensated for by the presence of primates and hornbills as far as seedling density is concerned. Yet, we cannot exclude the possibility that other processes have had a more pronounced role in maintaining seedling densities at similar values among sites.
Secondly, this study suggests that the seed-dispersal services lost with the reduction in primate abundance was not compensated for by hornbills. This result supports the conclusion of Clark et al. (Reference Clark, Poulsen and Parker2001) and Poulsen et al. (Reference Poulsen, Clark, Connor and Smith2002) in that these two taxa play complementary roles as seed dispersers.
Finally, the presence of primates seemed not to functionally compensate for a lack of recruitment of large-seeded trees in the sites where hornbill abundance was low and the forest elephant was extirpated. Forest elephant species disperse the largest seeds among the tree community and play a unique function in tropical forests, and are thus complementary to other guilds (Blake et al. Reference Blake, Deem, Mossimbo, Maisels and Walsh2009, Campos-Arceiz & Blake Reference Campos-Arceiz and Blake2011, Sekar et al. Reference Sekar, Chia-Lo and Sukumar2017). Yet, the result remains somewhat surprising since the bonobo, the main representative of the primate community in Nkala and Minkalu, also provides dispersal services for large-seeded plants: few plants dispersed by the bonobo are also dispersed by hornbills (Trolliet et al. Reference Trolliet, Serckx, Forget, Beudels-Jamar, Huynen and Hambuckers2016). We suggest that post-dispersal processes could have induced inconsistencies between the composition of the seed rain and that of the seedling community, and reduced the ultimate influence of the bonobo on the recruitment of large-seeded plants (Alcomb Reference Alcomb2003, Carrière et al. Reference Carrière, Letourmy and McKey2002, Lugon et al. Reference Lugon, Boutefeu, Bovy, Vaz-De-Mello, Huynen, Galetti and Culot2017).
Overall, our results would suggest that hornbills, primates and the forest elephant could play complementary functions in effectively dispersing a wide diversity of seed types and species and ensure their recruitment. In the context of increasing anthropogenic pressures on tropical ecosystems, we stress the importance of maintaining diverse large frugivore communities to ensure optimal ecosystem functioning.
Author ORCIDs
Franck Trolliet https://orcid.org/0000-0003-1472-2592; David Bauman https://orcid.org/0000-0001-9115-6518
Acknowledgements
We are sincerely grateful to Mbou-Mon-Tour and WWF-DRC, particularly the Malebo field team, for their logistical help. We thank the chiefs who allowed us to work in their forest and local trackers who helped with data collection.
Financial support
We are thankful to BELSPO and F.R.S.-FNRS FRIA for their financial support.
Appendix 1
Map of the study area in the forest–savanna mosaic around the Malebo field station, Bandundu province, D.R. Congo, with the five sites (Mbanzi, Nkombo, Mbominzoli, Minkalu and Nkala) and the position of the survey plots.
Appendix 2
Main characteristics of the study sites in terms of conservation programmes, hunting pressure and large frugivore community in D.R. Congo. MMT = Mbou-Mon-Tour; WWF = WWF-DRC; a Cercopithecus spp. mainly include C. ascanius and potentially C. mona wolfi and C. neglectus, even though these two species are rare and difficult to observe.
Appendix 3
Sampling efforts of seedling survey and distribution across the five sites in the forest–savanna mosaic in D.R. Congo.
Appendix 4
Seed length of each animal-dispersed plant species encountered during the seedling survey in the forest–savanna mosaic in D.R. Congo. Nomenclature follows APG III (The Angiosperm Phylogeny Group 2009). Name status is derived from the African Plants database of ‘Conservatoire et Jardin Botaniques de la Ville de Genève’ (http://www.ville-ge.ch/musinfo/bd/cjb/africa/recherche.php). If the genus is identified and the species determination is uncertain, ‘cf.’ is indicated before the species name. If the species or genus is not known, ‘sp.’ is used. In these cases, different morphospecies are further differentiated with numbers and sometimes date of sampling (day/month). In these cases, more complete samples (fertile) are needed in order to confirm the identifications.

Appendix 5
Methodological details for the generation of the spatial predictors.
The spatial eigenvectors were generated following Bauman et al. (Reference Bauman, Drouet, Dray and Vleminckx2018 a, b). To do so, the spatial weighting matrix was optimized using the forward selection with double stopping criterion of Blanchet et al. (Reference Blanchet, Legendre and Borcard2008), from a set of four candidate matrices consisting of a Gabriel graph and a minimum spanning tree (connectivity matrices) either unweighted or weighted by a function decreasing linearly with the distance (fij = 1 − dij /Dmax , where dij is the distance between sites i and j, and Dmax is the maximum distance between two sites). The exclusive choice of graph-based connectivity matrices among the candidates was guided by the greater statistical power and detection accuracy of these matrices for irregular sampling designs, relative to distance-based matrices (Bauman et al. Reference Bauman, Drouet, Fortin and Dray2018 b). This also allowed us to consider a much broader range of spatial scales than what distance-based MEM would have allowed.
The spatial weighting matrix consisting of the minimum spanning tree weighted by the linear function was selected for both the species richness and the mean weighted seed length of the animal-dispersed seedlings, with six and 12 spatial predictors forward-selected, respectively.
Appendix 6
Means and standard deviations of the response variables (density, species richness, and mean weighted seed length of animal-dispersed seedling species) for each study site in the forest–savanna mosaic in D.R. Congo.

Appendix 7
Proportion of the variation (R 2 adj ) of the three response variables (density, species richness, and mean seed length of animal-dispersed seedlings species) explained by each explanatory variable selected by the forward selection according to Blanchet et al. (Reference Blanchet, Legendre and Borcard2008), and among the three components (animal, vegetation and spatial) considered in the variation partitioning analysis, in the forest–savanna mosaic in D.R. Congo. a R 2 adj obtained from the forward selection; bcontributions (R 2 adj ) obtained from the variation partitioning analysis. * and ** indicate significant (P < 0.05) and highly significant (P < 0.01) results, respectively.
Appendix 8
Mapped general (a and b) and unexplained (residual) (c and d) spatial patterns of the species richness (a and c) and mean weighted seed length (b and d) of the animal-dispersed seedling species. The squares represent the sampled plots (see Appendix 1 for details). The size and colour of the squares are related to the corresponding response variable in such a way that the large black squares display a similar (high) value of the response variable, while the large white squares display a similar (low) value of the response variable. All four patterns are significantly positively autocorrelated.