


Introduction
The geographic distribution of host–parasite systems is strongly dependent on environmental conditions (Morand and Krasnov, Reference Odum and Barrett2010; Prieto-Torres et al., Reference Ramey, Reed, Schmutz, Fondell, Meixell, Hupp, Ward, Terenzi and Ely2020). Spatial modelling of environmental responses to climate change (Peterson et al., Reference Peterson, Papeş and Soberón2002; Sehgal et al., Reference Sehgal, Buermann, Harrigan, Bonneaud, Loiseau, Chasar, Sepil, Valkiūnas, Iezhova, Saatchi and Smith2011; Ponce-Reyes et al. Reference Ponce-Reyes, Plumptre, Segan, Ayebare, Fuller, Possingham and Watson2012, Reference Prieto-Torres, Rojas-Soto, Lira-Noriega, Santiago-Alarcon and Marzal2017) can be used to describe the current distribution of climatic variables most relevant to observed haemosporidian prevalence in present-day conditions (Benning et al., Reference Benning, LaPointe, Atkinson and Vitousek2002; Samuel et al., Reference Samuel, Hobbelen, DeCastro, Ahumada, LaPointe, Atkinson, Woodworth, Hart and Daffy2011; Sehgal et al., Reference Sehgal, Buermann, Harrigan, Bonneaud, Loiseau, Chasar, Sepil, Valkiūnas, Iezhova, Saatchi and Smith2011; Fecchio et al., Reference Fecchio, Bell, Bosholn, Vaughan, Tkach, Lutz, Cueto, Gorosito, González-Acuña, Stromlund, Kvasager, Comiche, Kirchgatter, Pinho, Berv, Anciães, Fontana, Zyskowski, Sampaio, Dispoto, Galen, Weckstein and Clark2019a). Then, this information is used to create spatial projections of those variables under climate change scenarios to predict potential changes of prevalence or infection rate in years to come. This approach has been used for studying vector-borne human diseases, such as dengue and malaria (Martens et al., Reference Massad, Becerra-Coutinho, Fernandez-Lopez and Rodrigues da Silva1999; Patz and Reisen, Reference Peterson, Ortega-Huerta, Bartley, Sánchez-Cordero, Soberón, Buddemeier and Stockwell2001; Massad et al., Reference McClure2011; Ojogba et al., Reference Osorio-Olvera, Lira-Noriega, Soberón, Peterson, Falconi, Contreras-Díaz, Martínez-Meyer, Barve and Barve2012; Robles-Fernández et al., Reference Robles-Fernández, Santiago-Alarcon and Lira-Noriega2021), and could provide insightful information when applied to the study of wildlife infectious diseases (Prieto-Torres et al., Reference Ramey, Reed, Schmutz, Fondell, Meixell, Hupp, Ward, Terenzi and Ely2020).
Avian malaria and related parasites are protozoans belonging to the genera Plasmodium, Haemoproteus, Leucocytozoon and Fallisia (Phylum Apicomplexa, order Haemosporida), which are distributed worldwide except for Antarctica (Valkiūnas, Reference Valkiūnas2005). Different dipteran species from the families Culicidae, Hippoboscidae, Ceratopogonidae and Simuliidae transmit these parasites (Atkinson, Reference Atkinson, Friend and Franson1999; Valkiūnas, Reference Valkiūnas2005; Santiago-Alarcon et al., Reference Santiago-Alarcon, Palinauskas and Schaefer2012; Ferreira et al., Reference Forrester, Greiner, Atkinson, Thomas and Hunter2020). Currently, there is little information available regarding how climate fluctuations may affect ecological dynamics involving haemosporidians, but likely functional responses include the following: (1) range expansion of haemosporidian parasites to higher altitudes (Benning et al., Reference Benning, LaPointe, Atkinson and Vitousek2002; Peterson et al., Reference Peterson, Papeş and Soberón2002; Samuel et al., Reference Samuel, Hobbelen, DeCastro, Ahumada, LaPointe, Atkinson, Woodworth, Hart and Daffy2011; Atkinson et al., Reference Atkinson, Utzurrum, LaPointe, Camp, Crampton, Foster and Giambelluca2014; McClure, Reference Møller2017; Ferraguti et al., Reference Ferreira, Santiago-Alarcon, Braga, Santiago-Alarcon and Marzal2020; Rodríguez-Hernández et al., Reference Rodríguez-Hernández, Álvarez-Mendizábal, Chapa-Vargas, Escobar, González-García and Santiago-Alarcon2021); (2) shifts in geographic range and colonization patterns towards areas where the presence of certain haemosporidian lineages or avian hosts is uncommon or absent (Lindsay and Martens, Reference Liverman and O'Brien1998; Khasnis and Nettleman, Reference Krama, Rantala, Krams, Krams, Cırule and Moore2005; Brooks and Hoberg, Reference Brooks and Hoberg2007; Kurane, Reference Liao, Atkinson, LaPointe and Samuel2010; Coon and Martin, Reference Coon and Martin2013; McClure, Reference Møller2017; Ferraguti et al., Reference Ferreira, Santiago-Alarcon, Braga, Santiago-Alarcon and Marzal2020); and (3) the reduction and eventual disappearance of ecotones and contact zones that limit the dispersal of haemosporidian parasites (Odum and Barrett, Reference Ojogba, Emmanuel, Ikenna and Okokon2004; Brooks and Hoberg, Reference Brooks and Hoberg2007; Atkinson et al., Reference Atkinson, Utzurrum, LaPointe, Camp, Crampton, Foster and Giambelluca2014).
Latitudinal shifts in the distribution of avian haemosporidians are hard to assess, mainly because different parasite groups present different distribution patterns in response to latitude and local climate trends (Kamiya et al., Reference Khasnis and Nettleman2013). Preliminary – albeit fragmentary – information indicates a lack of a latitudinal pattern in avian haemosporidian (Clark, Reference Clark2018) or a reverse latitudinal pattern (higher prevalence at higher latitudes, instead of the opposite) in the case of Leucocytozoon spp. (Fecchio et al., Reference Fecchio, Clark, Bell, Skeen, Lutz, De La Torre, Vaughan, Tkach, Schunck, Ferreira, Braga, Lugarini, Wuamiti, Dispoto, Galen, Kirchgatter, Sagario, Cueto, González-Acuña, Inumaru, Sato, Schumm, Quillfeldt, Pellegrino, Dharmarajan, Gupta, Robin, Ciloglu, Yildirim, Huang, Chapa-Vargas, Álvarez-Mendizábal, Santiago-Alarcon, Drovetski, Hellgren, Voelker, Ricklefs, Hackett, Collins, Weckstein and Wells2019b). Hence, further investigations on how haemosporidian respond to climate change at different spatial scales are necessary. In regions with sharp seasonal changes, climate regulates haemosporidian infections at crucial life-cycle stages (haemosporidian development within the dipteran vectors, transmission to their final avian hosts, etc.), and the seasonality of the disease is marked by temperature increases (Valkiūnas, Reference Valkiūnas2005; Schröder and Schmidt, Reference Schröder and Schmidt2008; Garamszegi, Reference Gosling, Dunn, Carrol, Christidis, Fullwood, de Gusmao, Golding, Good, Hall, Kendon, Kennedy, Lewis, McCarthy, McSweeney, Morice, Parker, Perry, Stott, Willett, Allen, Arnell, Bernie, Betts, Bowerman, Brak, Caesar, Challinor, Dankers, Hewer, Huntingford, Jenkins, Klingaman, Lewis, Lloyd-Hughes, Lowe, McCarthy, Miller, Nicholls, Noguer, Otto, van der Linden and Warren2011; Santiago-Alarcon et al., Reference Santiago-Alarcon, Palinauskas and Schaefer2012). For this reason, temperature and humidity are considered strong predictors of haemosporidian prevalence (Stresman, Reference Stresman2010; Garamszegi, Reference Gosling, Dunn, Carrol, Christidis, Fullwood, de Gusmao, Golding, Good, Hall, Kendon, Kennedy, Lewis, McCarthy, McSweeney, Morice, Parker, Perry, Stott, Willett, Allen, Arnell, Bernie, Betts, Bowerman, Brak, Caesar, Challinor, Dankers, Hewer, Huntingford, Jenkins, Klingaman, Lewis, Lloyd-Hughes, Lowe, McCarthy, Miller, Nicholls, Noguer, Otto, van der Linden and Warren2011; Sehgal et al., Reference Sehgal, Buermann, Harrigan, Bonneaud, Loiseau, Chasar, Sepil, Valkiūnas, Iezhova, Saatchi and Smith2011; Fecchio et al., Reference Fecchio, Bell, Bosholn, Vaughan, Tkach, Lutz, Cueto, Gorosito, González-Acuña, Stromlund, Kvasager, Comiche, Kirchgatter, Pinho, Berv, Anciães, Fontana, Zyskowski, Sampaio, Dispoto, Galen, Weckstein and Clark2019a; Chapa-Vargas et al., Reference Chapa-Vargas, Matta, Merino, Santiago-Alarcon and Marzal2020).
Critical transmission windows typically occur when climate variation or land use modifications facilitate the development and dispersion of haemosporidian parasites within avian communities (Brooks and Hoberg, Reference Brooks and Hoberg2007; Møller, Reference Morand and Krasnov2010; Clark et al., Reference Clark, Wells, Dimitrov and Clegg2016, Reference Clark, Clegg, Sam, Goulding, Koane and Wells2018). Recent studies demonstrate that long-term inter-annual and seasonal trends in temperature and precipitation (called bioclimatic variables) influence haemosporidian prevalence, host specificity and distribution within a geographic region (Sehgal et al., Reference Sehgal, Buermann, Harrigan, Bonneaud, Loiseau, Chasar, Sepil, Valkiūnas, Iezhova, Saatchi and Smith2011; Clark et al., Reference Clark, Wells, Dimitrov and Clegg2016; Ferraguti et al., Reference Ferraguti, Hernández-Lara, Sehgal, Santiago-Alarcon, Santiago-Alarcon and Marzal2020; Fecchio et al., Reference Fecchio, Bell, Bosholn, Vaughan, Tkach, Lutz, Cueto, Gorosito, González-Acuña, Stromlund, Kvasager, Comiche, Kirchgatter, Pinho, Berv, Anciães, Fontana, Zyskowski, Sampaio, Dispoto, Galen, Weckstein and Clark2019a). Though common in wild bird communities, haemosporidian infections may represent a potential conservation issue due to unforeseen effects of climate change on parasite–host interactions (Khasnis and Nettleman, Reference Krama, Rantala, Krams, Krams, Cırule and Moore2005; Stresman, Reference Stresman2010). Several factors could potentially influence how haemosporidian infection trends are expressed within avian communities (Benning et al., Reference Benning, LaPointe, Atkinson and Vitousek2002), including potential changes in transmission risk (Huijben et al., Reference Ilgūnas, Bukauskaitė, Palinauskas, Iezhova, Dinhopl, Nedorost, Weissenbacher-Lang, Weissenböck and Valkiūnas2016; Garamszegi, Reference Gosling, Dunn, Carrol, Christidis, Fullwood, de Gusmao, Golding, Good, Hall, Kendon, Kennedy, Lewis, McCarthy, McSweeney, Morice, Parker, Perry, Stott, Willett, Allen, Arnell, Bernie, Betts, Bowerman, Brak, Caesar, Challinor, Dankers, Hewer, Huntingford, Jenkins, Klingaman, Lewis, Lloyd-Hughes, Lowe, McCarthy, Miller, Nicholls, Noguer, Otto, van der Linden and Warren2011), changes in prevalence and coinfection rates (Zamora-Vilchis et al., Reference Zamora-Vilchis, Williams and Johnson2012; Clark et al., Reference Clark, Wells, Dimitrov and Clegg2016), species turnover (Álvarez-Mendizábal et al., Reference Álvarez-Mendizábal, Villalobos, Rodríguez-Hernández, Hernández-Lara, Rico-Chávez, Suzán, Chapa-Vargas and Santiago-Alarcon2021; Clark et al., Reference Clark, Clegg, Sam, Goulding, Koane and Wells2018) and changes in distribution and development thresholds (Marcogliese, Reference Martens, Kovats, Nijhof, de Vries, Livermore, Bradley, Cox and McMichael2008; Paaijmans and Thomas, Reference Pacheco, Cepeda, Bernotiene, Lotta, Matta, Valkiūnas and Escalante2013). For instance, avian malaria (i.e., Plasmodium spp.) prevalence correlates positively with temperature and humidity (Lindsay and Martens, Reference Liverman and O'Brien1998; Benning et al., Reference Benning, LaPointe, Atkinson and Vitousek2002; Valkiūnas, Reference Valkiūnas2005; Stresman, Reference Stresman2010; Garamszegi, Reference Gosling, Dunn, Carrol, Christidis, Fullwood, de Gusmao, Golding, Good, Hall, Kendon, Kennedy, Lewis, McCarthy, McSweeney, Morice, Parker, Perry, Stott, Willett, Allen, Arnell, Bernie, Betts, Bowerman, Brak, Caesar, Challinor, Dankers, Hewer, Huntingford, Jenkins, Klingaman, Lewis, Lloyd-Hughes, Lowe, McCarthy, Miller, Nicholls, Noguer, Otto, van der Linden and Warren2011; Atkinson et al., Reference Atkinson, Utzurrum, LaPointe, Camp, Crampton, Foster and Giambelluca2014). Temperature increases stimulate the reproduction of parasites and vectors (Garamszegi, Reference Gosling, Dunn, Carrol, Christidis, Fullwood, de Gusmao, Golding, Good, Hall, Kendon, Kennedy, Lewis, McCarthy, McSweeney, Morice, Parker, Perry, Stott, Willett, Allen, Arnell, Bernie, Betts, Bowerman, Brak, Caesar, Challinor, Dankers, Hewer, Huntingford, Jenkins, Klingaman, Lewis, Lloyd-Hughes, Lowe, McCarthy, Miller, Nicholls, Noguer, Otto, van der Linden and Warren2011), while proximity to freshwater sources fosters the reproduction of anopheline mosquitoes (Culicidae) responsible for Plasmodium transmission (Krama et al., Reference Kurane2015; Ferraguti et al., Reference Ferraguti, Hernández-Lara, Sehgal, Santiago-Alarcon, Santiago-Alarcon and Marzal2020). Although there is limited information on the temperature thresholds for most of the species of this genus, the distribution and abundance of its vectors are directly associated with temperature. Upper limits may reduce vector and parasite developmental rates and even eliminate them from some geographic areas where extreme (+2°C) increases in temperature are predicted, whereas the opposite might be true for areas with current temperate climates (Loiseau et al., Reference Lotta, Pacheco, Escalante, González, Mantilla, Moncada, Adler and Matta2013; Atkinson et al., Reference Atkinson, Utzurrum, LaPointe, Camp, Crampton, Foster and Giambelluca2014; Liao et al., Reference Lindsay and Martens2017). Similarly, Haemoproteus prevalence correlates positively with temperature (Valkiūnas, Reference Valkiūnas2005; Zamora-Vilchis et al., Reference Zamora-Vilchis, Williams and Johnson2012), as the distribution and abundance of its vectors (ceratopogonids and hippoboscids) are directly associated with temperature increases and agricultural development (Friend and Franson, Reference Fuller, Bensch, Müller, Novembre, Pérez-Tris, Ricklefs, Smith and Waldenström1999; Rooyen et al., Reference Rooyen, Lalubin, Glaizot and Christe2013). In comparison, Leucocytozoon is better adapted to colder climates and its prevalence increases at higher latitudes (Valkiūnas, Reference Valkiūnas2005; Ramey et al., 2014; Smith et al., Reference Smith, Van Hemert and Merizon2016) and with increasing altitude (over 2200 masl) (Galen and Witt, Reference Garamszegi2014; Lotta et al., Reference Mandrekar2016; Fecchio et al., Reference Fecchio, Clark, Bell, Skeen, Lutz, De La Torre, Vaughan, Tkach, Schunck, Ferreira, Braga, Lugarini, Wuamiti, Dispoto, Galen, Kirchgatter, Sagario, Cueto, González-Acuña, Inumaru, Sato, Schumm, Quillfeldt, Pellegrino, Dharmarajan, Gupta, Robin, Ciloglu, Yildirim, Huang, Chapa-Vargas, Álvarez-Mendizábal, Santiago-Alarcon, Drovetski, Hellgren, Voelker, Ricklefs, Hackett, Collins, Weckstein and Wells2019b). These conditions usually have high humidity, and precipitation and coincide with lower temperatures which limit Haemoproteus and Plasmodium infections but provide suitable habitat for the larvae of the black fly (Simulidae) vectors of Leucozoonoid infections in birds (Forrester and Greiner, Reference Friend and Franson2008; Harrigan et al., Reference Hellgren, Waldenström and Bensch2014; Illera et al., 2008; Ferreira et al., Reference Forrester, Greiner, Atkinson, Thomas and Hunter2020). These parasites undergo sporogony (the asexual reproduction stage where the bird-infective forms of haemosporidian parasites are formed) in temperatures between 15 and 20°C, meaning Leucozoonoid parasites have the lowest temperature threshold for transmission of the three haemosporidian genera (Valkiūnas, Reference Valkiūnas2005).
Climate change predictions for Mexico by 2100 estimate temperature increases of 2.5–3.5°C and precipitation decreases of 5–10% all over the country (Gosling et al., Reference Grech, Manzo, Epele, Laurito, Claverie, Ludueña-Almeida, Miserendino and Almirón2019; Cavazos et al., Reference Cavazos, Salinas, Martínez, Colorado, de Grau, Prieto González, Conde Álvarez, Quintanar Isaías, Santana Sepúlveda, Romero Centeno, Maya Magaña, Rosario de La Cruz, Ayala Enríquez, Carrillo Tlazazanatza, Santiesteban and Bravo2013). These trends have had substantial impacts on mountain habitats across the Trans-Mexican Volcanic Belt, forcing their migration by several hundred meters to higher elevations (Jiménez-García et al., Reference Kamiya, O'Dwyer, Nakagawa and Poulin2021). Nationwide, the average temperature has risen by 0.85°C since the 1960s (IPCC, Reference Jiménez-García, Li, Lira-Noriega and Peterson2014). Governmental mitigation strategies work under two essential assumptions: (1) Mexico commits to reduce greenhouse gas emissions and to contribute to maintaining a global average temperature increase under 2.4°C; or (2) no reductions of emissions occur, and the average global temperature shoots over 4.9°C (SEMARNAT-INECC, 2016). Following the Representative Concentration Pathways (RCP) adopted by the Intergovernmental Panel for Climate Change (Wayne, Reference Wayne2013; IPCC, Reference Jiménez-García, Li, Lira-Noriega and Peterson2014), these assumptions correspond to 2 specific climate change scenarios: scenario RCP 4.5, referred to as an ‘optimistic’ climate change scenario, where greenhouse emissions are stabilized under 650 ppm shortly after 2100 and a global temperature increase up to 2–3°C (Smith and Wigley, Reference Smith and Wigley2006; Clarke et al., Reference Clarke, Edmonds, Jacoby, Pitcher, Reilly and Richels2007; Wise et al., Reference Wise, Calvin, Thomson, Clarke, Bond-Lamberty, Sands, Smith, Janetos and Edmonds2009; Thomson et al., Reference Thomson, Calvin, Smith, Kyle, Volke, Patel, Delgado-Arias, Bond-Lamberty, Wise, Clarke and Edmonds2010; IPCC, Reference Jiménez-García, Li, Lira-Noriega and Peterson2014); and RCP 8.5, labelled as the ‘business as usual, worst-case scenario’, where global failure to curb warming by greenhouse emissions by 2100 will lead to a global temperature increase of 4.5°C by 2100 (Riahi et al., Reference Riahi, Grübler and Nakicenovic2007, Reference Riahi, Rao, Krey, Cho, Chirkov, Fischer, Kindermann, Nakicenovic and Rafaj2011; IPCC, Reference Jiménez-García, Li, Lira-Noriega and Peterson2014).
The objective of this study was to identify the most influential bioclimatic predictor variables for the haemosporidian prevalence documented in different avian communities in central to eastern Mexico and to identify the likely trends of their effects on said prevalence over the next 50 years under two contrasting climate change scenarios. Specifically, we associated the recorded haemosporidian prevalence in our study sites with their temperature and humidity conditions and projected them 50 years into the future under the two climate change scenarios described above. Since haemosporidian prevalence is mainly driven by temperature and humidity, prediction models might provide potential shifts in distributional trends of infections in response to climate change (particularly across an altitudinal gradient), comparable to what has been reported in Hawaii, Europe and Africa (Garamszegi, Reference Gosling, Dunn, Carrol, Christidis, Fullwood, de Gusmao, Golding, Good, Hall, Kendon, Kennedy, Lewis, McCarthy, McSweeney, Morice, Parker, Perry, Stott, Willett, Allen, Arnell, Bernie, Betts, Bowerman, Brak, Caesar, Challinor, Dankers, Hewer, Huntingford, Jenkins, Klingaman, Lewis, Lloyd-Hughes, Lowe, McCarthy, Miller, Nicholls, Noguer, Otto, van der Linden and Warren2011; Atkinson et al., Reference Atkinson, Utzurrum, LaPointe, Camp, Crampton, Foster and Giambelluca2014). Additionally, climate change projections could show potential distributional shifts of the climate currently occupied by avian haemosporidian in the study region, representing potential new areas of the occurrence of these parasites. We predicted increasing prevalence at higher elevations and decreasing prevalence at lowlands, where increases in temperature of already hot environments and lower humidity are likely to interrupt the life cycle of Diptera vectors and haemosporidians.
Methods
Study region and sampling sites
The study region includes the states of San Luis Potosí and Veracruz, in central to eastern Mexico, where three physiographic regions converge: the Mexican Plateau (MP), the Sierra Madre Oriental (SMO) and the Gulf of Mexico's Coastal Plain (GCP). Altitude, average annual temperatures, and the mean annual precipitation range from sea level to 3700 masl, 32° to 8°C and 2000 to 50 mm (CONABIO, 2008; INEGI, 2008). We captured and obtained blood samples from 1273 birds across 19 geographic locations in this region. The sampling design focused on covering the climate variation present in the region based on temperature and precipitation. Sampling considered the major vegetation habitat types in the region, including Rosetophyllous desert shrubland (RDS), Microphyllous desert shrubland (MDS), Yucca shrubland (known as izotal) (YS), pasturelands (PL) and livestock areas (LSA), mesquite shrubland (MS), Mexican pinyon forest (MPF), pine forest (PF), pine-oak forest (POF), oak-pine forest (OPF), perennial forest (PER), tropical sub-deciduous forest (TSD), tropical deciduous forest (TDF) and montane cloud forest (MCF) (Rzedowski, Reference Rzedowski1965). Birds were captured via mist-netting from May to September of 2017 and 2018. These are the warmest and most humid months and thus coincide with the reproductive season of resident bird populations and the peak of infection prevalence associated with increased vector activity (Ham-Dueñas et al., Reference Harrigan, Sedano, Chasar, Chaves, Nguyen, Whitaker and Smith2017; Hernández-Lara et al., Reference Hijmans, Cameron, Parra, Jones and Jarvis2017; Rodríguez-Hernández et al., Reference Rodríguez-Hernández, Álvarez-Mendizábal, Chapa-Vargas, Escobar, González-García and Santiago-Alarcon2021). Every captured bird was ringed, measured, weighed and released according to guidelines described in the Bird Ringing Station Manual (Busse and Meissner, Reference Busse and Meissner2015). In total, 10–30 μL of blood was obtained by brachial venipuncture. In the case of hummingbirds and other small species, blood was collected by nail clipping. Blood smears were prepared with approximately 1–2 μL of the collected blood samples and fixed in situ using absolute methanol for 5 min to preserve the samples from degradation. The rest of the blood was stored in 1.5 mL plastic tubes for subsequent use for molecular analysis (Santiago-Alarcon and Carbó-Ramírez, Reference Santiago-Alarcon and Carbó-Ramírez2015).
Microscopy and molecular analyses
Blood samples were examined for haemosporidian parasites with microscopy and three different PCR molecular protocols that amplify fragments of the mtDNA cytochrome b gene of different sizes (Beadell et al., Reference Beadell, Gering, Austin, Dumbacher, Peirce, Pratt, Atkinson and Fleischer2004; Hellgren et al., Reference Hernández-Lara, González-García and Santiago-Alarcon2004; Bell et al., Reference Bell, Weckstein, Fecchio and Tkach2015; Pacheco et al., Reference Patz and Reisen2018), in order to increase the probability of recovering all potential infections. This way, we obtained information on the genetic diversity of the haemosporidian species present in the samples and detected parasitic infections with lower parasitaemia or that might have passed undetected by microscopic analysis and by different molecular protocols (Santiago-Alarcon and Carbó-Ramírez, Reference Santiago-Alarcon and Carbó-Ramírez2015; Rodríguez-Hernández et al., Reference Rodríguez-Hernández, Álvarez-Mendizábal, Chapa-Vargas, Escobar, González-García and Santiago-Alarcon2021).
DNA samples were processed first using the PCR protocol proposed by Pacheco et al. (Reference Patz and Reisen2018); this protocol produces the longest mtDNA cyt b fragment. Each reaction contained a total volume of 25 μL, consisting of 5 μL sample DNA at 30–50 ng μL−1, 6.5 μL injectable water, 12.5 μL PCR buffer (Invitrogen Platinum™ Green Hot Start PCR Master Mix, Thermo Fisher Scientific, Waltham MA, US) and 0.5 μL of each primer. In the first run, we used primers AE974-EF and AE299-ER to amplify a 1773 bp fragment under the following conditions: initial denaturalization at 94°C for 5 min, 40 cycles of denaturalization at 94°C for 30 s, annealing at 45°C for 2 min and extension at 72°C for 2 min, and a final extension step at 72°C for 10 min. The first run product was used for a second run to amplify an 1109 bp fragment, adding to the reaction mix 1.6 μL of primer AE064-IF and 0.2 μL of the AE066-IR primer, running the reaction for 35 cycles and an annealing temperature of 56°C for 30 s. Negative samples from the first protocol were tested again for haemosporidian infection with the PCR protocol proposed by Beadell et al. (Reference Beadell, Gering, Austin, Dumbacher, Peirce, Pratt, Atkinson and Fleischer2004) to amplify a 533 bp fragment of cyt b using primers 3760F and 4292Rw2. Reactions were run using a denaturalization temperature of 94°C for 5 min, and 35 cycles of denaturalization at 94°C for 45 s, annealing at 54°C for 45 s and extension at 72°C for 45 s, with a final extension step at a temperature of 72°C for 10 min. Again, the resulting negatives were tested for haemosporidian infection using the Hellgren et al. (Reference Hernández-Lara, González-García and Santiago-Alarcon2004) PCR protocol. Primers used were HaemNFI and HaemNR3 to obtain a 580 bp on the first run. For the following nested PCR, corresponding primers HaemF and HaemR2 amplify a fragment of approximately 524 nucleotides for Plasmodium spp. and Haemoproteus spp. Reactions were run using a denaturalization temperature of 94°C for 3 min, with 20 cycles of denaturalization at 94°C for 30 s, annealing at 50°C for 30 s, extension of 72°C for 45 s for the first run and 35 cycles for the second, with a final extension period of 72°C for 10 min. To test for Leucocytozoon infections, we used primers HaemFL and HaemR2L on 2 μL of the products obtained from the second Pacheco PCR run, the products of the first Beadell PCR run, and the products from the first Hellgren PCR run as templates. Temperature conditions for the Leucocytozoon runs were those previously described for the first Hellgren PCR run. Combining these three methods allowed us to reduce false negatives (Beadell et al., Reference Beadell, Gering, Austin, Dumbacher, Peirce, Pratt, Atkinson and Fleischer2004; Hellgren et al., Reference Hernández-Lara, González-García and Santiago-Alarcon2004; Pacheco et al., Reference Patz and Reisen2018). The amplified cytochrome b fragments obtained with these analyses were sent to Macrogen Korea for sequencing. Sequence data have been approved by the NCBI and deposited into GenBank (accession numbers MZ604564, MZ604565, MZ604566, MZ604567, MZ604568, MZ604569, MZ604570, MZ604571, MZ604572, MZ604573, MZ604574, MZ604575, MZ604576, MZ604577, MZ604578, MZ604579 and MZ604580).
Haemosporidian prevalence estimates
We could not obtain appropriate sample sizes for environmental modelling for each lineage or genera; most of these lineages were present only once in the sample (Table 1). Therefore, we report a general haemosporidian prevalence rate without making a distinction among the haemosporidian genus. To assess the variability of haemosporidian prevalence with habitat type, we ran a generalized linear mixed model (GLMM) analysis using the function ‘glmer’ implemented in the statistical package ‘lme4' (Bates et al., Reference Bates, Mächler, Bolker and Walker2015) in R software v.4.0.3 (R Core-Team, Reference Crosskey, Lane and Crosskey2013). The model was constructed using the binomial distribution (logit link), with habitat type (vegetation) as the fixed predictor for haemosporidian prevalence and the avian host species as a random variable.
Table 1. List of sequenced haemosporidian lineages and respective sample size per host species, study site and corresponding habitat type

Operational climatic units
To increase our sampling area and obtain the best possible climate characterization for the observed haemosporidian prevalence rates, we devised a method based on previous modelling approaches, where sampling locations are used to train the MaxEnt modelling algorithm to identify the relationship between vegetation communities where the haemosporidian are present and bioclimatic predictor variables (Sehgal et al., Reference Sehgal, Buermann, Harrigan, Bonneaud, Loiseau, Chasar, Sepil, Valkiūnas, Iezhova, Saatchi and Smith2011; Ponce-Reyes et al., Reference Ponce-Reyes, Plumptre, Segan, Ayebare, Fuller, Possingham and Watson2012, Reference Prieto-Torres, Rojas-Soto, Lira-Noriega, Santiago-Alarcon and Marzal2017). For each of our 19 sampling locations, we calculated haemosporidian prevalence and extracted the associated bioclimatic data from WorldClim environmental layers (see below) at a spatial resolution of 30″ of arc (~1 km2) with ArcMap 10.3. Then, we assigned the study sites into polygons concerning site proximity and vegetation type. These units were labelled as operational climatic units (OCUs). The demarcation of each OCU rests on the following assumptions: (1) each vegetation type relates to well-defined climatic trends; (2) climate does not change drastically within a 15 km radius around the original sampling sites (averaged climate values determined around each sample site to define each OCU plus vegetation polygons), and (3) haemosporidian prevalence remains relatively constant within OCUs and would be comparable due to climate similarity. Each resulting polygon was converted into a 1 km2 point grid using environmental data from the WorldClim bioclimatic layers and the average prevalence obtained from our haemosporidian sampling sites. We randomly selected 5% data points from each polygon (see Ponce-Reyes et al., Reference Ponce-Reyes, Plumptre, Segan, Ayebare, Fuller, Possingham and Watson2012) as experimental haemosporidian presence data to run the models in MaxEnt (Hijmans et al., Reference Huijben, Schaftenaar, Wijsman, Paaijmans, Takken, Takken and Knols2005) (Fig. 1). Given that there is limited information on environmental thresholds for Haemoproteus, Plasmodium and Leucocytozoon morphospecies and the environmental requirements of most lineages are largely unknown, we grouped them and associated the general haemosporidian prevalence data for each OCU as an indirect response of environmental suitability for these parasites.

Fig. 1. Extent of the study region. Study sites are scattered across the states of San Luis Potosí and Veracruz, Mexico, and occur under a variety of climate conditions. To homogenize our sample data and increase the number of sampling locations, we grouped our localities on operational climate units (OCU) which facilitated the analysis and extraction of associated environmental data for each area.
Climatic variables
To characterize the climate associated with the prevalence of each study site, we used 19 bioclimatic variables (Table 2) derived from an interpolation of average monthly temperature and rainfall values obtained from weather stations and representing annual trends (Hijmans et al., Reference Huijben, Schaftenaar, Wijsman, Paaijmans, Takken, Takken and Knols2005). We clipped each environmental grid using the OCU polygon. As an exploratory analysis to relate the potential effect of bioclimatic variables on the prevalence recorded at each location, we extracted from the clipped grids the climatic information from the precise localities where the prevalence was recorded. Then we ran a regression analysis with the MiniTab 17.1.0 Statistical Software (Ryan et al., Reference Ryan, Ryan and Joiner2013) to explore the potential effect of bioclimatic variables on the prevalence recorded in each location.
Table 2. Worldclim's bioclimatic variables list

The environmental variables in bold correspond to the ones used to run the final models. Variables marked with an asterisk were those variables omitted to avoid overfitting of the models.
Next, to select the climatic variables for the followinganalysis based on ecological niche modelling, we used the same set of 19 bioclimatic variables from the Worldclim project (Hijmans et al., Reference Huijben, Schaftenaar, Wijsman, Paaijmans, Takken, Takken and Knols2005). We first excluded the four layers that combine precipitation and temperature information into the same layer (mean temperature of wettest quarter, mean temperature of driest quarter, precipitation of warmest quarter and precipitation of coldest quarter) since these present spatial anomalies in the form of odd discontinuities between neighbouring pixels (Escobar et al., Reference Fecchio, Wells, Bell, Tkach, Lutz, Weckstein, Clegg and Clark2014). Then we applied a jackknife test (Cobos et al., Reference Cobos, Peterson, Osorio-Olvera and Jiménez-García2019) automatically generated in preliminary modelling procedures in MaxEnt (see next section for details). For this preliminary modelling, we used 5% random points previously defined from the OCU point grids (see above) and the remaining 15 variables. Then, we selected those variables that contributed the most to each model. Nine were the predictor variables with the highest gain (highest contribution to the model when used in isolation) from the preliminary models for each OCU (Table 2), used to run the final models.
Climate characterization modelling
For the final modelling, we used MaxEnt (Phillips et al., Reference Ponce-Reyes, Reynoso-Rosales, Watson, Jeremy VanDerWal, Fuller, Pressey and Possingham2006) ver. 3.4.1, a presence-only distribution-modelling algorithm to characterize the climatic conditions present in the OCUs. Please note that we moved from the traditional ‘niche’ modelling to ‘climate’ modelling in MaxEnt following Ponce-Reyes et al. (Reference Ponce-Reyes, Plumptre, Segan, Ayebare, Fuller, Possingham and Watson2012) and Ponce-Reyes et al. (Reference Prieto-Torres, Rojas-Soto, Lira-Noriega, Santiago-Alarcon and Marzal2017). To validate the models, we used 10-fold cross-validation – a technique to evaluate predictive models by partitioning the original sample into a training set to train the model and a test set to evaluate it – and calculated the mean area under the receiver operating characteristic (ROC) curve (Peterson et al., Reference Phillips, Anderson and Schapire2008; Mandrekar, Reference Marcogliese2010). MaxEnt's model performance is automatically assessed using the ROC curve (Phillips et al., Reference Ponce-Reyes, Reynoso-Rosales, Watson, Jeremy VanDerWal, Fuller, Pressey and Possingham2006). However, several problems are associated with this test (Lobo et al., Reference Loiseau, Harrigan, Bichet, Julliard, Garnier, Lendvai, Chastel and Sorci2013; Peterson et al., Reference Phillips, Anderson and Schapire2008); therefore, we used the partial ROC test as an alternative, a modification proposed by Peterson et al. (Reference Phillips, Anderson and Schapire2008), allocating different weights to commission and omission errors. Partial ROCs were calculated using the NicheToolbox software package (Osorio-Olvera et al., Reference Paaijmans, Thomas, Takken and Koenraadt2020). A presence/absence map of haemosporidian prevalence climate suitability was obtained by applying a binary threshold (10 percentile training presence) to the projection of probability distribution. Climate change projection models for the haemosporidian probability distributions were based on RCP scenarios 4.5 and 8.5 and projected to 50 years into the future (2070). This allowed contrasting potential changes in the distribution of present-day haemosporidian prevalence between a moderate scenario (+2–3°C temperature increase) and a worst-case scenario (+4.5°C temperature increase).
Predictions were categorized into three classes: (1) climate gain, where the models predict newly suitable areas for haemosporidian parasites, (2) climate deficit, no longer suitable areas for haemosporidians under climate change scenarios; and (3) climate continuity, suitable areas for haemosporidian parasites that are expected to remain suitable under climate change scenarios. These classes represent the areas where the models predict the climatic conditions associated with the original haemosporidian prevalence under climate change scenarios (RCP 4.5 and RCP 8.5) for 2070.
Results
Haemosporidian prevalence
Avian haemosporidian infection was confirmed in all 19 sampling locations. Overall, haemosporidian prevalence was 58.6% (CI 55.8–61.3, n = 1266). By state, prevalence was 82.9% (CI 79.8–85.7, n = 659) in San Luis Potosí and 32.3% (CI 28.6–36.2, n = 607) in Veracruz. Haemoproteus was the most common infection recorded in the study region, with a total prevalence of 19.5% (CI 17.4–21.8, n = 247), followed by Plasmodium infections with a prevalence of 15.6% (CI 13.6–17.7, n = 197). Leucocytozoon and co-infections were found mostly in Veracruz, with an estimated prevalence of 5.1% (CI 3.9–6.4, n = 64) and 2.6% (CI 1.8–3.6, n = 33), respectively. Out of the total infected individuals, a prevalence of 21.1% (CI 18.9–23.4, n = 267) detected by PCR analysis belonged to unidentified haemosporidian infections; the haemosporidian DNA recovered from these samples was too degraded for sequencing, which resulted in our inability to identify the genera behind these infections.
Within San Luis Potosí, infections caused by Haemoproteus represented a prevalence of 24.6% (CI 21.3–28.1, n = 162), while estimated Plasmodium prevalence was 17.3% (CI 14.5–20.4, n = 114), and only three samples tested positive for Leucocytozoon (0.5%, CI 0.1–1.3). In addition, 267 infected samples from San Luis Potosí (40.5% prevalence, CI 36.7–44.4) could not be identified to the genus level by molecular analysis. For Veracruz, Plasmodium infections were the most common, with 12.5% (CI 10.0–15.4, n = 76). Haemoproteus had a prevalence of 9.7% (CI 7.5–12.4, n = 59), and Leucocytozoon 4.6% (CI 3.1–6.6, n = 28). In contrast to San Luis Potosí, a small percentage of Veracruz samples matched for co-infections, where a 4.9% prevalence corresponded to Haemoproteus/Leucocytozoon (CI 3.2–7.1, n = 26) co-infections, and 1.2% prevalence (CI 0.5–2.4, n = 7) belonged to Plasmodium/Leucocytozoon co-infections. Lastly, only one infected sample (0.7% prevalence) from Veracruz could not be identified at the genus level.
Haemosporidian prevalence varied among study sites (Fig. 2, Table 3). The highest prevalence occurred in 3 of the semi-arid habitats (LSA, MDS and RDS). In contrast, the lowest prevalences were found in three of the most humid habitat types (MCF, TDF, TSD) and the arid habitats (PL and YS) we surveyed. Above-average prevalence occurred at PERm and MSm sites (Fig. 2, Table 3). GLMM results revealed that haemosporidian prevalence concerning habitat type varied significantly among vegetation communities (residual variance = 1.408). Part of this variability can be explained by the effects of the avian hosts (variance of random variable = 1.564). The model did not present overdispersion (ϕ = 0.7369) (Appendix, Table A1).

Fig. 2. Haemosporidan prevalence per representative habitat type, from the most humid to the most arid vegetation communities, is estimated by an additive generalized linear model using binomial distribution and logistic link function. Habitat types are as follow: MCF (montane cloud forest), TDF (tropical deciduous forest), TSD (tropical sub-deciduous forest), PERm (mature perennial forest), PERd (degraded perennial forest), MPF (Mexican pinyon forest), PF (pine forest), POF (pine-oak forest), OPF (oak-pine forest), MSm (mature mesquite-dominated shrub), MSd (degraded mesquite-dominated shrub), RDS (Rosetophyllous desert shrubland), MDS (Microphyllous desert shrub), LSA (livestock area), PL (pastureland), YS (Yucca shrubland). Error bars represent ±1 s.e.m. The highest prevalence trends are indicated with an asterisk, while the lowest prevalence trends are indicated with a tilde.
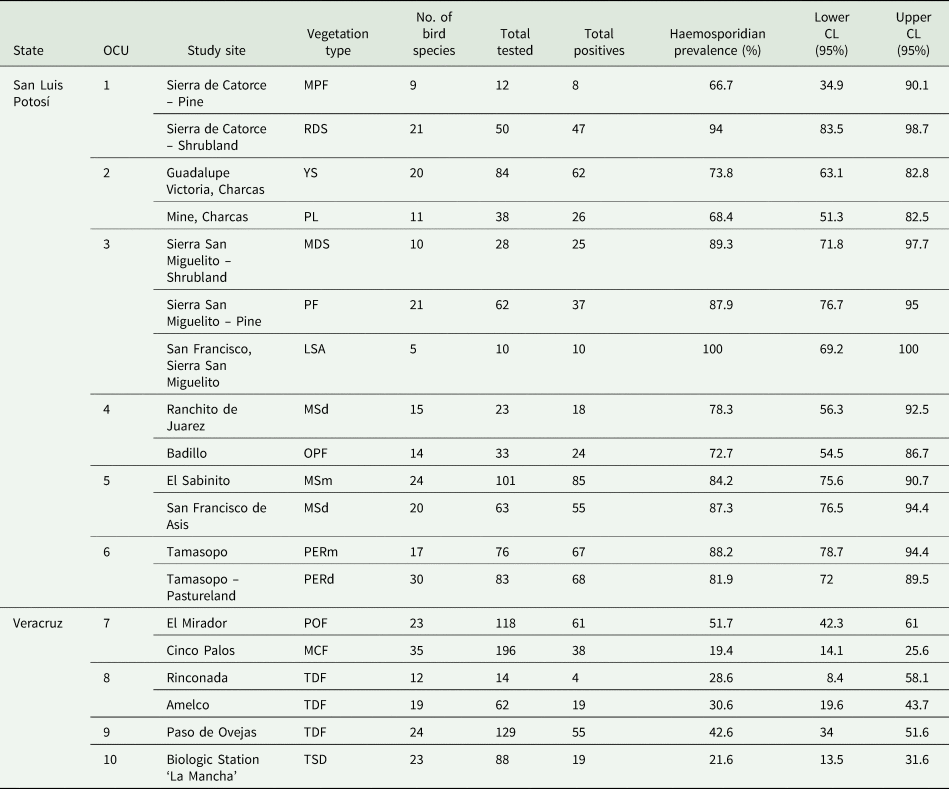
Table 3. Haemosporidian prevalences by study site
Climate correlation and potential distribution models
Among all variables, the association of annual temperature range with the observed total prevalence showed a positive statistical significance (P = 0.049). There was a negative non-significant trend of mean temperature diurnal range on total prevalence (P = 0.090). We also recorded significant positive associations between local haemosporidian prevalence and mean temperature diurnal range (P = 0.019), and temperature annual range (P = 0.027). There were negative non-significant trends for minimum temperature of coldest month (P = 0.076), annual precipitation (P = 0.091) and precipitation of wettest month (P = 0.092). The jackknife analysis yielded trends suggesting similar associations among the bioclimatic variables and haemosporidian prevalence as those recorded through the regression analysis. Also, it added isothermality (variation quotient between the diurnal temperature range and the annual temperature range), temperature seasonality, mean temperature of the coldest quarter and precipitation seasonality as predictors. Therefore, nine bioclimatic variables were considered for climate modelling. Models predicted the optimal climate conditions in which haemosporidian prevalence could be inferred within 50 km of each OCU. Our resulting mean partial ROC values for all models ranked between 0.913 and 1.999 for RCP 4.5 and between 1.036 and 1.999 for RCP 8.5, indicating an excellent prediction capability within our OCUs and confirming the utility of these models for making projections under climate change scenarios (Table 4).
Table 4. Model validation, geographical zones and number of study sites contained per operational climate units

We used a random test percentage of 20% in MaxEnt to train the models. The area under the curve (AUC) analysis shows the training data test values provided by MaxEnt at the end of the run. These values show the ‘goodness of fit’ (predictive power) of the model. Additionally, we ran an independent receiver operating characteristics (ROC) analysis to assess the predictive power for the climate change prediction scenarios. For AUC, a mean value above 0.70 indicates a very good model, while for pROC analysis, values closer to 2 indicate good sensitivity of the models.
The OCUs can be grouped into three climate categories: semi-arid OCUs (1–5), temperate OCUs (6 and 7) and tropical OCUs (8–10) (Table 5). The general predicted trend for all models shows that between 60 and 100% of the area of suitable climate conditions for the recorded haemosporidian prevalence would be lost by 2070 in RCP 4.5 and RCP 8.5 scenarios (Table 6). The potential permanence or continuity of suitable haemosporidian climate varies between OCUs. In the ‘optimistic’ scenario (RCP 4.5), current climate conditions are expected to be less affected at higher elevations, as seen in the projections for OCUs 4, 6 and 7, but less so under RCP 8.5, and it improves for some of the same OCUs, such as 4 and 6 (Table 6, Fig. 3).

Fig. 3. Mapped prediction of suitable climatic conditions associated with haemosporidian prevalence for the 2070 decade under climate change scenarios RCP 4.5 and 8.5. The white contour corresponds to the 50 km buffer applied for the models, and the coloured areas represent the different predictions regarding suitable climatic habitat for the observed haemosporidian prevalences under current climate trends: red grid cells represent a potential deficit of suitable climatic habitat under climate change scenarios RCP 4.5 and 8.5, yellow grid cells represent the area of climatic habitat that will potentially continue despite the effects of climate change, and the blue grid cells represent the area of climatic habitat added. The black contours within the buffer from which the coloured areas stem representing the polygons of each OCU.
Table 5. Climate categorization of the operational climate units (OCU), descriptive climate type and Köppen climate group key

Table 6. Climate projections for all operational climate units (OCU) under representative concentration pathway scenarios 4.5 and 8.5

Each percentage represents the estimated area reduction (deficit), expansion (gain) and continuity of the distributions of suitable climate associated with haemosporidian prevalence.
For the semi-arid OCUs (1–5), climate projections predict the loss of suitable climate distribution in both scenarios, ranging from 71 to 100% in the RCP 4.5 scenario and 50.8 to 100% in the RCP 8.5 scenario. OCUs 2 and 3 show a 100% change of suitable climate distribution prediction in both scenarios. Both climatic units are in the physiographic region of the Mexican Plateau in San Luis Potosí, and OCU2 contains the driest survey sites (Charcas), with some of the lowest haemosporidian prevalence recorded in the study for that region. The complete change of haemosporidian's suitable climate is in line with the expected increases in temperature and decreases in precipitation, affecting arid climates under both RCP scenarios (Table 6).
In temperate climatic units, the OCU6 (Tamasopo) presented a higher decrease of suitable climate for the observed haemosporidian prevalence under the RCP 4.5 scenario (−72%) and less change (42.8%) under the RCP 8.5 scenario. Interestingly, predictions for the OCU7 (Mirador-Cinco Palos) showed that under the RCP 4.5 scenario, the entirety of haemosporidian prevalence suitable climate could potentially continue to exist in 50 years. Conversely, under the projections for the RCP 8.5 scenario, 97.3% of this suitable climate could be lost. The study sites contained in the OCU7 correspond to the physiographic region of Sierra Madre Oriental. They include the most humid sites of the study, with the highest combined haemosporidian prevalence for the state of Veracruz (Table 3, Fig. 2). The OCUs also showed the highest percentage of climate continuity for 2070: 27.8–100% under the RCP 4.5 scenario and 2.7–31.7% under the RCP 8.5 scenario, as well as a small geographic expansion (gain: 0.1–25.5%) of suitable climate areas for haemosporidian presence on the western slopes of the Sierra Madre Oriental under RCP 8.5 scenario (Table 6, Fig. 3).
The last climate category corresponds to the tropical OCUs 8–10, located in the Gulf of Mexico Coastal Plain. Climate projections for OCU8 (Rinconada-Amelco) under the RCP 4.5 scenario showed decreased suitable habitat reaching 60.7% and 72.9% under RCP 8.5. For OCU9 (Paso de Ovejas), the loss of suitable habitat reaches close to 100% for both scenarios and a minor gain under RCP 4.5 scenario of 3.7% (Table 6). OCU10 (La Mancha) is predicted to lose between 69 and 73.7% of haemosporidian prevalence suitable habitat in scenarios RCP 4.5 and RCP 8.5, respectively. However, it could have a suitable climate gain of over 20% under both climate change scenarios. These potential increases in suitable climate represent only a small percentage; however, it becomes important compared to the areas of predicted suitable habitat loss.
Discussion
A recent assessment of haemosporidian infection at the global scale showed that key drivers of infection are particular for each region (Fecchio et al., Reference Ferraguti, Martínez-de la Puente, Bensch, Roiz, Ruiz, Duarte, Soriguer and Figuerola2021). Our study contributes additional, detailed information pertaining to effects of climate on infection patterns within the northern Neotropical region and implications for future climate change scenarios. We expected that climate would affect the distribution of haemosporidian communities and found that temperature was the main driving bioclimatic factor for these parasite–vector–host associations for the region and the scale of the study. In some cases, however, variables related to precipitation were the most important (Table 2), particularly to the potential geographic expansion of suitable climate areas for haemosporidian presence on the western slopes of the Sierra Madre Oriental. In general, it became evident that under both climate change scenarios – RCP 4.5 and RCP 8.5 – a range of 50–100% of the current climate distribution that favours haemosporidian prevalence could be lost by 2070. The projected distribution of remaining suitable haemosporidian climate and potential newly suitable areas converge around higher elevation habitats in 5 of our climatic units (OCUs 4–8) (Fig. 3). Rather than modelling around individual sites, we clustered our survey sites into OCUs based on shared climate characteristics due to proximity to better visualize the distribution trends obtained from our climate projections.
The results indicate that haemosporidian prevalence could change significantly in the study region. However, these results do not necessarily mean that birds and their parasite communities would be deeply modified; what we can suggest is that climate change could potentially shift the dynamic of infections and the community compositions. Fecchio et al. (Reference Ferraguti, Martínez-de la Puente, Bensch, Roiz, Ruiz, Duarte, Soriguer and Figuerola2021) suggested that haemosporidian infection probabilities and prevalence rates do not emerge from the effects of global climate but from region-scale climate and habitat variations. Therefore, although we do not know the degree of the modifications that could occur based on our models, if they were to be profound, the haemosporidian, their vectors and the birds could be affected to the same degree.
As previously mentioned, the arid and semi-arid ecosystems of central-northwestern Mexico occupy more than 50% of the national territory and are home to diverse communities of flora and fauna (Cavazos et al., Reference Cavazos, Salinas, Martínez, Colorado, de Grau, Prieto González, Conde Álvarez, Quintanar Isaías, Santana Sepúlveda, Romero Centeno, Maya Magaña, Rosario de La Cruz, Ayala Enríquez, Carrillo Tlazazanatza, Santiesteban and Bravo2013; SEMARNAT, 2016). Climate change will accelerate the desertification process in this region, and the local biodiversity will face resource limitation problems (mainly water), changes in ecological functionality and population decreases (Liverman and O'Brien, Reference Lobo, Jiménez-Valverde and Real1991; Whitford and Duval, Reference Whitford, Duval, Whitford and Duval2019). For temperate and tropical ecosystems like those found in Veracruz, climate change scenarios show potential trends of haemosporidian suitable climate deficit related to the temperature increases and shifts in the local precipitation regimes. However, there is also the possibility that some of this suitable haemosporidian climate could remain in some areas at higher elevations. Also, in some areas, the climate could become suitable for haemosporidian prevalence at the same levels that we found nowadays in our surveys. These findings are consistent with other studies focusing on haemosporidian prevalence in avian communities of Hawaii, Australia, Europe and Africa (Benning et al., Reference Benning, LaPointe, Atkinson and Vitousek2002; Garamszegi, Reference Gosling, Dunn, Carrol, Christidis, Fullwood, de Gusmao, Golding, Good, Hall, Kendon, Kennedy, Lewis, McCarthy, McSweeney, Morice, Parker, Perry, Stott, Willett, Allen, Arnell, Bernie, Betts, Bowerman, Brak, Caesar, Challinor, Dankers, Hewer, Huntingford, Jenkins, Klingaman, Lewis, Lloyd-Hughes, Lowe, McCarthy, Miller, Nicholls, Noguer, Otto, van der Linden and Warren2011; Zamora-Vilchis et al., Reference Zamora-Vilchis, Williams and Johnson2012; Paaijmans and Thomas, Reference Pacheco, Cepeda, Bernotiene, Lotta, Matta, Valkiūnas and Escalante2013; Atkinson et al., Reference Atkinson, Utzurrum, LaPointe, Camp, Crampton, Foster and Giambelluca2014), where the temperature was the main driving factor behind the dispersion and transmission of haemosporidian infections in birds. The main difference between those studies and what we found is that temperature increases in Hawaii, Australia, Europe and Africa associated positively with haemosporidian prevalence of infection; while in central-eastern Mexico, our climate change projections seem to suggest that haemosporidian prevalence could decline as temperature increases because local temperatures would surpass the optimal haemosporidian developmental and transmission threshold, as well as the Diptera vector tolerance for breeding and development (Loiseau et al., Reference Lotta, Pacheco, Escalante, González, Mantilla, Moncada, Adler and Matta2013; Rooyen et al., Reference Rooyen, Lalubin, Glaizot and Christe2013; Atkinson et al., Reference Atkinson, Utzurrum, LaPointe, Camp, Crampton, Foster and Giambelluca2014; Liao et al., Reference Lindsay and Martens2017; Ferraguti et al., Reference Ferraguti, Hernández-Lara, Sehgal, Santiago-Alarcon, Santiago-Alarcon and Marzal2020). The climate change projections show that a global temperature increase of 2–3°C (as projected by scenario RCP 4.5), could potentially manifest in an important reduction of suitable climate areas for haemosporidian parasites in the study region. The projection under scenario RCP 8.5 is even more dramatic, showing a potential deficit of around 73.7% or higher of the suitable climate distribution area for haemosporidian parasites in San Luis Potosí and Veracruz. These results were somewhat unexpected, as the projected trends in other regions show that a suitable climate for haemosporidian prevalence moves the altitudinal gradient upward while remaining in its original distribution (Benning et al., Reference Benning, LaPointe, Atkinson and Vitousek2002). Although haemosporidian infection probabilities vary across the gradient (e.g. Plasmodium infection probability decreases with altitude while Leucocytozoon infection probability increases) (Fecchio et al., Reference Ferraguti, Martínez-de la Puente, Bensch, Roiz, Ruiz, Duarte, Soriguer and Figuerola2021). However, the projected temperature increases of both the ‘optimistic’ and ‘pessimistic’ climate change scenarios would most likely affect avian communities too by other mechanisms, such as the limitation of resources due to the desertification associated with temperature increases, as well as unforeseen changes in the population-regulation function provided by haemosporidian infections (Fuller et al., Reference Galen and Witt2012; Ilgūnas et al., Reference Illera, López, García-Padilla and Moreno2016).
Although the potential climate distribution for haemosporidians is likely to decrease their range, the prevalence of Plasmodium or Leucocytozoon species could potentially increase in some areas of the study region. Particularly in regions where vectors could find the necessary conditions for their development, such as in portions of the higher, cooler, altitude areas, where topography favours water runoff and humidity levels necessary for the reproduction and development of simulid and culicid larvae for the transmission of Leucocytozoon and Plasmodium (Galen and Witt, Reference Garamszegi2014; Harrigan et al., Reference Hellgren, Waldenström and Bensch2014; Illera et al., 2008; Ferreira et al., Reference Forrester, Greiner, Atkinson, Thomas and Hunter2020; Fecchio et al., Reference Ferraguti, Martínez-de la Puente, Bensch, Roiz, Ruiz, Duarte, Soriguer and Figuerola2021). Alternatively, because the proportion of forest at the landscape scale is an important driver of infection (Fecchio et al., Reference Ferraguti, Martínez-de la Puente, Bensch, Roiz, Ruiz, Duarte, Soriguer and Figuerola2021), Leucocytozoon spp. might suffer severely due to the loss of mountain habitats and the desertification process entailed by climate change, particularly in the drier environments of the Mexican Plateau.
Haemoproteus dominated infection prevalence in San Luis Potosí, while Plasmodium prevalence was higher in Veracruz in lowland tropical areas. These results suggest that local climate variation among regions may influence the presence of different types of dipteran vectors. For San Luis Potosí, these prevalence trends coincide with the findings of previous studies, reporting Haemoproteus species as the most frequent in 31 bird species from the neighbouring states of Tamaulipas and Nuevo León (Bennett et al., Reference Bennett, Aguirre and Cook1991) and from San Luis Potosí (Reinoso-Pérez et al., Reference Reinoso-Pérez, Canales-Delgadillo, Chapa-Vargas and Riego-Ruiz2016; Ham-Dueñas et al., Reference Harrigan, Sedano, Chasar, Chaves, Nguyen, Whitaker and Smith2017). Although Haemoproteus and Plasmodium infections share some climatic similarities, there are also some differences in their preferences, and they do not have similar prevalence rates across the study region. These differences are intimately linked to the reproductive requirements of their transmitting vectors. Haemoproteus parasites are transmitted by ceratopogonid and hippoboscid flies (Friend and Franson, Reference Fuller, Bensch, Müller, Novembre, Pérez-Tris, Ricklefs, Smith and Waldenström1999; Ferreira et al., Reference Forrester, Greiner, Atkinson, Thomas and Hunter2020). Ceratopogonid insects show high ecological flexibility and tolerate temperature ranges from 4 to 30°C (Sprygin et al., Reference Sprygin, Fiodorova, Babin, Elatkin, Mathieu, England and Kononov2014). Several species acting as haemosporidian vectors can breed in animal excrements, the rotting fruit of cacti and other vegetation detritus (Wanji et al., Reference Wanji, Tayong, Ebai, Opoku, Kien, Ndongmo, Njouendou, Ghani, Ritter, Debrah, Layland, Enyong and Hoerauf2019). All these conditions are available in our study sites from San Luis Potosí, covering the physiographic region of the Mexican Plateau. In addition, residents of the Mexican Plateau region build artificial water bodies to maintain cattle and crops. These structures are pretty common and are scattered across the landscape, making it easier for Haemoproteus ceratopogonid vectors to find suitable reproductive habitats. These artificial water bodies could also provide the aquatic habitat that Plasmodium culicid vectors require for reproduction and larval development (Grech et al., Reference Ham-Dueñas, Chapa-Vargas, Stracey and Huber-Sannwald2019) in the Mexican Plateau. Nevertheless, since these insects have an optimal development range located around the 16°C isotherm, the high-temperature variability in the region could limit their abundances and, thus, lower Plasmodium prevalence in San Luis Potosí. With current and projected temperature increases and rainfall reduction caused by climate change, the availability of moist soils and organic detritus, as well as the smaller artificial water bodies that could be helping sustain ceratopogonid vectors of Haemoproteus and culicid vectors of Plasmodium, could disappear or become scarce across the landscape, changing haemosporidian prevalence in this region of San Luis Potosí, and probably in the large Mexican Plateau.
The arid and semi-arid ecosystems in Mexico are already threatened by desertification due to unsustainable agriculture and urban development (SEMARNAT, 2016). However, it is estimated that, with climate change, the annual precipitation regime for central and northeastern Mexico could experience a 40–50% reduction that will negatively affect the productivity, biodiversity and functionality of these landscapes (Cavazos et al., Reference Cavazos, Salinas, Martínez, Colorado, de Grau, Prieto González, Conde Álvarez, Quintanar Isaías, Santana Sepúlveda, Romero Centeno, Maya Magaña, Rosario de La Cruz, Ayala Enríquez, Carrillo Tlazazanatza, Santiesteban and Bravo2013). In contrast, tropical climates experience higher precipitation regimes and are more suitable to the culicid vectors responsible for Plasmodium transmission. The prevalence values we found for the state of Veracruz are consistent with those previously reported for a neotropical site located in Veracruz in which a higher local prevalence of Plasmodium compared to the Haemoproteus and Leucocytozoon genera was recorded (Carbó-Ramírez et al., Reference Carbó-Ramírez, Zuria, Schaefer and Santiago-Alarcon2017). The presence of streams or rivers in the Sierra Madre Oriental of Veracruz are features that allow explaining the limited distribution and prevalence of Leucocytozoon infections, as black flies (Simuliidae) occur only in habitats with fast-flowing waters (Crosskey, Reference Escobar, Lira-Noriega, Medina-Vogel and Peterson1993). Running water and low temperatures necessary for Leucocytozoon transmission are rare in the Mexican Plateau. It can only be found in the Sierra Madre Oriental in the southeastern portion of the state, near the border with the state of Veracruz. The projected effects of climate change in temperate and tropical climates such as those found in Veracruz do not appear to be as severe as those predicted for the arid regions. However, models still estimate a rainfall reduction of 20% for the Gulf of Mexico Coastal Plain. Mountain habitats have already shifted more than 500 m upwards during the last 3 decades across the Trans-Mexican Volcanic Belt (Jiménez-García et al., Reference Kamiya, O'Dwyer, Nakagawa and Poulin2021).
Half of the surveys for this study focused on estimating haemosporidian prevalence from drylands. These ecosystems are often less studied than tropical and temperate ecosystems, where the highest bird endemism and avian richness levels are located. This lack of knowledge has resulted in an information gap regarding avian haemosporidian ecology for arid and semi-arid ecosystems, despite containing around 30% of the global biodiversity and constituting one of the most extensive yet vulnerable systems worldwide. For regions with a high rate of environmental degradation like the ecosystems in central-eastern Mexico, further studies into the ecology of avian haemosporidian infections and bird hosts should be considered. Besides, other important variables include habitat loss, urbanization and desertification, especially when setting conservation strategies to curb the effects of climate change over host–parasite dynamics.
Conclusion
Our findings support the hypothesis that prevalence trends can be explained and predicted by bioclimatic variables at the local and landscape level. Distributions and prevalence of haemosporidians are driven by temperature and humidity conditions that are directly related to their specific vectors' reproductive ecology. The OCUs showed a clear altitudinal migration trend of haemosporidian parasites in response to climate change projections under 2 contrasting scenarios (RCP 4.5 and RCP 8.5), particularly those located in temperate climates. For the arid and semi-arid ecosystems, a suitable climate for haemosporidians is predicted to decrease drastically, except in smaller areas concentrated at higher elevations of the mountainous habitats of the Mexican Plateau.
Data
The data underlying this article are available in the article and in its online supplementary material.
Acknowledgements
We thank Patricia Zaldivar, Yeraldi Guillen, Valeria Velazquez, Antonio Ortiz, Minerva Loredo and Romeo Tinajero for their assistance during fieldwork. In addition, Nicolás Gómez, Patricia Zaldivar, Maria del Carmen Rocha and Guadalupe Ruiz provided technical assistance during lab work. Graphical abstract was created with Biorender.com.
Author contributions
O. R. S., L. C. V., D. S. A. and E. H. S. conceived the ideas. O. R. S., L. C. V., D. S. A. contributed to funding acquisition and project administration. L. O. G. and L. C. V. contributed to fieldwork. L. O. G., O. R. S. and L. C. V. contributed to modelling. All authors contributed to data analysis and manuscript preparation.
Financial support
This research was funded by the Mexican National Council for Science and Technology (CONACYT) through its ‘National Problems’ research grant programme (grant number 2015-01-1628). CONACYT also provided a scholarship for the doctoral studies of Larissa Ortega Guzmán (scholarship number 509157/286185).
Conflict of interest
None.
Ethical standards
This research was done in compliance with the Guidelines to the Use of Wild Birds in Research. A bird banding permit (number FAUT-0157) issued by Secretaría de Medio Ambiente y Recursos Naturales (SEMARNAT, México) was used for fieldwork. No animals were harmed during the fieldwork and all birds were released at the site of capture.
Appendix
Table A1. Generalized linear mixed model parameter estimates for haemosporidian prevalence prediction in relation to habitat type


