


Major depressive disorder (MDD) is a highly prevalent psychiatric condition that is associated with substantial morbidity and mortality as well as with enormous social and economic costs (Malhi & Mann, Reference Malhi and Mann2018). Its 12-month prevalence is of approximately 6% overall (Kessler & Bromet, Reference Kessler and Bromet2013), and many depressed individuals fail to achieve an adequate and/or sustained improvement following treatment with antidepressants (ADs), and thus remain significantly disabled (Berlim & Turecki, Reference Berlim and Turecki2007). Indeed, the landmark STAR*D trial has found that over 60% of individuals with MDD failed to clinically remit after a 3-month course with the AD citalopram (Rush et al., Reference Rush, Trivedi, Wisniewski, Nierenberg, Stewart, Warden and Fava2006b), and that the majority of those who achieved remission during its four consecutive treatment steps ultimately relapsed or dropped out from follow-up (Pigott, Leventhal, Alter, & Boren, Reference Pigott, Leventhal, Alter and Boren2010).
It is thereby crucial to better understand the clinical mechanisms and targets of ADs in order to hopefully enhance their overall efficacy and acceptability in MDD. In this context, a recently developed approach called ‘network analysis’ (NA) may provide a unique framework for investigating the impact of ADs on the dynamic relationship among depressive symptoms. Briefly, NA conceptualizes mental disorders as complex networks of co-occurring symptoms that mutually/reciprocally (and often causally) interact with each other to produce self-sustained syndromic constellations (Borsboom, Reference Borsboom2017). Hence, NA does not assume that the observable depressive symptoms passively originate from a ‘common cause’ (i.e. MDD), but focuses instead on their differential multivariate patterns and/or mechanisms of association (e.g. insomnia may cause fatigue which, in turn, may worsen cognitive deficits) (Cramer, Waldorp, van der Maas, & Borsboom, Reference Cramer, Waldorp, van der Maas and Borsboom2010). Consequently, the proponents of NA have been often critical of the widespread use of sum-scores derived from rating scales to monitor both illness course and treatment outcome as this practice, when used in isolation, may obfuscate putative differences in the dynamic interplay between individual symptoms (Fried & Nesse, Reference Fried and Nesse2015).
In a typical psychopathological network, each symptom is graphically represented as a ‘node’ that is connected to other symptoms through ‘edges’ that display the strength of their statistical association (Epskamp, Waldorp, Mottus, & Borsboom, Reference Epskamp, Waldorp, Mottus and Borsboom2018b). Furthermore, the position of nodes within a network directly reflects how interconnected they are (i.e. highly and poorly connected ones are placed, respectively, more centrally and peripherally in the graphs rendered with force-directed layouts). Central nodes, in particular, are theorized to play a more prominent role in the onset and/or maintenance of psychiatric disorders and, accordingly, could be seen as potentially relevant therapeutic targets because their levels of (in)activation might directly affect the likelihood that other intimately connected nodes will also be (in)activated (Borsboom & Cramer, Reference Borsboom and Cramer2013). Furthermore, nodes can be influenced not only by their adjacent neighbors, but also by external factors such as, e.g. adverse life events or comorbid psychiatric/medical conditions (Borsboom, Reference Borsboom2017).
Recent NA studies have provided initial insight into the complex symptom dynamics underlying MDD (Contreras, Nieto, Valiente, Espinosa, & Vazquez, Reference Contreras, Nieto, Valiente, Espinosa and Vazquez2019). For instance, acutely depressed individuals have been shown to display ‘denser’ cross-sectional symptom networks compared to those in clinical remission (van Borkulo et al., Reference van Borkulo, Boschloo, Borsboom, Penninx, Waldorp and Schoevers2015) and to healthy controls (Pe et al., Reference Pe, Kircanski, Thompson, Bringmann, Tuerlinckx, Mestdagh and Gotlib2014). Interestingly, an opposite pattern has been reported by longitudinal investigations (Fried et al., Reference Fried, van Borkulo, Epskamp, Schoevers, Tuerlinckx and Borsboom2016b), i.e. increased network connectivity coupled with reduced depressive symptomatology following AD treatment with either paroxetine (n = 178) (Bos et al., Reference Bos, Fried, Hollon, Bringmann, Dimidjian, DeRubeis and Bockting2018) or citalopram (n = 2862) (Madhoo & Levine, Reference Madhoo and Levine2016). However, a relatively small trial (n = 49) showed that the AD imipramine did not significantly impact the dynamic associations between mood states despite its overall clinical efficacy for MDD (Snippe et al., Reference Snippe, Viechtbauer, Geschwind, Klippel, de Jonge and Wichers2017). Finally, a growing number of studies has highlighted the centrality of both depressed mood and fatigue within the MDD network (Belvederi Murri, Amore, Respino, & Alexopoulos, Reference Belvederi Murri, Amore, Respino and Alexopoulos2018; Bos et al., Reference Bos, Fried, Hollon, Bringmann, Dimidjian, DeRubeis and Bockting2018; Fried, Epskamp, Nesse, Tuerlinckx, & Borsboom, Reference Fried, Epskamp, Nesse, Tuerlinckx and Borsboom2016a; Madhoo & Levine, Reference Madhoo and Levine2016), and has also suggested that depressive symptoms with higher connectivity at baseline are strong predictors of the onset of a full-blown depressive episode (Boschloo, van Borkulo, Borsboom, & Schoevers, Reference Boschloo, van Borkulo, Borsboom and Schoevers2016).
Despite its remarkable recent expansion, NA has not yet been systematically applied to examine how depressive symptoms dynamically unfold in relation to each other in response to distinct ADs. Therefore, the present randomized trial aimed to compare, among adult depressed outpatients, the network structure of core MDD symptom-domains at baseline and following 8 weeks of treatment with the ADs escitalopram and desvenlafaxine.
Methods
Participants
Participants in the current study were part of a larger randomized trial aimed at identifying genetic biomarkers of AD response in MDD.
Briefly, individuals aged 18–65 years were recruited, from January 2012 to August 2016, among those referred to the Depressive Disorders Program of the Douglas Institute in Montreal, Canada [see Fig. 1 for the CONSORT Flow Diagram (Moher et al., Reference Moher, Hopewell, Schulz, Montori, Gotzsche, Devereaux and Altman2010)]. They were all medication-free for at least 2 weeks (or 4 weeks in the case of previous use of fluoxetine) and had a primary diagnosis of MDD, as assessed by the Structured Clinical Interview for the DSM-IV-TR (American Psychiatric Association, 2000), of at least moderate intensity [i.e. a 21-item Hamilton Depression Rating Scale (Hamilton, Reference Hamilton1960) score ⩾20].
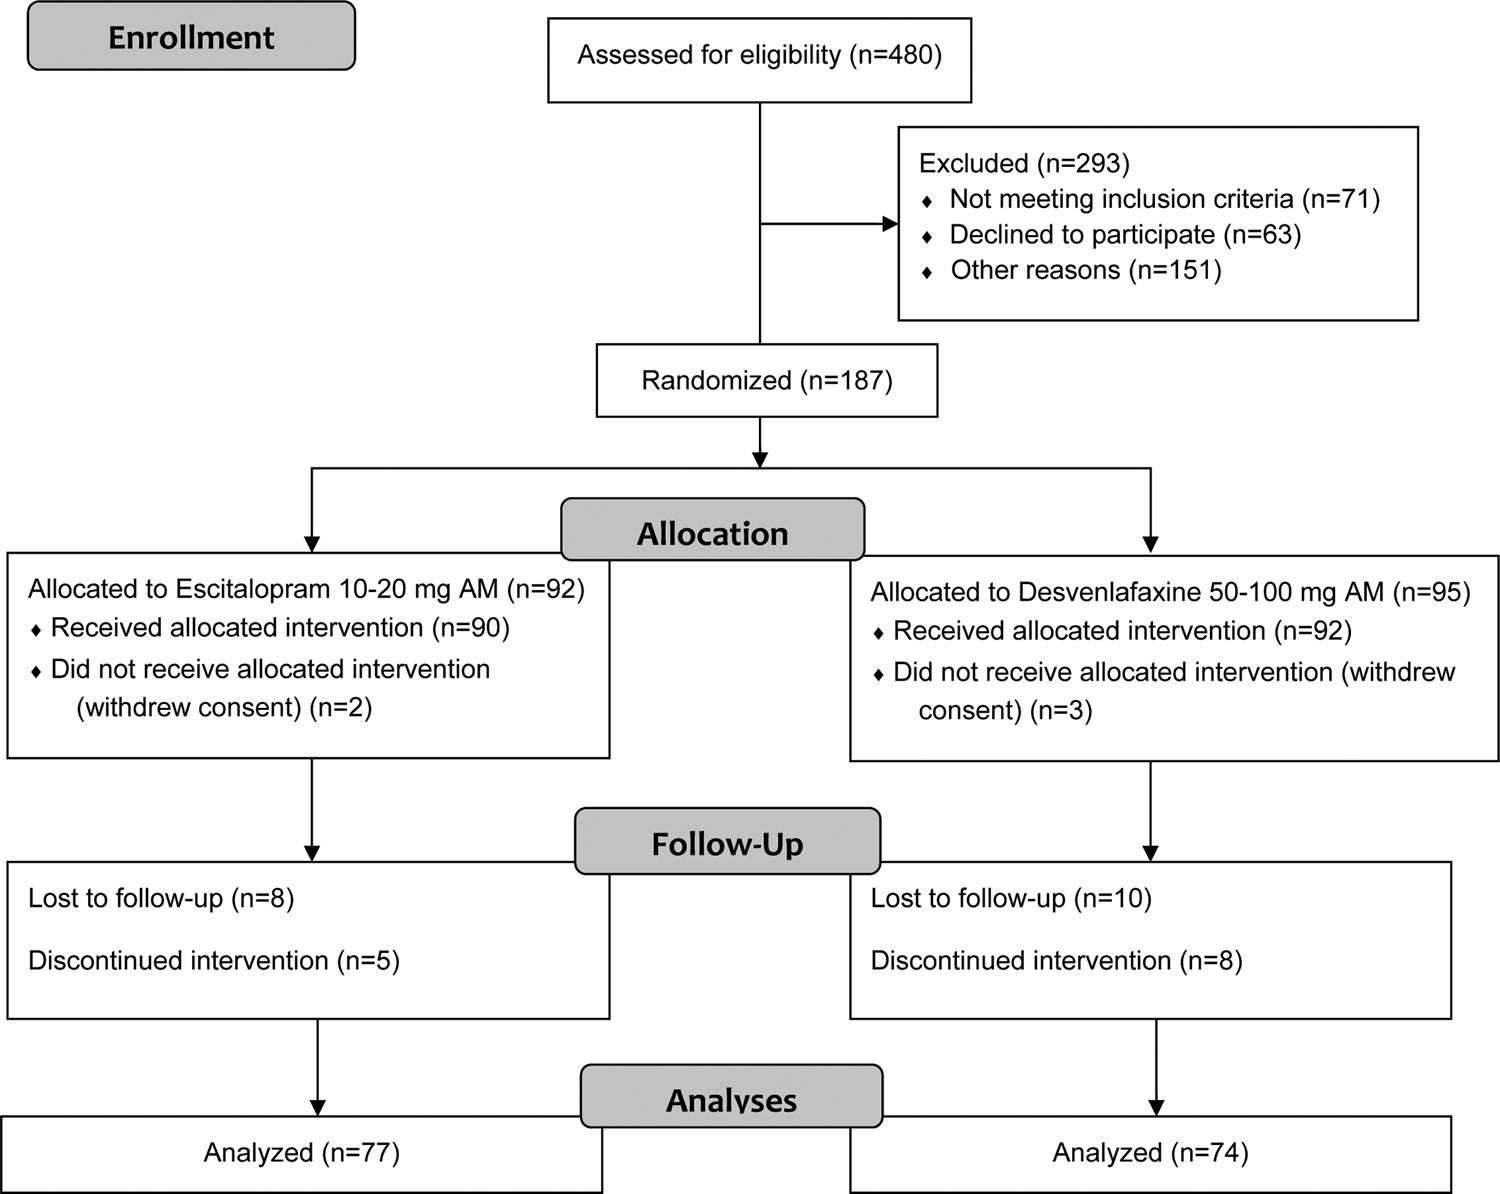
Fig. 1. CONSORT flow diagram.
Individuals were not included in the study if they presented with a lifetime history of schizophrenia, bipolar disorder, severe head trauma and/or neurological disease or with a substance-related disorder within the past 6 months. Finally, the study was approved by the Douglas Institute Research Ethics Board, and all enrolled participants provided written informed consent.
Prospective AD treatment
Enrolled outpatients were randomized to receive, in an open label manner, either the selective serotonin reuptake inhibitor escitalopram [10–20 mg/day; n (completers) = 77] or the serotonin and noradrenalin reuptake inhibitor desvenlafaxine [50–100 mg/day; n (completers) = 74] for 8 weeks.
All participants met with the study psychiatrist (S.R.D.) at baseline and at week 8, and these sessions consisted of basic clinical management [e.g. general psychoeducation, assessment of overall functioning, limited supportive counseling (Fawcett, Epstein, Fiester, Elkin, & Autry, Reference Fawcett, Epstein, Fiester, Elkin and Autry1987)]. They also met with a research assistant at baseline and then every 2 weeks until the end of the study, and these visits consisted of standardized psychopathological assessments as well as a review of medication compliance/tolerability. Finally, the implementation of specific psychotherapy interventions was not permitted during the study.
Assessment of core depressive symptom-domains and treatment outcome
We used the 16-item Quick Inventory of Depressive Symptomatology-Self-Report (QIDS-SR) (Rush et al., Reference Rush, Trivedi, Ibrahim, Carmody, Arnow, Klein and Keller2003) to assess core MDD psychopathology as well as treatment outcome. Briefly, for each QIDS-SR item, participants were asked to select, among four statements ranging in severity from 0 to 3, the one that best described how they felt over the past week. We derived the nine DSM-IV-TR symptom criterion domains following the QIDS-SR's standard scoring system (Rush et al., Reference Rush, Trivedi, Ibrahim, Carmody, Arnow, Klein and Keller2003): depressed mood (score on item 5), anhedonia (score on item 13), composite appetite/weight disturbance (i.e. the highest score among items 6–9), composite sleeping disturbance (i.e. the highest score among items 1–4), composite psychomotor disturbance (i.e. the highest score among items 15 and 16), fatigue (score on item 14), worthlessness/guilt (score on item 11), cognitive disturbance (score on item 10), and suicidality (score on item 12) (Rush et al., Reference Rush, Trivedi, Ibrahim, Carmody, Arnow, Klein and Keller2003). The internal consistency of the QIDS-SR, as quantified by Cronbach's α, was poor at baseline (i.e. α = 0.52) and acceptable at week 8 (i.e. α = 0.78) (Tavakol & Dennick, Reference Tavakol and Dennick2011). Of note, these relatively low internal consistency estimates indicated that the individual items of the QIDS-SR were likely non-redundant and, consequently, participant responses could be examined at the item level (Abacioglu, Isvoranu, Verkuyten, Thijs, & Epskamp, Reference Abacioglu, Isvoranu, Verkuyten, Thijs and Epskamp2019). Finally, we defined clinical remission at study end as a QIDS-SR score ⩽5 (Rush et al., Reference Rush, Kraemer, Sackeim, Fava, Trivedi, Frank and Schatzberg2006a).
Statistical analyses
We used IBM SPSS (v. 24) for data management and for all non-network-related statistical analyses. Baseline demographic/clinical characteristics between study completers and non-completers were compared using χ2 and Mann–Whitney U tests (whenever applicable), and all correlations were computed using Spearman's coefficients (r s). Moreover, the overall longitudinal change and the differential impact of ADs on the core MDD psychopathology were examined using repeated measures analysis of variance with time (i.e. baseline, week 8) as the independent within-subjects variable, AD (i.e. desvenlafaxine and escitalopram) as the independent between-subjects variable, and the difference in pre-post scores on the nine MDD symptom-domains as the dependent variables. If the omnibus test for the AD × timepoint interaction was statistically significant, then planned comparisons (using the least significant difference) were employed to examine the nature of the differences. Moreover, the pre-post treatment effect sizes were calculated using Vargha and Delaney's A (Vargha & Delaney, Reference Vargha and Delaney2000). We also used R [v. 3.5.1 (R Development Core Team, 2008), in the RStudio environment (v. 1.2.1335)] to perform all the network-related analyses. More specifically, qgraph (v. 1.6.3) (Epskamp, Cramer, Waldorp, Schmittmann, & Borsboom, Reference Epskamp, Cramer, Waldorp, Schmittmann and Borsboom2012), and EstimateGroupNetwork (v. 0.1.2) (Danaher, Wang, & Witten, Reference Danaher, Wang and Witten2014) were used for estimating and visualizing the networks and for computing centrality measures, bootnet (v. 1.2.4) (Epskamp, Borsboom, & Fried, Reference Epskamp, Borsboom and Fried2018a) was used for assessing network stability and accuracy, NetworkComparisonTest (v. 2.2.1) (van Borkulo et al., Reference van Borkulo, Boschloo, Kossakowski, Tio, Schoevers, Borsboom and WaldorpSubmitted) was used for evaluating differential network structure and connectivity between baseline and week 8, NetworkToolbox (v. 1.4.0) was used to estimate network connectivity measures, and mgm (v. 1.2-7) (Haslbeck & Waldorp, Reference Haslbeck and Waldorp2018) was used for computing nodewise predictability. Finally, the significance level for all analyses was set at α = 0.05.
Network estimation
We estimated undirected MDD symptom-domain networks at baseline and week 8 using Gaussian graphical models (GGMs) (Epskamp & Fried, Reference Epskamp and Fried2018). In these GGMs, the MDD symptom-domains are represented as nodes, whereas their pairwise partial polychoric correlations (p r) are displayed by weighted edges whose length corresponds to the inverse of their absolute value. Accordingly, if two nodes are connected via an edge in the resulting graph, they are statistically correlated while controlling for all other nodes in the network; conversely, if they are unconnected, they are conditionally independent (Costantini et al., Reference Costantini, Richetin, Preti, Casini, Epskamp and Perugini2019). Therefore, the generated networks can be seen as causal skeletons encompassing the existence of putative causal/predictive relationships between the connected nodes (Isvoranu et al., Reference Isvoranu, van Borkulo, Boyette, Wigman, Vinkers and Borsboom2017).
To compute networks that are more balanced in terms of sparseness and goodness-of-fit and also to minimize multiple statistical testing, we regularized the GGMs using the Graphical Least Absolute Shrinkage and Selection Operator (GLASSO) algorithm combined with an Extended Bayesian Information Criterion (EBIC) model selection (Costantini et al., Reference Costantini, Epskamp, Borsboom, Perugini, Mõttus, Waldorp and Cramer2015). Briefly, the GLASSO algorithm ‘shrinks’ many partial correlations in the network and sets trivially small ones to exactly zero, thus minimizing the retention of spurious edges (Foygel & Drton, Reference Foygel and Drton2010; Friedman, Hastie, & Tibshirani, Reference Friedman, Hastie and Tibshirani2008), and also selects the network model associated with the lowest EBIC value (Chen & Chen, Reference Chen and Chen2008; Epskamp et al., Reference Epskamp, Waldorp, Mottus and Borsboom2018b). The EBIC, in turn, computes sparser or denser networks based on the graphical tuning hyperparameter γ which we set at 0.5 (erring on the side of parsimony) for our primary analyses and at 0 (erring on the side of discovery) for our secondary analyses (Epskamp & Fried, Reference Epskamp and Fried2018).
Network visualization
To visualize the GGM networks we used Fruchterman and Reingold's (Reference Fruchterman and Reingold1991) algorithm which displays nodes with stronger connections closer together and more centrally located in the rendered graph. The resulting layout simultaneously depicts the strength of the association between different nodes (which is proportional to the thickness and saturation of the individual edges) as well as the direction of the underlying partial correlations (i.e. positive and negative estimates are shown, respectively, by the colors blue and red) (Epskamp & Fried, Reference Epskamp and Fried2018). Finally, we averaged the layouts of the comparison networks (e.g. baseline v. week 8) to facilitate their visual interpretation.
Node centrality
To investigate the relative importance of individual MDD symptom-domains within the networks at baseline and week 8 we computed a centrality measure called expected influence (EI) (Opsahl, Agneessens, & Skvoretz, Reference Opsahl, Agneessens and Skvoretz2010; Robinaugh, Millner, & McNally, Reference Robinaugh, Millner and McNally2016). Briefly, EI assesses a given node's influence on its immediate neighbors by summing the values of all the edges connected to it (both positive and negative) (Robinaugh et al., Reference Robinaugh, Millner and McNally2016). To facilitate the interpretation of EI, we standardized it to a normal Z distribution with a mean of 0 and a standard deviation (s.d.) of 1 (Epskamp et al., Reference Epskamp, Borsboom and Fried2018a). We did not compute additional centrality metrics because they are usually highly correlated with EI (e.g. strength), and are often unstable unless estimated in very large samples (e.g. betweenness and closeness) (Epskamp et al., Reference Epskamp, Borsboom and Fried2018a). Finally, to address the concern that differential variability might distort inferences about node centrality (Terluin, de Boer, & de Vet, Reference Terluin, de Boer and de Vet2016), we correlated the EI estimates of each MDD symptom-domain with its respective s.d. at both baseline and week 8 (Heeren, Jones, & McNally, Reference Heeren, Jones and McNally2018).
Nodewise predictability
We computed the percentage of variance (R 2) of each MDD symptom-domain that is explained by its neighbors within the networks at baseline and week 8 (Fried et al., Reference Fried, Eidhof, Palic, Costantini, Huisman-van Dijk, Bockting and Karstoft2018). This measure, called predictability, provides an estimate of how much influence one can have on a particular node by intervening on all of its adjoining nodes, and it ranges from 0 to 1 (i.e. a node is, respectively, not predicted or fully predicted by its neighbors) (Haslbeck & Waldorp, Reference Haslbeck and Waldorp2018).
Network structure and connectivity
We calculated the density of the psychopathological networks by summing the absolute values of all of their edge weights (i.e. total connectivity), and by dividing the latter by the respective total number of edges (i.e. mean connectivity). We also examined the structure and connectivity of the MDD symptom-domain networks at baseline and week 8 with a two-tailed permutation procedure that randomly and repeatedly reorganizes participants from the original samples into multiple smaller subgroups (n permutations = 5000) (van Borkulo et al., Reference van Borkulo, Boschloo, Kossakowski, Tio, Schoevers, Borsboom and Waldorpsubmitted). The resulting distribution under the null hypothesis is then used to test for differences between these subgroups (expressed as p values) in terms of three main statistics: ‘global strength invariance’ (which assesses differential overall connectivity), ‘network structure invariance’ (which compares the differential distribution of edge weights), and ‘edge strength invariance’ (which examines Holm–Bonferroni-corrected differences in individual edge weights).
Network accuracy and stability
We computed the stability of EI centrality at baseline and week 8 by using a case-dropping subset bootstrapping procedure (n boots = 5000) in which the correlations between the estimates in the original sample and in subgroups with progressively fewer participants are repeatedly compared. If these correlations decline substantially as participants are removed from the analyses, then the EI centrality estimates are considered ‘unstable’ (Epskamp et al., Reference Epskamp, Borsboom and Fried2018a). Additionally, we calculated the correlation stability coefficient (CS-coefficient) which indicates the maximum proportion of participants that can be dropped from a network while maintaining a 95% probability that the correlation of EI centrality and predictability between the original sample and the bootstrapped subgroups is ⩾0.70 (Costantini et al., Reference Costantini, Epskamp, Borsboom, Perugini, Mõttus, Waldorp and Cramer2015; Papageorgiou et al., Reference Papageorgiou, Benini, Bilello, Gianniou, Clough and Costantini2019). Overall, CS-coefficients ⩾0.25 and ⩾0.5 imply, respectively, moderate and strong stability (Santos, Kossakowski, Schwartz, Beeber, & Fried, Reference Santos, Kossakowski, Schwartz, Beeber and Fried2018).
Furthermore, we estimated the accuracy of the edge weights within the networks at baseline and week 8 via non-parametric bootstrapped 95% confidence intervals (CIs) around the original edge values (n boots = 5000); generally, smaller 95% CIs indicate higher edge accuracy. Finally, we used the bootstrapped difference test to examine whether specific pairs of edge weights and EI centrality estimates significantly differed from each other at both timepoints (n boots = 5000; uncontrolled for multiple comparisons) (Epskamp et al., Reference Epskamp, Borsboom and Fried2018a).
Results
Participants
Of the 189 outpatients who were initially enrolled, 151 (79.90%) completed the final clinical evaluation at week 8. Therefore, to ensure that the networks were homogeneous, we excluded the participants who dropped out prior to the study end from the analyses. Of note, there were no significant differences between completers and non-completers in terms of key baseline sociodemographic and clinical characteristics (i.e. gender: p = 0.39, ethnicity: p = 0.59, marital status: p = 0.33, education: p = 0.73, mean QIDS-SR score: p = 0.09, age at MDD onset: p = 0.09, number of previous depressive episodes: p = 0.40), with the exception of age [i.e. non-completers were younger overall (i.e. 35.00 v. 40.18 years), p = 0.03]. Moreover, at baseline, all included participants had a score >5 on the QIDS-SR (i.e. they were not in remission).
Baseline demographic and clinical characteristics of the 151 participants are presented in Table 1. Briefly, 58.30% (n = 88) of them were women, 80.80% (n = 122) were Caucasian, and their mean age was 40.18 ± 12.17 years (range = 18–68 years). Additionally, 48.30% (n = 73) of them had a partner, 67.50% (n = 102) were currently employed, and 56.90% (n = 86) had a professional- or university-level education. Moreover, 27 (17.90%) participants had a comorbid anxiety disorder. Finally, we found no significant differences between participants who received desvenlafaxine (n = 74) or escitalopram (n = 77) in terms of key baseline sociodemographic and clinical variables (i.e. age: p = 0.91; gender: p = 0.48, ethnicity: p = 0.30, marital status: p = 0.97, education: p = 0.44, mean QIDS-SR score: p = 0.77, age at MDD onset: p = 0.99, number of previous depressive episodes: p = 0.23).
Table 1. Baseline sociodemographic and clinical characteristics of patients randomized to receive either desvenlafaxine or escitalopram

MDD, major depressive disorder; MDE, major depressive episode; NOS, not otherwise specified; QIDS-SR, Quick Inventory of Depressive Symptomatology-Self-Report.
a Desvenlafaxine v. escitalopram.
Prospective AD treatment
The mean QIDS-SR score decreased significantly from baseline to week 8 (i.e. 16.00 ± 3.39 v. 10.28 ± 5.24, respectively; Wilks' λ = 0.41, F (1) = 217.83, p < 0.0001) and, at study end, 22.5% (n = 34) of the participants were considered remitters. Likewise, scores on all MDD symptom-domains [with the exception of anhedonia, which has been previously shown to be usually less responsive to typical somatic treatments (Cao et al., Reference Cao, Zhu, Zuckerman, Rosenblat, Brietzke, Pan and McIntyre2019)] also decreased significantly over time (Table 2); overall, depressed mood and anhedonia were associated, respectively, with the largest (i.e. A = 0.78) and smallest (i.e. A = 0.52) improvements.
Table 2. MDD symptom-domains at baseline and at week 8 (n = 151)

a Vargha and Delaney's A.
b Large.
c Negligible.
d Medium.
e Small.
Additionally, no significant AD × timepoint interaction was found for the nine MDD symptom-domains (Wilks' λ = 0.96, F (9) = 0.63, p = 0.77) after controlling for the main effect of time (Wilks' λ = 0.33, F (9) = 32.01, p < 0.0001), thus suggesting that desvenlafaxine and escitalopram were equally effective overall. Moreover, there was a statistical trend toward higher remission rates at week 8 among participants who received escitalopram [22/77 (28.50%)] v. desvenlafaxine [12/74 (16.2%)] (χ2 = 3.30, p = 0.07).
Finally, nearly identical efficacy results were obtained when we analyzed the outcome data from all originally enrolled participants (n = 189) using the last observation carried forward approach (Woolley, Cardoni, & Goethe, Reference Woolley, Cardoni and Goethe2009) (see the online Appendix for additional information).
Network analyses
Network visualization
Figure 2 displays the averaged Fruchterman and Reingold's configuration layouts of the MDD symptom-domain networks at baseline and week 8 (γ = 0.5).

Fig. 2. EBICglasso MDD symptom-domain networks at baseline and week 8 (n = 151). Solid and dashed lines represent, respectively, positive and negative partial correlations, and the thickness of each edge indicates the strength of the association. The gray ring around each MDD symptom-domain represents its predictability. The network layouts were averaged to facilitate visual comparisons.
At baseline, the MDD symptom-domains with partial correlations >0.25 were fatigue–cognitive disturbance (p r = 0.40) as well as depressed mood–suicidality (p r = 0.26). Puzzling findings were the negative associations between anhedonia–depressed mood (p r = −0.20) and anhedonia–cognitive disturbance (p r = −0.14), which might be explained, at least in part, by a potential conditioning on a ‘common effect’ and/or by a low overall endorsement rate on the respective QIDS-SR item (i.e. 51.70% of the participants reported no anhedonia at baseline; Fig. 4S in the online Appendix) (Epskamp & Fried, Reference Epskamp and Fried2018). Moreover, at week 8, the MDD symptom-domains with partial correlations >0.25 were depressed mood–suicidality (p r = 0.43), fatigue–cognitive disturbance (p r = 0.27), and depressed mood–cognitive disturbance (p r = 0.26).
Figures 3 and 4 display, respectively, averaged Fruchterman and Reingold's configuration layouts of the exploratory MDD symptom-domain networks at baseline and at week 8 (γ = 0) for participants who received desvenlafaxine or escitalopram. Briefly, at week 8 the MDD symptom-domains with partial correlations >0.25 in the escitalopram network were depressed mood–suicidality (p r = 0.53), and fatigue–psychomotor disturbance (p r = 0.32), whereas in the desvenlafaxine network they were depressed mood–suicidality (p r = 0.35), psychomotor disturbance–appetite/weight disturbance (p r = 0.31), suicidality–worthlessness/guilt (p r = 0.30), fatigue–worthlessness/guilt (p r = 0.28), and sleep disturbance–cognitive disturbance (p r = 0.28).

Fig. 3. EBICglasso MDD symptom-domain networks at baseline and following 8 weeks of treatment with desvenlafaxine (n = 74). Solid and dashed lines represent, respectively, positive and negative partial correlations, and the thickness of an edge indicates the strength of the association. The gray ring around each MDD symptom-domain represents its predictability. The network layouts were averaged to facilitate visual comparisons.

Fig. 4. EBICglasso MDD symptom-domain networks at baseline and following 8 weeks of treatment with escitalopram (n = 77). Solid and dashed lines represent, respectively, positive and negative partial correlations, and the thickness of an edge indicates the strength of the association. The gray ring around each MDD symptom-domain represents its predictability. The network layouts were averaged to facilitate visual comparisons.
Node centrality
Figure 5 shows the EI centrality of the MDD symptom-domains at baseline and week 8 (γ = 0.5). Briefly, the most and least central nodes at baseline were, respectively, fatigue and anhedonia; in contrast, at week 8 they were, respectively, depressed mood and appetite/weight disturbance.

Fig. 5. Standardized EI within the MDD symptom-domain networks at baseline (top) and week 8 (bottom) (n = 151). MDD symptom-domains with values located farther to the right of the figure have greater EI centrality.
In terms of the exploratory analyses at week 8 (γ = 0), depressed mood had the highest EI centrality in both AD networks, whereas appetite/weight disturbance and anhedonia were, respectively, the least central nodes in the escitalopram and desvenlafaxine networks (Figs 6 and 7). Finally, the s.d.s of the MDD symptom-domains (n = 151) did not significantly correlate with their EI estimates (i.e. baseline: r s = −0.43, p = 0.25; week 8: r s = −0.13, p = 0.74), thus suggesting that differential node variability did not ‘drive’ centrality.

Fig. 6. Standardized EI within the MDD symptom-domain networks at baseline (top) and following 8 weeks of treatment (bottom) with desvenlafaxine (n = 74). MDD symptom-domains with values located farther to the right of the figure have greater EI centrality.

Fig. 7. Standardized EI within the MDD symptom-domain networks at baseline (top) and following 8 weeks of treatment (bottom) with escitalopram (n = 77). MDD symptom-domains with values located farther to the right of the figure have greater EI centrality.
Nodewise predictability
The mean predictability of the MDD symptom-domains increased significantly from baseline to week 8 (i.e. 0.16 v. 0.33, respectively; p = 0.008; γ = 0.5) (Fig. 2 and Table 3). Overall, the most predictable nodes at baseline were fatigue (R 2 = 0.33) and cognitive disturbance (R 2 = 0.32), whereas at week 8 they were depressed mood (R 2 = 0.52) and cognitive disturbance (R 2 = 0.50). In contrast, appetite/weight disturbance at baseline (R 2 = 0) and anhedonia at week 8 (R 2 = 0.05) were the least predictable nodes, thus suggesting, e.g. that some potentially key (although unidentified) variable(s) of interest were not included in the analyses. Finally, the predictability of the MDD symptom-domains following 8 weeks of AD treatment also increased significantly over time [i.e. escitalopram: R 2 = 0.19–0.36 (p = 0.04); desvenlafaxine: R 2 = 0.17–0.34 (p = 0.008); γ = 0] (Figs 3 and 4 as well as Table 3).
Table 3. Predictability of the MDD symptom-domains within the psychopathological networks

Network structure and connectivity
Network connectivity measures for all of the reported psychopathological networks are presented in Table 4.
Table 4. Network connectivity measures at baseline and at week 8

The MDD symptom-domains network at week 8 (γ = 0.5) was significantly more connected than at baseline (i.e. S = 2.93, p ⩽ 0.0001; Fig. 5S, top section, in the online Appendix), and they were also structurally dissimilar across the two timepoints (i.e. M = 0.36, p = 0.001; Fig. 5S, bottom section, in the online Appendix). Furthermore, depressed mood–cognitive disturbance and depressed mood–suicidality were significantly more connected at week 8 compared to baseline (i.e. p = 0.02 and <0.0001, respectively).
In terms of the exploratory analyses (γ = 0), although the MDD symptom-domain networks associated with desvenlafaxine and escitalopram did not significantly differ from each other in terms of connectivity (i.e. baseline: S = 0.05, p = 0.97; week 8: S = 0.63, p = 0.25), or structure (i.e. baseline: M = 0.30, p = 0.18, γ = 0; week 8: M = 0.25, p = 0.75), they were both significantly more connected at week 8 compared to baseline (i.e. desvenlafaxine: S = 2.46, p = 0.004; escitalopram: S = 3.07, p < 0.0001).
Network accuracy and stability
The CS-coefficients for EI were 0.25 at baseline and 0.60 at week 8 (i.e. moderate to strong stability, respectively), thus indicating that centrality estimates can be likely interpreted meaningfully (Epskamp et al., Reference Epskamp, Borsboom and Fried2018a) (Figs 6S and 7S in the online Appendix). Also, the bootstrapped difference test showed that, at baseline, fatigue, depressed mood and cognitive disturbance had significantly higher EI centrality compared to some of the other MDD symptom-domains (e.g. appetite/weight disturbance, worthlessness/guilt, and sleep disturbance) (Fig. 8S in the online Appendix) and that, at week 8, these putative differences became less prominent (Fig. 9S in the online Appendix). Additionally, the bootstrapped 95% CIs around the estimated edge weights at baseline and week 8 indicated that most of them were not significantly different from each other (Figs 10S and 11S in the online Appendix). Finally, the bootstrapped difference test between the non-zero edge weights mainly indicated that cognitive disturbance–fatigue at baseline and depressed mood–suicidality at week 8 were significantly different from the remaining edges (Figs 12S and 13S in the online Appendix).
Discussion
To our knowledge, this is the first study examining the network structure of core MDD symptom-domains prior to and following 8 weeks of treatment with two distinct ADs, namely desvenlafaxine and escitalopram. Our main finding was that, over time and irrespective of the AD used, the MDD symptom-domains network became more densely connected and predictable while the overall depressive severity significantly decreased. This is highly consistent with two recent studies in which depressed individuals were treated for several weeks with the ADs paroxetine (Bos et al., Reference Bos, Fried, Hollon, Bringmann, Dimidjian, DeRubeis and Bockting2018) and citalopram (Madhoo & Levine, Reference Madhoo and Levine2016) as well as with cognitive-behavioral therapy (Blanken et al., Reference Blanken, Van Der Zweerde, Van Straten, Van Someren, Borsboom and Lancee2019). However, our results contrast with those from van Borkulo et al. (Reference van Borkulo, Boschloo, Borsboom, Penninx, Waldorp and Schoevers2015), who showed that a more densely connected depressive symptoms network at baseline was associated with decreased rates of eventual recovery from a MDD. A possible explanation for this discrepancy might be methodological as we employed a within-subject design, whereas van Borkulo et al. (Reference van Borkulo, Boschloo, Borsboom, Penninx, Waldorp and Schoevers2015) employed a between-subjects design (Charness, Gneezy, & Kuhn, Reference Charness, Gneezy and Kuhn2012). Indeed, although cross-sectional NA studies are predicated on the assumption that greater connectivity at the group level reflects greater connectivity at the intra-individual level, there is not yet conclusive evidence supporting this (Robinaugh, Hoekstra, Toner, & Borsboom, Reference Robinaugh, Hoekstra, Toner and Borsboom2019). Therefore, one has to be careful not to inappropriately generalize inferences about network characteristics derived from groups (and cross-sectional data) to individuals (and longitudinal data) (Fisher, Medaglia, & Jeronimus, Reference Fisher, Medaglia and Jeronimus2018). An intuitive example of such a conundrum is observed in the correlation between typing speed and typos: at the group level, this correlation is negative, as experienced typists are both faster and more proficient; however, within individuals, this correlation is positive as the faster a given individual types, the greater the number of mistakes that he/she makes (Hamaker, Reference Hamaker, Mehl and Conner2012).
We also observed, across both timepoints, two relatively distinct groups of MDD symptom-domains, the first encompassing depressed mood, suicidality and worthlessness/guilt, and the second encompassing fatigue and cognitive/psychomotor/sleep disturbance. It is likely that covariations within these putative symptomatologic groups might have been generated by partially distinctive etiological processes. For instance, the connections in the first and second groups might result, respectively, from cognitive and physiological/homeostatic mechanisms (Cramer, Borsboom, Aggen, & Kendler, Reference Cramer, Borsboom, Aggen and Kendler2012) and, accordingly, each might differentially respond to alternative therapeutic interventions (e.g. cognitive restructuring v. sleep hygiene, respectively). Of relevance, similar patterns of covariation among MDD symptom-domains were reported by Montazeri et al. (Reference Montazeri, de Bildt, Dekker and Andersonin press) in a sample of over 2000 adolescents from the general population.
Our finding that anhedonia–depressed mood and anhedonia–cognitive disturbance were negatively associated at baseline was unexpected and could be explained, at least in part, by the so-called ‘Berkson's bias’. Briefly, this type of bias usually arises when a selection rule (e.g. having depressive symptoms of moderate intensity based on the sum-score of a rating scale) is equivalent to conditioning on a ‘collider’ (de Ron et al., Reference de Ron, Fried and Epskamp2019). More specifically, in a collider structure, two variables, ‘A’ (e.g. anhedonia) and ‘B’ (e.g. cognitive disturbance), both cause a third variable, ‘C’ (e.g. ‘MDD status’). Thus, conditioning anhedonia and cognitive disturbance on the common effect ‘MDD status’ might make them falsely dependent by biasing their covariance structure and inducing spurious negative correlations. Consequently, a possible way to overcome ‘Berkson's bias’ might be to select participants based on an independent criterion that is correlated with class membership (i.e. ‘MDD status’) but is not itself a function of the depressive symptoms (e.g. genetic and environmental risk factors for MDD) (de Ron et al., Reference de Ron, Fried and Epskamp2019).
Another aim of the current investigation was to examine the centrality of the MDD symptom-domains prior to and following 8 weeks of AD treatment. Briefly, our results were largely in agreement with those of previous investigations (Bos et al., Reference Bos, Fried, Hollon, Bringmann, Dimidjian, DeRubeis and Bockting2018; Boschloo et al., Reference Boschloo, van Borkulo, Borsboom and Schoevers2016; Bringmann, Lemmens, Huibers, Borsboom, & Tuerlinckx, Reference Bringmann, Lemmens, Huibers, Borsboom and Tuerlinckx2015; Fried et al., Reference Fried, Epskamp, Nesse, Tuerlinckx and Borsboom2016a; Madhoo & Levine, Reference Madhoo and Levine2016), and suggested that depressed mood, fatigue, and cognitive/psychomotor disturbances are part of a central hub within the network structure of MDD which could be potentially targeted by ‘focused’ interventions aimed at generating ‘spreading’ improvements among the adjoining depressive symptoms (Borsboom, Reference Borsboom2017). Conversely, the ‘activation’ of these key nodes within the ‘dormant’ psychopathological network of predisposed asymptomatic individuals might possibly increase the risk of a full-blown depressive episode (Cramer et al., Reference Cramer, Borsboom, Aggen and Kendler2012). Moreover, our investigation indicated, in agreement with Kendler, Aggen, Flint, Borsboom, and Fried (Reference Kendler, Aggen, Flint, Borsboom and Fried2018), that appetite/weight disturbance and anhedonia seem to be more peripherally located within the MDD symptom-domains network. We also identified marked differences in the predictability of MDD symptom-domains, ranging from 0% (i.e. appetite/weight disturbance at baseline) to 53% (i.e. depressed mood at week 8). Finally, we have shown, in agreement with Bos et al. (Reference Bos, Fried, Hollon, Bringmann, Dimidjian, DeRubeis and Bockting2018), that average nodewise predictability significantly increased following AD treatment (i.e. from 16% to 33%), and one possibility is that it might reflect a decrease in the relative impact of unmeasured (or latent) variables; a second possibility is that the AD treatment might have ‘shrunk’ the potential score variability among the MDD symptom-domains by significantly reducing their intensity ‘across-the-board’ (i.e. by making them more ‘homogeneous’) and, consequently, increasing their overall correlation/predictability as well as the overall connectivity within the underlying networks; indeed, the inter-item correlation analyses among the MDD symptom-domains indicated that this might actually have been the case (i.e. baseline: mean = 0.11, range = 0.78, variance = 0.03; week 8: mean = 0.31, range = 0.54, variance = 0.02).
Taken together, our findings suggest that a promising clinical application of NA might involve its use as an empirical guide for treatment selection in MDD. For instance, highly central/predictable symptoms (with bidirectional associations within the network) could be selectively targeted by novel psychopharmacological, psychosocial, and/or neuromodulatory interventions because of their potential widespread impact on the depressive syndrome as a whole (Belvederi Murri et al., Reference Belvederi Murri, Amore, Respino and Alexopoulos2018). On the other hand, directing therapeutic efforts to more peripheral MDD symptom-domains might prove to be a less optimal clinical strategy (Fried et al., Reference Fried, van Borkulo, Cramer, Boschloo, Schoevers and Borsboom2017). For instance, it is plausible, based on our results, that an intervention focusing, e.g. on depressed mood at week 8 (which had a predictability of 53%) may have a considerable direct impact on several other interconnected symptom-domains (e.g. suicidality, cognitive disturbance, and worthlessness/guilt) (Fig. 14S in the online Appendix). Furthermore, even a generally efficacious treatment for the broader depressive syndrome might be of questionable clinical utility vis-à-vis appetite/weight disturbance at baseline as its adjacent nodes explain none of its variance; hence, to indirectly affect the latter one might have, e.g. to search for other relevant variables outside of the core MDD symptom-domains network (Fonseca-Pedrero, Reference Fonseca-Pedrero2017). It is also possible that significant correlations between appetite/weight disturbance and its adjacent nodes might have only been detected, e.g. by employing a more intensive longitudinal design; that is, the potential ‘cause’ (e.g. appetite/weight disturbance) would have to be measured at T 1 and the potential ‘effect’ (e.g. fatigue) would have to be measured at T 2.
Finally, our findings also tentatively suggest that specific MDD symptom-domains (in addition to depressed mood) might be differentially targeted following an unsatisfactory response to escitalopram or desvenlafaxine (e.g. psychomotor disturbance and cognitive disturbance, respectively). Nevertheless, future studies are needed to examine this intriguing hypothesis.
It is important to note that cross-sectional psychopathological networks may only reveal the co-occurrence of depressive symptoms, and not the causality/directionality of their associations (Bos et al., Reference Bos, Snippe, de Vos, Hartmann, Simons, van der Krieke and Wichers2017). Therefore, we cannot conclude whether a given MDD symptom-domain ‘causes’ or is ‘caused’ by other symptom-domains connected to it. Also, because of the well-known heterogeneity of MDD (Fried, Nesse, Zivin, Guille, & Sen, Reference Fried, Nesse, Zivin, Guille and Sen2014), it is unclear whether the correlations and the centrality/predictability estimates derived from group-level networks can be generalized to a particular individual (Bringmann et al., Reference Bringmann, Lemmens, Huibers, Borsboom and Tuerlinckx2015; Fried et al., Reference Fried, Epskamp, Nesse, Tuerlinckx and Borsboom2016a; van Borkulo et al., Reference van Borkulo, Borsboom, Epskamp, Blanken, Boschloo, Schoevers and Waldorp2014). To address these issues, future studies should examine the temporal dynamics of symptom interrelations using, e.g. the so-called ‘experience sampling method’ (Wichers, Reference Wichers2014), which measures variables repeatedly in daily life in order to derive information from both intra- (i.e. momentary) and inter-individual levels (Telford, McCarthy-Jones, Corcoran, & Rowse, Reference Telford, McCarthy-Jones, Corcoran and Rowse2012). In this context, an automated algorithm has been recently developed to generate personalized recommendations regarding the optimal sequence of treatment for mood and anxiety disorders (Rubel, Fisher, Husen, & Lutz, Reference Rubel, Fisher, Husen and Lutz2018). Briefly, this algorithm uses cross-sectional and temporal symptom networks to derive strength centrality estimates that are then used to rank therapeutic modules (e.g. applied relaxation and cognitive restructuring) based on their potential clinical utility for a particular individual.
Relevant strengths of our investigation include the use of state-of-the-art NA techniques, as well as the comparison of two pharmacologically distinct ADs in terms of their longitudinal impact on the underlying MDD symptom-domains network. However, we should also consider some of its potential limitations: first, as network models estimate a very large set of parameters (Forbes, Wright, Markon, & Krueger, Reference Forbes, Wright, Markon and Krueger2017), it is fundamental to replicate our findings across larger datasets before definitive clinical inferences can be made. Nonetheless, we believe that our investigation had acceptable statistical power as demonstrated, e.g. by the relatively robust degree of overall network accuracy and stability (Fried & Cramer, Reference Fried and Cramer2017). Second, and as mentioned above, some of the associations between the MDD symptom-domains might have been causal whereas others might have been due to an underlying ‘common cause’ yet to be identified. Likewise, central nodes, especially those derived from cross-sectional data, may represent the ‘common effect’ of other peripheral nodes or may be just epiphenomena with no actual causal connection(s) within the network. Third, the specific characteristics of our depressed sample (e.g. mostly Caucasians with moderate to severe recurrent MDD) and study design (e.g. lack of a placebo group and exclusion of non-completers) might limit the generalizability of our findings to other populations and/or clinical contexts. Fourth, we investigated a limited range of all possible depressive symptoms and have only used a self-reported measure of MDD severity; hence, even though the QIDS-SR has been shown to be strongly correlated with other standardized clinician ratings (e.g. the Hamilton Depression Rating Scale) (Rush et al., Reference Rush, Trivedi, Ibrahim, Carmody, Arnow, Klein and Keller2003), future studies should also employ the latter when estimating psychopathological networks. Fifth, further studies are needed to investigate whether R 2 is indeed the best indicator of predictability when categorical variables are employed. Sixth, our setting of the hyperparameter ‘γ’ to ‘0’ might have led to some potential false positive findings in our secondary analyses. Seventh, the lack of differential effects of AD type on the underlying MDD network structure might have resulted from insufficient statistical power. Finally, NA represents a relatively novel data analytic approach (Borsboom & Cramer, Reference Borsboom and Cramer2013), and therefore key metrics (e.g. model fit, reliability and replicability, and clinically relevant centrality indices) (Forbes, Wright, Markon, & Krueger, Reference Forbes, Wright, Markon and Krueger2019; Fried & Cramer, Reference Fried and Cramer2017) as well as optimal regularization techniques (Williams, Rhemtulla, Wysocki, & Rast, Reference Williams, Rhemtulla, Wysocki and Rast2019) have yet to be definitively established.
Nonetheless, we believe that the systematic application of NA in psychiatry may not only lead to novel insights into the impact of therapeutic interventions on the causal symptomatic pathways driving the etiology and persistence of major mental disorders, but also provide a data-driven ‘syndrome reduction’ strategy for further neurobiological investigations (Belvederi Murri et al., Reference Belvederi Murri, Amore, Respino and Alexopoulos2018). Ultimately, we hope that NA will help foster the development of more streamlined/effective personalized care for individuals suffering from disabling medical conditions such as MDD.
Supplementary material
The supplementary material for this article can be found at https://doi.org/10.1017/S0033291720001002.
Acknowledgements
Dr Gustavo Turecki holds a Canada Research Chair (Tier 1) and a NARSAD Distinguished Investigator Award. He is supported by grants from the Canadian Institute of Health Research (CIHR), by the FRQS through the Quebec Network on Suicide, Mood Disorders and Related Disorders, and through an investigator-initiated research grant from Pfizer.


