Introduction
Cancers of the brain and the central nervous system (CNS) comprise a group of rare and heterogeneous tumours with respect to genetics and biology and account for approximately 3% of all cancer cases worldwide. Reference Miranda-Filho, Pineros and Soerjomataram1 It was estimated that approximately 3,000 Canadians would be diagnosed with brain and CNS cancers and 2,500 would die from the disease in 2020. Reference Brenner, Weir and Demers2,3 In the USA, it was estimated that about 86,970 primary brain tumours (26,170 malignant and 60,800 benign cases) would be diagnosed in 2019 and 16,830 patients would die from malignant brain cancer. 4 Furthermore, according to the National Brain Tumor Society, 4 about 700,000 people in the USA are living with brain tumour (30·9% are malignant and 69·1% are benign tumours) and the average survival rate for all malignant brain tumour patients is estimated at 35%. The standard treatment modalities for brain cancer include surgery, radiation therapy, chemotherapy or any combination depending on tumour type, grade, location, size and age of patient. Whole brain radiotherapy (WBRT) using either parallel opposed beams or intensity-modulated radiation therapy (IMRT) technique has been used for the treatment of brain cancers. Reference Park, Park and Yea5–Reference Remick, Kowalski and Khairnar9 However, in recent years, single fraction stereotactic radiosurgery (SRS) or fractionated stereotactic radiotherapy (SRT) has emerged as other treatment modalities and has proven to be extremely effective when treating brain metastases both as a single treatment modality and/or in conjunction with WBRT. Reference Sood, Pokhrel, McClinton, Lominska, Badkul, Jiang and Wang7,Reference Remick, Kowalski and Khairnar9,Reference Yamamoto, Serizawa and Shuto10 The gold standard for the delivery of brain SRS has been the use of the gamma-knife technology; Reference Jagannathan, Petit, Balsara, Hudes and Chin11–Reference Gerosa, Nicolato and Foroni15 however, due to the high cost, several Cancer Centers in recent years have opted to use Linac-based volumetric modulated arc therapy (VMAT), which employs continuous dynamic modulation of dose rate, field aperture and gantry speed, or IMRT or stereotactic cones to deliver brain SRS/SRT treatments. Reference Sood, Pokhrel, McClinton, Lominska, Badkul, Jiang and Wang7–Reference Remick, Kowalski and Khairnar9,Reference Bas Ayata, Ceylan, Kılıç, Güden and Engin16–Reference Howell, Smith and Jarrio23 Several studies have demonstrated that using VMAT for treatment of brain metastases is associated with reduced toxicity compared to whole-brain radiation therapy. Reference Zhang, Yang and Shi17–Reference Andrevska, Knight and Sale20
The complexity associated with the planning and delivery processes for SRS/SRT VMAT treatment plans necessitates diligent pre-treatment patient-specific quality assurance (QA) to ensure that the treatment planning calculated doses can be delivered by the linear accelerator within acceptable tolerances of 2–3 mm/2–3%. Reference Xia, Adamson, Zlateva and Giles22–Reference Park, Kim and Park30 Several techniques for pre-treatment QA of SRS/SRT VMAT treatment plans are currently available using devices such as the ArcCHECKTM (Sun Nuclear Corporation, Melbourne, FL, USA), MAPCheckTM (Sun Nuclear Corporation, Melbourne, FL, USA), Delta4TM (ScandiDos AB, Uppsala, Sweden) and MatriXXTM (IBA Dosimetry GmbH, Schwarzenbruck, Germany). Reference Xia, Adamson, Zlateva and Giles22,Reference Park, Kim and Park30–Reference Bailey, Kumaraswamy, Bakhtiari, Malhotra and Podgorsak35 In recent years, the use of the electronic portal imaging device (EPID) for pre-treatment patient-specific treatment plan verification has gained increased interest due to its simplicity. Reference Xia, Adamson, Zlateva and Giles22,Reference Howell, Smith and Jarrio23,Reference Defoor, Quino, Mavroidis, Papanikolaou and Stathakis26–Reference Koo, Darko and Osei29,Reference Bailey, Kumaraswamy, Bakhtiari, Malhotra and Podgorsak35–Reference Agarwal, Rastogi, Maria Das, Yoganathan, Udayakumar and Kumar39 The Varian EPID has been shown to be capable of producing high-resolution measured dose digital images which can be compared with predicted portal dose images calculated by the EclipseTM Treatment Planning System (TPS) based on the actual fluence distribution for every patient treatment plan fields. Reference Xia, Adamson, Zlateva and Giles22,Reference Howell, Smith and Jarrio23,Reference Liu, Adamson, Rodrigues, Zhou, Yin and Wu28–Reference Park, Kim and Park30,Reference Maraghechi, Davis, Badu, Fleck, Darko and Osei36,Reference Greer and Popescu40,41 Various methods including the dose difference (DD), distance-to-agreement (DTA) and the gamma (γ) index have been used to compare the measured and predicted dose images. Reference Xia, Adamson, Zlateva and Giles22–Reference Low, Toye, Phung and Huston24,Reference Defoor, Quino, Mavroidis, Papanikolaou and Stathakis26–Reference Park, Kim and Park30,Reference Bailey, Kumaraswamy, Bakhtiari, Malhotra and Podgorsak35–Reference Agarwal, Rastogi, Maria Das, Yoganathan, Udayakumar and Kumar39,Reference Low, Harms, Mutic and Purdy42–Reference Maraghechi, Davis, Mitchell, Shah, Fleck, Darko and Osei44 The DD is the difference in dose at a specified point in each of the predicted and measured dose distributions, and it is reflected as a percentage of the maximum dose, whereas the DTA represents the nearest distance between two points of equal dose on the predicted and measured dose images when superimposed. Reference Xia, Adamson, Zlateva and Giles22,Reference Howell, Smith and Jarrio23,Reference Park, Kim and Park30,Reference Low, Harms, Mutic and Purdy42,Reference Low and Dempsey43,Reference Yeo and Kim45 According to Low et al. Reference Low, Harms, Mutic and Purdy42 and Low & Dempsey, Reference Low and Dempsey43 the DD method is very sensitive in areas of high-dose gradient and a small spatial misalignment will cause a large DD between the measured and the calculated dose distributions, whereas the DTA method is sensitive in areas of low-dose gradient and a small DD in low-dose area could result in large DTA values. Consequently, it is a common practice to compare the predicted and measured dose distributions using the gamma (γ) index technique which takes both the DD and DTA into consideration. Reference Xia, Adamson, Zlateva and Giles22–Reference Low, Toye, Phung and Huston24,Reference Defoor, Quino, Mavroidis, Papanikolaou and Stathakis26–Reference Park, Kim and Park30,Reference Bailey, Kumaraswamy, Bakhtiari, Malhotra and Podgorsak35–Reference Agarwal, Rastogi, Maria Das, Yoganathan, Udayakumar and Kumar39,Reference Low, Harms, Mutic and Purdy42–Reference Maraghechi, Davis, Mitchell, Shah, Fleck, Darko and Osei44 This evaluation method indicates a satisfactory agreement between a specific dose point in the predicted and measured dose images when the dimensionless quantity γ is ≤1, otherwise the dose point is considered to fail. Reference Xia, Adamson, Zlateva and Giles22,Reference Low, Toye, Phung and Huston24,Reference Park, Kim and Park30,Reference Low, Harms, Mutic and Purdy42,Reference Low and Dempsey43 The overall agreement of a set of predicted and measured dose distributions is characterised by the percentage of dose points that fulfil passing criteria, known as the gamma passing rate (%GP). In addition to the gamma passing rate, the maximum gamma (γmax) and average gamma (γave) values for a dose image comparison may be obtained to provide further insight into the respective dose distributions. The goal of this study was to evaluate the gamma index-based analysis performed for SRS/SRT VMAT treatment fields for six DTA/DD gamma criteria combinations ranging from 1 to 3 mm and 1–3% to investigate the influence of different gamma criteria on the gamma passing rate, maximum gamma and the average gamma. We also investigated the impact of different low-dose thresholds of Field+0%, +5% and +10% regions of interest on the gamma parameters.
Materials and Methods
We conducted a retrospective evaluation of 118 EPID patient-specific pre-treatment VMAT QA dosimetric measurements of 47 brain SRS/SRT patients treated at our Center from November 2019 to January 2020 using the integrated Varian solution (RapidArcTM planning, EPID and Portal dosimetry system) for planning, delivery and EPID QA analysis. Patient treatment plans were delivered on Varian TrueBeam linear accelerators (Varian Medical Systems, Palo Alto, CA, USA) equipped with 120 multi-leaf collimators. The EPID dose images were collected via one of two integrated amorphous silicon EPIDs: Varian PortalVision AS1000 (40 × 30 cm2 flat-panel, matrix of 1,024 × 768 pixels and 0·392 mm pixel resolution) or Varian AS1200 (43 × 43 cm2 flat-panel, matrix of 1,190 × 1,190 pixels and 0·336 mm pixel resolution) with the capability of integrated dose acquisition modes. The mechanical calibration of the EPID exact arms is done by our in-house electronic technology staff, and the EPID dosimetry configuration and calibration are done by medical physicists.
Treatment planning for intracranial SRS/SRT
The treatment plans for all patients were accomplished in the EclipseTM TPS (Varian Medical Systems, Palo Alto, CA, USA). The segmentation of the target and all the normal organs at risk (OARs) structures was based on institutional guidelines and included the delineation of the target (i.e. gross tumour volume (GTV)) and the OARs (i.e. brainstem, lens of the eyes, optic chiasm and healthy brain) aided by a T1-weighted MRI images. The RapidArcTM treatment plans were generated using 6MV, 6MV-FFF or 10MV-FFF photon beams and consisted of two to four arc fields and a prescription of either a single dose of 15–20 Gy or fractionated dose of 25–30 Gy in 3–5 fractions. The GTV target coverage is considered acceptable when at least 99% of the GTV volume is covered by 100% of the prescribed dose (V100 PD > 99%) and a maximum dose of 160% of the prescribed dose.
Patient-specific portal dosimetry QA
The basis of portal dosimetry is that for each treatment field, a predicted fluence image is calculated in the EclipseTM TPS. The TPS calculates the expected fluence from EPID for the verification plan in terms of absolute pixel values. The verification plan is subsequently delivered on the EPID using an integrated image acquisition mode via the ARIATM system on a TrueBeamTM Linac similar to the actual clinical plan but delivered in the QA mode. The details of the portal dosimetry QA processes including the portal dose prediction, portal dose measurements, portal dose analysis and calibration of the EPID have been reported in a previous study. Reference Maraghechi, Davis, Badu, Fleck, Darko and Osei36
Portal dose prediction
The portal dose prediction image for each treatment beam was calculated by superposing the patients’ treatment beams onto the portal imager’s geometry at 100 cm source-to-image distance (SID) using the Portal Dose Image Prediction Algorithm in the EclipseTM TPS version 13.6 (Varian Medical Systems, Palo Alto, CA, USA). Separate portal dose prediction image was calculated for each arc field using the actual planned parameters (gantry angles, collimator rotation, field size, dynamic MLC sequence, dose rate and number of monitor units) as in the original field used for the patient treatment.
Portal dose measurements
All verification plans were delivered on Varian TrueBeamTM Linacs using the integrated image acquisition mode with the calibrated EPID at the same SID of 100 cm as used during the absolute calibration of the imager with no additional build up on the imager. Data were acquired with the gantry rotating (arc motion), while the EPID itself was static relative to the gantry. Daily QA is performed on all linear accelerators to ensure consistency in output, symmetry and flatness. The EPID was calibrated according to the vendor’s specifications, with dark field, flood field and absolute dose calibration. 41 The EPID response was scaled such that 1 Calibrated Unit (CU) corresponds to 100 monitor units (MU) delivered by a 10 × 10 cm2 open field at 100 cm SID. The diagonal profile correction (used to scale the off-axis pixel response after flood field flattening) was performed as recommended by Varian. The beam intensity profile was measured at dmax in water for a 40 × 40 cm2 open field. This profile correction and absolute dose calibration are applied on each integrated image acquisition.
Portal dose analysis
The dedicated ARIA™ Portal Dosimetry Review workspace within the Eclipse™ TPS was used to evaluate the agreement between the predicted and measured images. Dosimetric analysis of the PortalVision dose images was performed through the Varian Portal Dosimetry Version 13.6. The gamma index concept in the portal dosimetry system was used to quantify the agreement between the predicted and measured images. The assumption made is that if the images agree within set accepted tolerances, then the treatment plan is dosimetrically deliverable by the treatment machine. The absolute gamma analyses were performed to obtain the gamma passing rate (%GP), maximum gamma (γmax) and average gamma (γave) for each beam in each patient treatment plan. The improved gamma calculation method in the Portal Dosimetry Version 13.6 was employed for all calculations, which allows for interpolation between neighbouring pixels when searching. Each image was assessed using three different regions of interest (ROIs), namely the Field+0%, +5% and +10% low-dose thresholds. In addition, we investigated the impact of 3 mm/3%, 3 mm/2%, 3 mm/1%, 2 mm/3%, 2 mm/2%, 2 mm/1%, 1 mm/3%, 1 mm/2% and 1 mm/1% DTA/DD criteria on the gamma passing rate, maximum gamma and average gamma.
Results
We retrospectively analysed 118 EPID patient-specific pre-treatment QA dosimetric measurements consisting of 47 intracranial cancer patients VMAT treatment plans. We evaluated the gamma index-based analysis performed for each VMAT field for six different DTA/DD criteria combinations ranging from 1 to 3 mm and 1–3% to investigate the influence of different gamma criteria on the %GP, γmax and γave. We also investigated the influence of the Field+0%, +5% and +10% low-dose thresholds’ regions of interest on the gamma parameters. We used the concept of the equivalent spherical diameter of an irregularly shaped object to estimate the size of all targets using the relationship below:
 $${d_{eqi}} = 3\sqrt {{{6*v} \over \pi }} $$
where d eqi is the equivalent spherical diameter of the target and v is the target volume. In this study, we stratified the targets sizes into four groups of x ≤ 1 cm, 1 cm < x ≤ 2 cm, 2 cm < x ≤ 3 cm and x > 3 cm based on the equivalent spherical diameter of the targets.
Percentage gamma passing rate (%GP)
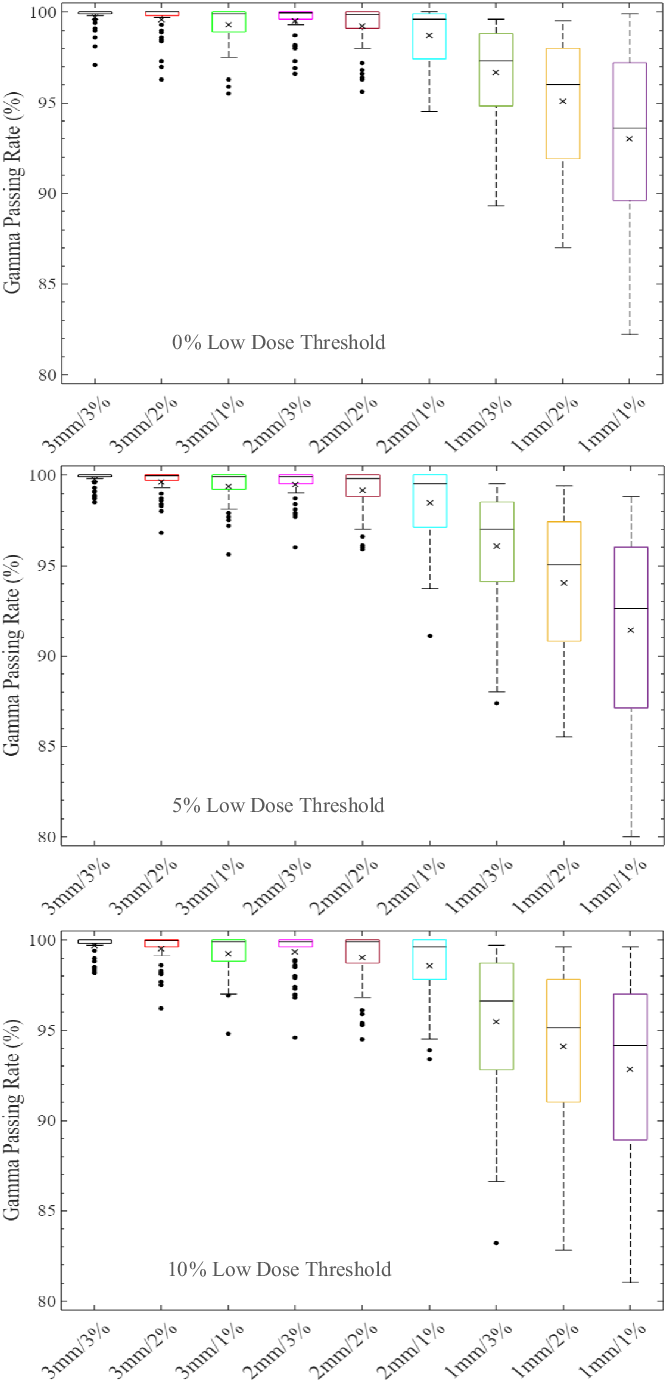
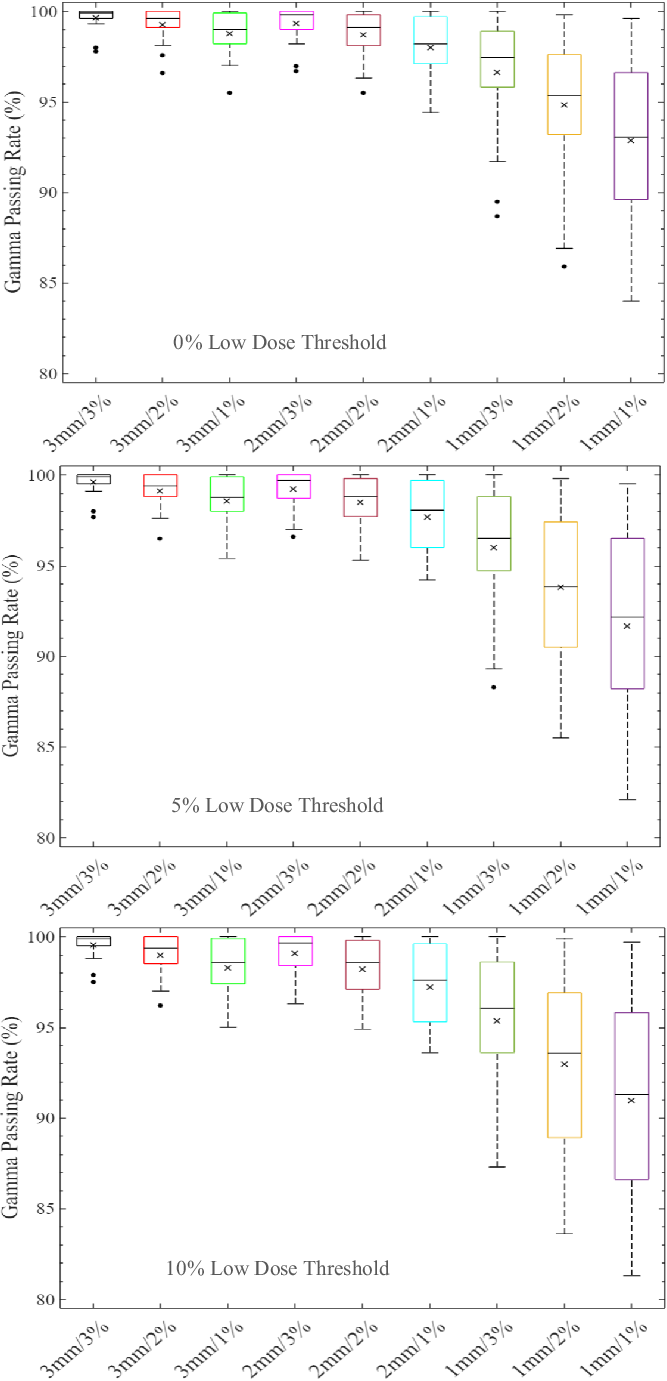
The distribution of the %GP stratified into the four different target sizes of x ≤ 1 cm, 1 cm < x ≤ 2 cm, 2 cm < x ≤ 3 cm and x > 3 cm is represented by boxplots in Figures 1–4, respectively, for different low-dose thresholds. The boxplots (Figures 1–4) show the overall spread of the %GP (minimum−maximum), the lower quartile (Q1, i.e. 25th percentile), upper quartile (Q3, i.e. 75th percentile), the interquartile range (Q3-Q1), the mean, median and any %GP outliers (i.e. %GP data points that are located outside the whiskers of the boxplots). The interquartile range describes the middle 50% of the %GP when ordered from the lowest to highest, and it is often seen as a better measure of spread than the range as it is not influenced by %GP outliers. Tables 1–4 show a summary of the statistical analysis of the %GP stratified into target sizes of x ≤ 1 cm, 1 cm < x ≤ 2 cm, 2 cm < x ≤ 3 cm and x > 3 cm, respectively, for different DTA/DD acceptance criteria and low-dose thresholds. A similar statistical analysis for all the target sizes combined is shown in Table 5. The gamma index analysis shows that for patient-specific intracranial SRS/SRT VMAT QA using the portal dosimetry, the overall mean %GP ranges: >99% for 3 mm/1–3%, 97·8 ± 2·4%–99·2 ± 1·3% for 2 mm/1–3%, 90·6 ± 9·1%–94·5 ± 6·1% for 1 mm/2–3% and 87·5 ± 10·0%–89·3 ± 9·3% for 1 mm/1% (Table 5).

Figure 1. Boxplots of percentage gamma passing rates (%GP) for target sizes x ≤ 1 cm at different gamma analysis distance-to-agreement and dose difference (DTA/DD) criteria and for Field+0%, +5% and +10% low-dose threshold regions of interest. The boxplots show the minimum, maximum, mean and median %GP, the lower quartile (Q1, i.e. 25th percentile), upper quartile (Q3, i.e. 75th percentile), interquartile range (Q3-Q1) and the %GP outliers (i.e. %GP data points that are located outside the whiskers of the boxplots). The interquartile range describes the middle 50% of the %GP when ordered from lowest to highest and is represented by the width of each box in the plot.

Figure 2. Boxplots of percentage gamma passing rates (%GP) for target sizes 1 cm < x ≤ 2 cm at different gamma analysis distance-to-agreement and dose difference (DTA/DD) criteria and for Field+0%, +5% and +10% low-dose threshold regions of interest. The boxplots show the minimum, maximum, mean and median %GP, the lower quartile (Q1, i.e. 25th percentile), upper quartile (Q3, i.e. 75th percentile), interquartile range (Q3–Q1) and the %GP outliers (i.e. %GP data points that are located outside the whiskers of the boxplots). The interquartile range describes the middle 50% of the data when ordered from lowest to highest and is represented by the width of each box in the plot.

Figure 3. Boxplots of percentage gamma passing rates (%GP) for target sizes 2 cm < x ≤ 3 cm at different gamma analysis distance-to-agreement and dose difference (DTA/DD) criteria and for Field+0%, +5% and +10% low-dose threshold regions of interest. The boxplots show the minimum, maximum, mean and median %GP, the lower quartile (Q1, i.e. 25th percentile), upper quartile (Q3, i.e. 75th percentile), interquartile range (Q3–Q1) and the %GP outliers (i.e. %GP data points that are located outside the whiskers of the boxplots). The interquartile range describes the middle 50% of the data when ordered from lowest to highest and is represented by the width of each box in the plot.

Figure 4. Boxplots of percentage gamma passing rates (%GP) for target sizes x > 3 cm at different gamma analysis distance-to-agreement and dose difference (DTA/DD) criteria and for Field+0%, +5% and +10% low-dose threshold regions of interest. The boxplots show the minimum, maximum, mean and median %GP, the lower quartile (Q1, i.e. 25th percentile), upper quartile (Q3, i.e. 75th percentile), interquartile range (Q3–Q1) and the %GP outliers (i.e. %GP data points that are located outside the whiskers of the boxplots). The interquartile range describes the middle 50% of the data when ordered from lowest to highest and is represented by the width of each box in the plot.
Table 1. A summary of the statistical analysis of the percentage gamma passing rate for target sizes x ≤ 1 cm (n = 28) for different gamma analysis distance-to-agreement and dose difference (DTA/DD) criteria and for field+0%, +5% and +10% low-dose threshold regions of interest (ROIs)
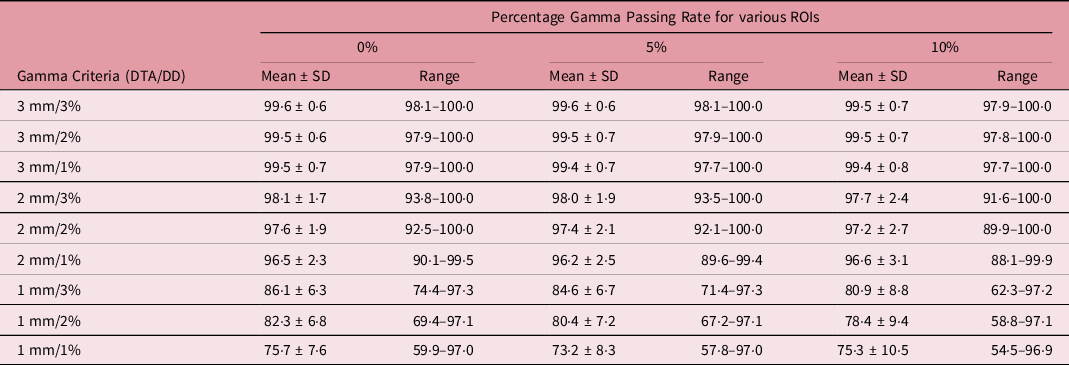
Table 2. A summary of the statistical analysis of the percentage gamma passing rate for target sizes 1 cm < x ≤ 2 cm (n = 50) for different gamma analysis distance-to-agreement and dose difference (DTA/DD) criteria and for field+0%, +5% and +10% low-dose threshold regions of interest (ROIs)

Table 3. A summary of the statistical analysis of the percentage gamma passing rate for target sizes 2 cm < x ≤ 3 cm (n = 22) at different gamma analysis distance-to-agreement and dose difference (DTA/DD) criteria and for field+0%, +5% and +10% low-dose threshold regions of interest (ROIs)
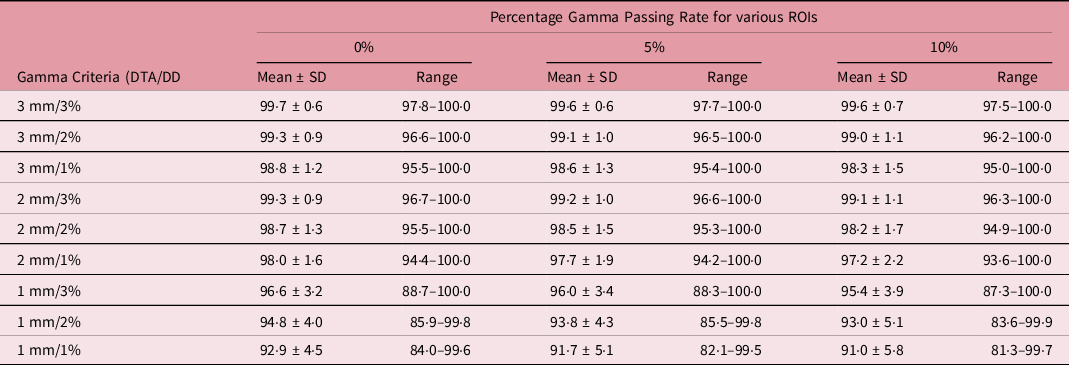
Table 4. A summary of the statistical analysis of the percentage gamma passing rate for target sizes x > 3 cm (n = 18) at different gamma analysis distance-to-agreement and dose difference (DTA/DD) criteria and for field+0%, +5% and +10% low-dose threshold regions of interest (ROIs)
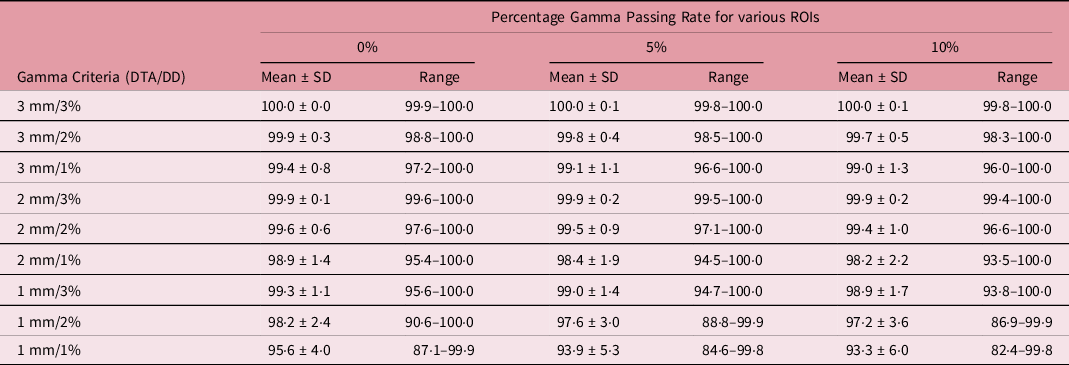
Table 5. A summary of the statistical analysis of the percentage gamma passing rate for all target sizes (n = 118) at different gamma analysis distance-to-agreement and dose difference (DTA/DD) criteria and for field+0%, +5% and +10% low-dose threshold regions of interest (ROIs)

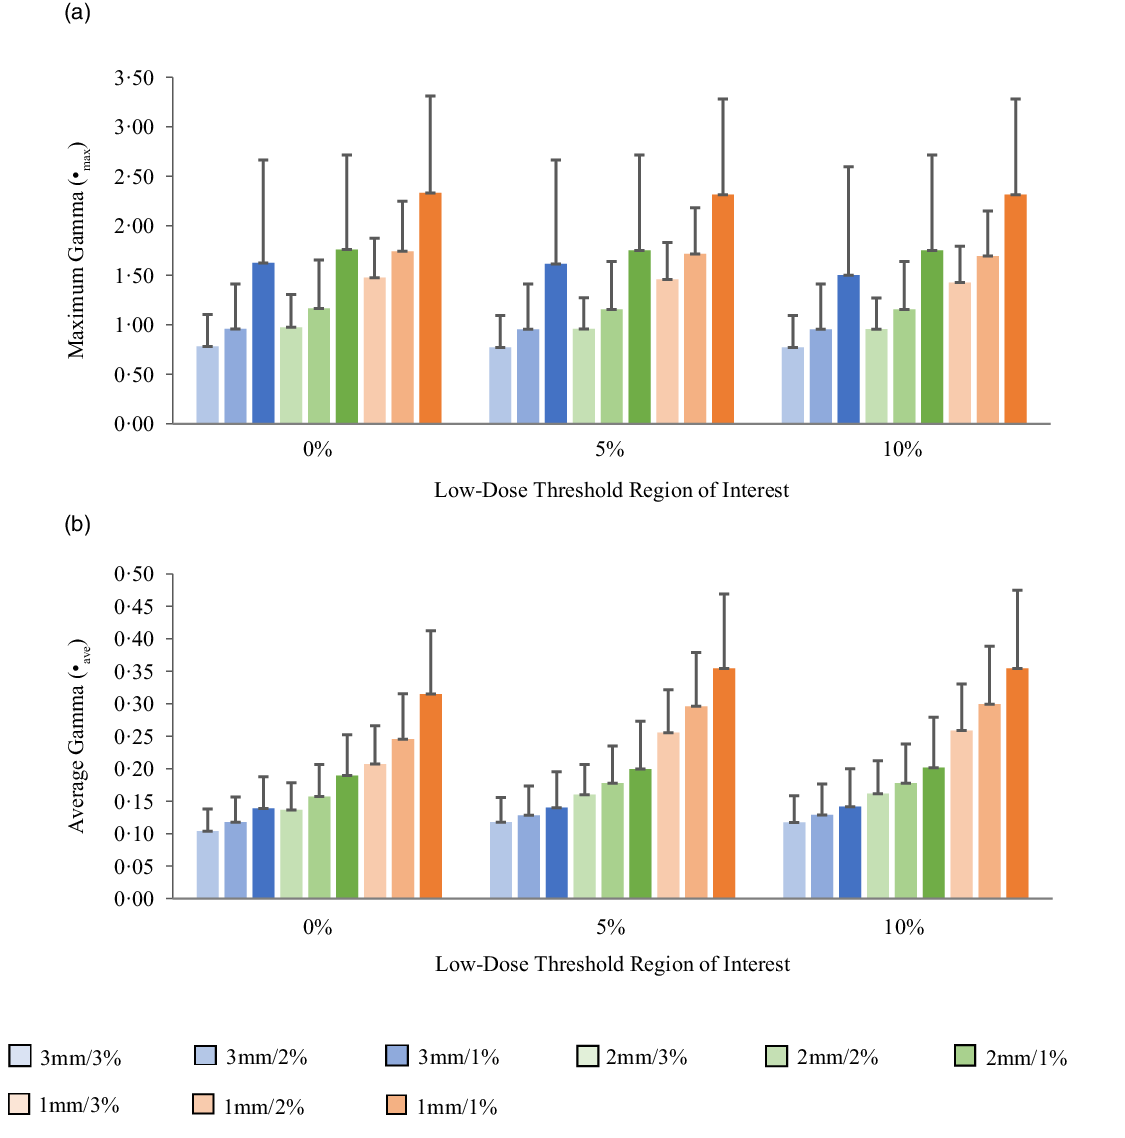
Maximum gamma (γmax)
Figures 5a, 6a, 7a and 8a show bar charts of the mean γmax for target sizes ≤1 cm, 1 cm < x ≤ 2 cm, 2 cm < x ≤ 3 cm and >3 cm, respectively, for different low-dose thresholds and DTA/DD criteria. The indicated error bars in the bar charts represent one standard deviation. A summary of the statistical analysis of the γmax for all the target sizes (n = 118) at different gamma analysis DTA/DD criteria and for different low-dose thresholds is shown in Table 6. The gamma index analysis shows that for patient-specific intracranial SRS/SRT VMAT QA using the portal dosimetry, the mean γmax ranges: 2·33 ± 2·37–4·25 ± 3·56 for 3 mm/1–3%, 2·72 ± 2·34–4·47 ± 3·41 for 2 mm/1–3% and 4·24 ± 2·94–5·24 ± 3·21 for 1 mm/1–3% for target sizes ≤1 cm (Figure 5a). Also for target sizes 1 cm < x ≤ 2 cm, the mean γmax ranges: 1·02 ± 0·47–2·10 ± 1·68 for 3 mm/1–3%, 1·24 ± 0·43–2·43 ± 1·70 for 2 mm/1–3% and 1·88 ± 0·53–3·12 ± 1·63 for 1 mm/1–3% (Figure 6a). For target sizes 2 cm < x ≤ 3 cm, the mean γmax ranges: 1·17 ± 0·48–2·58 ± 1·41 for 3 mm/1–3%, 1·37 ± 0·56–2·76 ± 1·37 for 2 mm/1–3% and 1·81 ± 0·70–3·52 ± 1·44 for 1 mm/1–3% (Figure 7a). And for target sizes >3 cm, the mean γmax ranges: 0·77 ± 0·32–1·63 ± 1·04 for 3 mm/1–3%, 0·96 ± 0·31–1·76 ± 0·95 for 2 mm/1–3% and 1·43 ± 0·37–2·33 ± 0·98 for 1 mm/1–3% (Figure 8a). The mean γmax is observed to increase with increased DTA and with increased DD for all low-dose thresholds. For the combined target sizes (n = 118), the overall mean γmax ranges: 1·32 ± 1·33–2·63 ± 2·35 for 3 mm/1–3%, 1·57 ± 1·36–2·87 ± 2·29 for 2 mm/1–3% and 2·36 ± 1·83–3·58 ± 2·23 for 1 mm/1–3% for the low-dose threshold (Table 6).
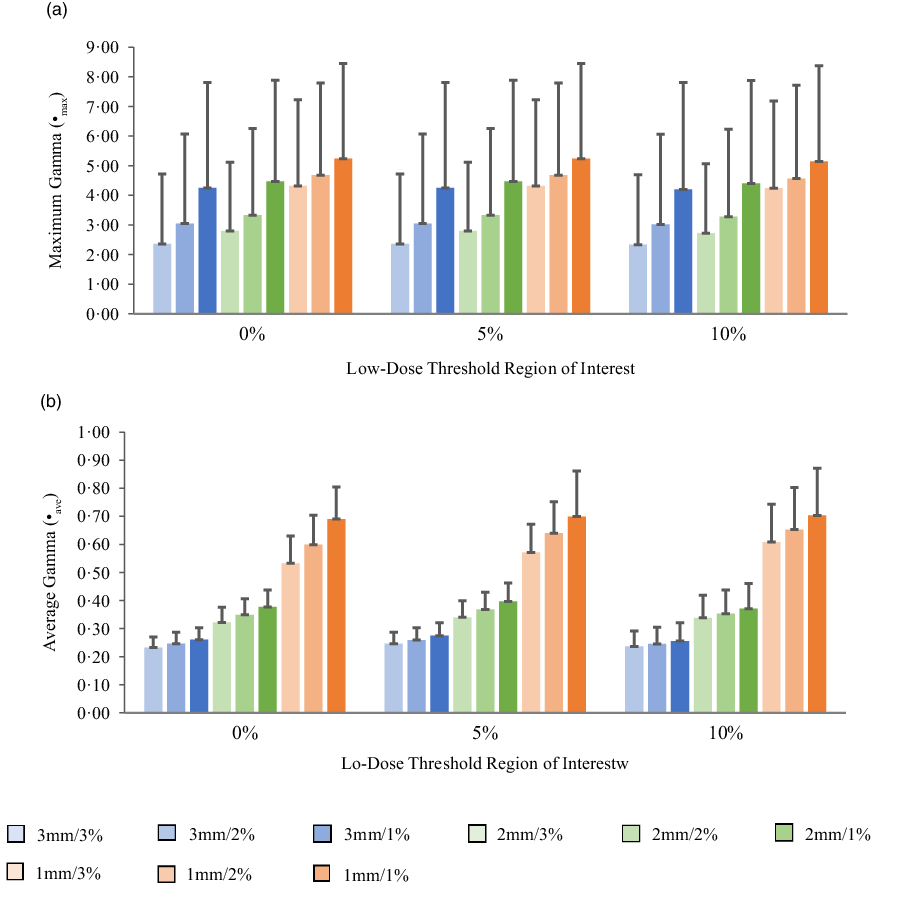
Figure 5. Bar charts of the maximum gamma (a) and average gamma (b) for target sizes x ≤ 1 cm at different gamma analysis distance-to-agreement and dose difference (DTA/DD) criteria for Field+0%, +5% and +10% low-dose threshold regions of interest.
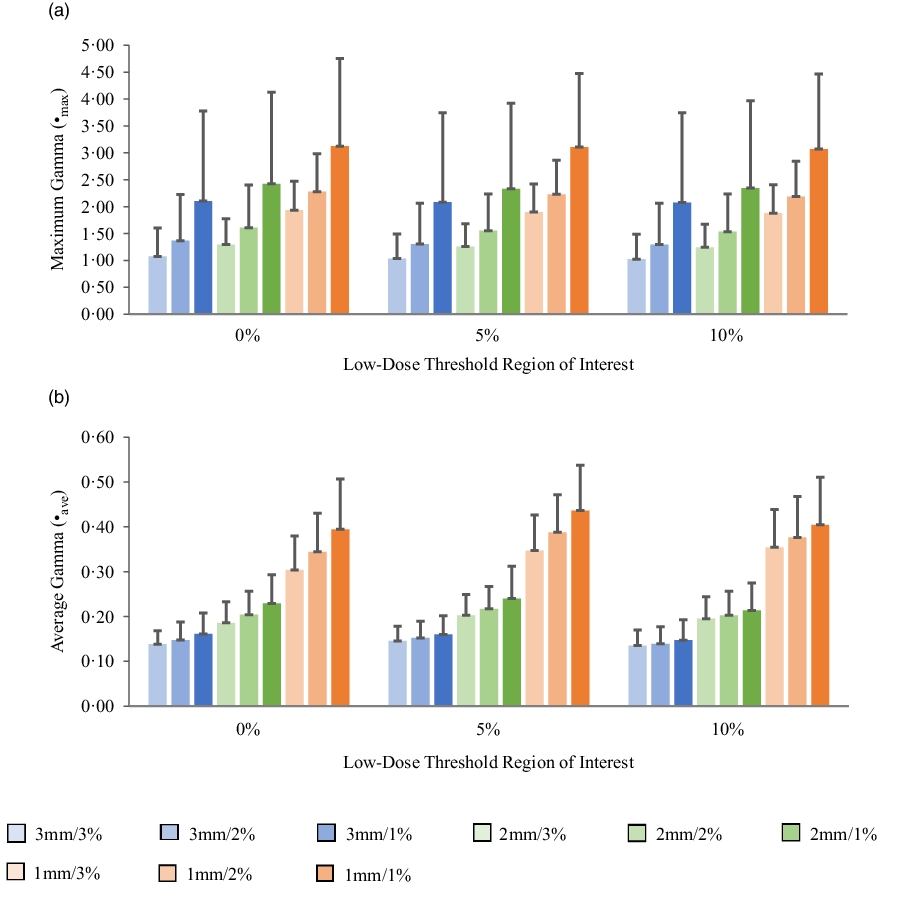
Figure 6. Bar charts of the maximum gamma (a) and average gamma (b) for target sizes 1 cm < x ≤ 2 cm at different gamma analysis distance-to-agreement and dose difference (DTA/DD) criteria for Field+0%, +5% and +10% low-dose threshold regions of interest.
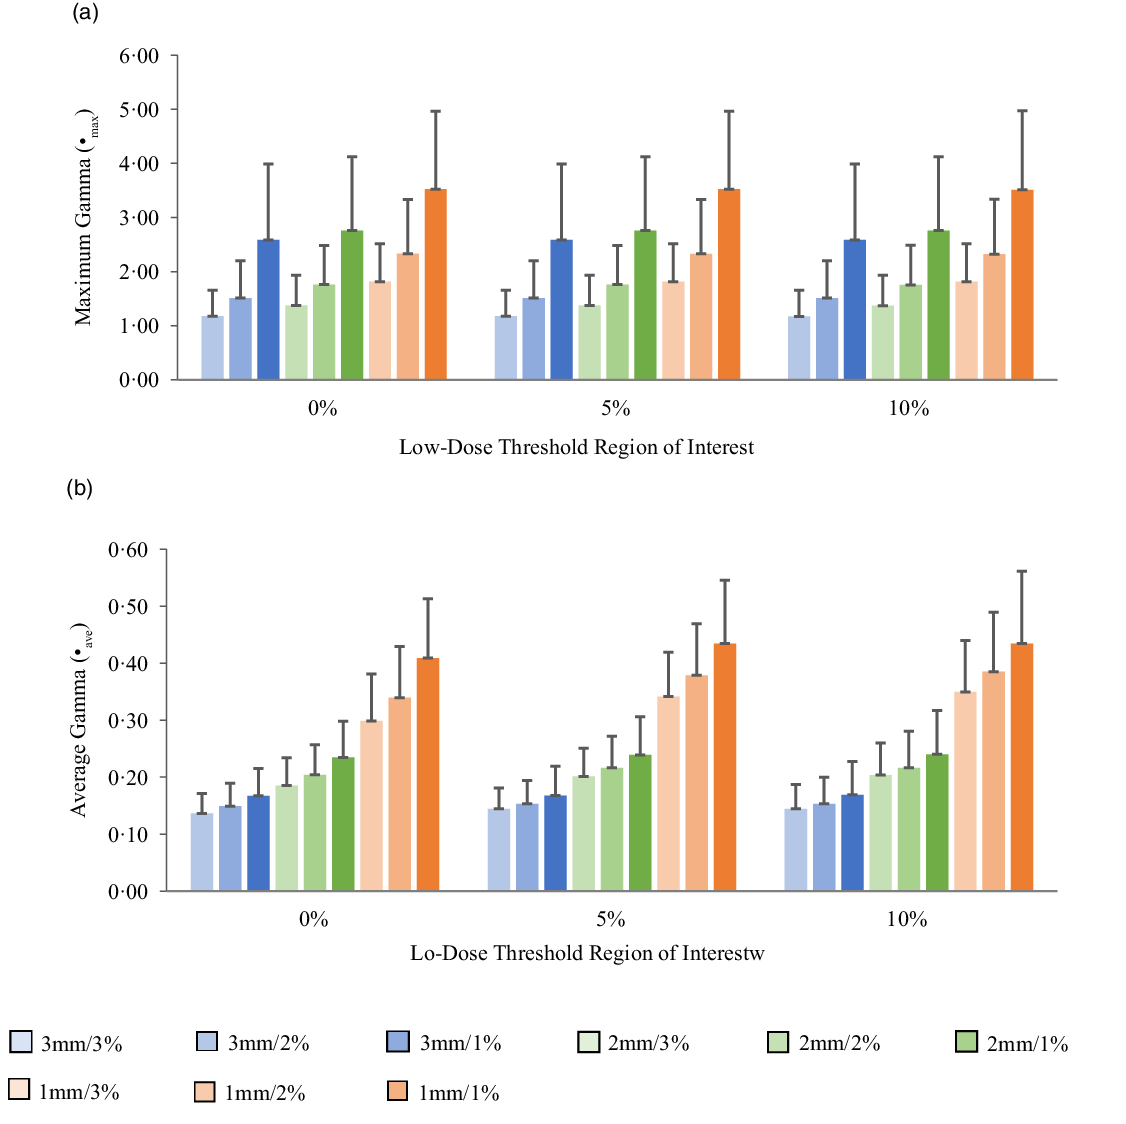
Figure 7. Bar charts of the maximum gamma (a) and average gamma (b) for target sizes 2 cm < x ≤ 3 cm at different gamma analysis distance-to-agreement and dose difference (DTA/DD) criteria for Field+0%, +5% and +10% low-dose threshold regions of interest.

Figure 8. Bar charts of the maximum gamma (a) and average gamma (b) for target sizes x > 3 cm at different gamma analysis distance-to-agreement and dose difference (DTA/DD) criteria for Field+0%, +5% and +10% low-dose threshold regions of interest.
Table 6. A summary of the statistical analysis of maximum gamma and average gamma for all target sizes (n = 118) at different gamma analysis distance-to-agreement and dose difference (DTA/DD) criteria and for 0%, 5% and 10% low-dose threshold regions of interest (ROIs).

Average gamma (γave)
The mean average gamma (γave) for target sizes ≤1 cm, 1 cm < x ≤ 2 cm, 2 cm < x ≤ 3 cm and >3 cm is represented by bar charts in Figures 5b, 6b, 7b and 8b, respectively, for different low-dose thresholds and DTA/DD criteria. The indicated error bars in the bar charts represent one standard deviation. A summary of the statistical analysis of the γave for all target sizes (n = 118) at different gamma analysis DTA/DD criteria and for different low-dose threshold is shown in Table 6. The gamma index analysis shows that for patient-specific intracranial SRS/SRT VMAT QA using the portal dosimetry, the mean γave ranges: 0·23 ± 0·04–0·27 ± 0·05 for 3 mm/1–3%, 0·32 ± 0·05–0·40 ± 0·07 for 2 mm/1–3% and 0·53 ± 0·10–0·70 ± 0·17 for 1 mm/1–3% for target sizes x ≤ 1 cm (Figure 5b). Also for target sizes 1 cm < x ≤ 2 cm, the mean γave ranges: 0·14 ± 0·03–0·16 ± 0·05 for 3 mm/1–3%, 0·19 ± 0·05–0·24 ± 0·07 for 2 mm/1–3% and 0·30 ± 0·08–0·44 ± 0·10 for 1 mm/1–3% (Figure 6b). For target sizes 2 cm < x ≤ 3 cm, the mean γmax ranges: 0·14 ± 0·03–0·17 ± 0·06 for 3 mm/1–3%, 0·19 ± 0·05–0·24 ± 0·08 for 2 mm/1–3% and 0·30 ± 0·08–0·43 ± 0·13 for 1 mm/1–3% (Figure 7b). And for target sizes x > 3 cm, the mean γmax ranges 0·10 ± 0·03–0·14 ± 0·06 for 3 mm/1–3%, 0·14 ± 0·04–0·20 ± 0·08 for 2 mm/1–3% and 0·21 ± 0·06–0·35 ± 0·12 for 1 mm/1–3% (Figure 8b). The mean γave is observed to increase with increased DTA and also with increased DD for all low-dose thresholds. For the combined target sizes (n = 118), the overall mean γave ranges: 0·16 ± 0·06–0·19 ± 0·07 for 3 mm/1–3%, 0·21 ± 0·08–0·27 ± 0·10 for 2 mm/1–3% and 0·34 ± 0·14–0·49 ± 0·17 for 1 mm/1–3% for all low-dose thresholds (Table 6).
Discussion
In clinical practice, a common spatial/dose criterion of 3 mm/3% and a %GP of 90–95% have typically been used for both IMRT and VMAT pre-treatment QA. Reference Ezzell, Burmeister and Dogan46,Reference Stock, Kroupa and Georg47,Reference Stasi, Bresciani, Miranti, Maggio, Sapino and Gabriele49 The American Association of Physicists in Medicine (AAPM) Task Group 119 (TG 119) proposed using a spatial/dose criterion of 3 mm/3% with a low-dose threshold of 10% and a %GP of 90% for per beam analysis and 88–90% for composite irradiations. Reference Ezzell, Burmeister and Dogan46 Although, according to Stasi et al., Reference Stasi, Bresciani, Miranti, Maggio, Sapino and Gabriele49 when institutions use the 3%/3 mm criterion, the gamma passing rate action level most used is 95%. Several studies have questioned whether or not the 3 mm/3% criterion for patient-specific VMAT and IMRT pre-treatment QA is adequately sensitive, especially for small treatment fields <5 cm2 or stricter criteria of 1–2 mm/1–3% should be considered in the clinical settings. Reference Xia, Adamson, Zlateva and Giles22,Reference Koo, Darko and Osei29,Reference Maraghechi, Davis, Badu, Fleck, Darko and Osei36,Reference Maraghechi, Davis, Mitchell, Shah, Fleck, Darko and Osei44,Reference Miften, Olch and Mihailidis48,Reference Kim, Park, Kim, Kim, Ye and Park50–Reference Lechner, Primeßnig, Nenoff, Wesolowska, Izewska and Georg54 Steers and Frass Reference Steers and Fraass53 investigated an approach to quantitatively determine gamma criteria sensitivity to induced errors. They observed that errors as large as 15% MU errors and ± 1 cm random MLC errors can potentially be missed in IMRT QA with the commonly used gamma criteria of 3 mm/3%, 10% low-dose threshold and 90% gamma passing rate. Stasi et al. Reference Stasi, Bresciani, Miranti, Maggio, Sapino and Gabriele49 also reported that the low sensitivity of 3 mm/3% global gamma method indicates that it has a disputable predictive power for per-patient IMRT QA. We previously reported that a stricter pre-treatment QA action level is required for VMAT QA for improved sensitivity. Reference Koo, Darko and Osei29,Reference Maraghechi, Davis, Badu, Fleck, Darko and Osei36 According to Lechner et al., Reference Lechner, Primeßnig, Nenoff, Wesolowska, Izewska and Georg54 a stricter 3 mm/1% acceptance criterion than the standard 3%/3 mm must be used in small field dosimetry to accurately evaluate treatment delivery plans. Heilemann et al. Reference Heilemann, Poppe and Laub51 investigated the effects of small systematic MLC misalignments on the quality of VMAT QA verification measurements for prostate and head and neck treatment plans using the 2D-Array Seven29 (PTW-Freiburg, Germany) and the Delta4 (Scandidos). They demonstrated that the 3 mm/3% gamma index criterion is not sufficient to analyse VMAT plans and suggested using a stricter criterion of 2 mm/2% with passing rates >90% for both IMRT and VMAT plans pre-treatment QA. In a recent publication, the AAPM Task Group 218 (TG-218) published guidelines for pre-treatment QA and recommended a gamma criterion of 2 mm/3% with 10% low-dose threshold and %GP ≥ 90% for IMRT and VMAT QA. Reference Miften, Olch and Mihailidis48 Xia et al. Reference Xia, Adamson, Zlateva and Giles22 have also suggested a stricter criterion of 1 mm/3% with 10% low-dose threshold and %GP ≥ 90%. Our data suggest that the spatial tolerance criteria for brain SRS/SRT VMAT pre-treatment QA could be tightened to 1 mm while still maintaining an in-control QA process. Thus, it is possible to achieve a %GP ≥ 90% for SRS/SRT VMAT pre-treatment QA with 1 mm/2% or 1 mm/3% criterion with no extra burden on resources and time constraints. Kim et al. Reference Kim, Park, Kim, Kim, Ye and Park50 investigated the sensitivity of several gamma criteria for patient-specific VMAT QA for SBRT treatment plans using the MapCHECK2 detector array (Sun Nuclear Corporation, Melbourne, FL, USA) and EBT2 film (Ashland Inc., Covington, KY, USA). They suggested that a gamma criterion of 1 mm/2% with passing rates of 90 and 80% should be used for patient-specific VMAT QA for SBRT when using MapCHECK2TM and EBT2TM film, respectively.
A number of studies have suggested using a combination of the average gamma, maximum gamma and the percentage gamma passing rate to analyse dose distributions and to make judgements regarding the agreement between measurements and calculation based on clinically driven criteria. Reference Xia, Adamson, Zlateva and Giles22,Reference Howell, Smith and Jarrio23,Reference Stock, Kroupa and Georg47,Reference Miften, Olch and Mihailidis48,Reference Heilemann, Poppe and Laub51,Reference Childress, White, Bloch, Salehpour, Dong and Rosen55–Reference Atiq, Atiq, Iqbal, Shamsi, Andleeb and Buzdar57 According to Miften et al., Reference Miften, Olch and Mihailidis48 the analysis of the maximum gamma and the average gamma should be considered together with the percentage gamma passing rate for pre-treatment plan QA. Our data suggest an overall mean γave ≤ 0·19 for 3 mm/1–3%, ≤ 0·27 for 2 mm/1–3% and ≤ 0·49 for 1 mm/1–3%; and an overall mean γmax ≤ 2·63 for 3 mm/1–3%, ≤ 2·87 for 2 mm/1–3% and ≤ 3·58 for 1 mm/1–3% for patient-specific intracranial SRS/SRT VMAT pre-treatment QA using the portal dosimetry. Stock et al. Reference Stock, Kroupa and Georg47 used a gamma criterion of 3%/3 mm to evaluate nine IMRT plans to decide on the acceptability of IMRT plan verification QA. They reported a mean γave of 0·45 ± 0·10 and considered a plan to be acceptable if the average gamma <0·5, maximum gamma <1·5 and gamma passing rate >95%. Howell et al. Reference Howell, Smith and Jarrio23 evaluated the maximum gamma and average gamma for 1152 treatment fields from 152 treatment plans and reported a mean γmax of 2·4 ± 0·8 and a mean γave of 0·33 ± 0·13. van Zijtveld et al. Reference van Zijtveld, Dirkx, de Boer and Heijmen58 also performed gamma analysis using a gamma criterion of 3%/3 mm and reported a mean γave value of 0·43 ± 0·13 for 75 patients pre-treatment plan QA. Similarly, Atiq et al. Reference Atiq, Atiq, Iqbal, Shamsi, Andleeb and Buzdar57 evaluated pre-treatment IMRT QA for 14 head and neck patients’ treatment plans using the gamma analysis to investigate gamma criteria that assures a good quality plan and reported mean γmax of 2·66 ± 2·38 and mean γave of 0·30 ± 0·07 for 3 mm/5% gamma criterion.
Conclusion
Although there are several recommendations for gamma criteria for standard IMRT and VMAT pre-treatment QA, there are no specifics for intracranial SRS/SRT VMAT QA. The available criteria for standard VMAT may not be adequately sensitive for SRS/SRT VMAT techniques due to the high-dose gradients and small margins; thus, a tighter criterion may be necessary for SRS/SRT patient-specific VMAT QA. Our current data suggest that intracranial SRS/SRT VMAT QA can be accomplished using the EPID with stricter gamma criterion of 1 mm/2% or 1 mm/3% with %GP ≥ 90% with no extra burden on resources and time constraints. The EPID is a convenient device for pre-treatment VMAT QA with its large high-resolution detector array, a linear response to radiation dose, and it is easily available as part of modern linear accelerators. It is capable of measuring high-resolution digital dose images without the need for a phantom or additional external devices. Furthermore, a typical pre-treatment VMAT QA procedure using EPID dosimetry only requires a single delivery of the patient QA plan, consequently making it an efficient tool in high patient-throughput radiotherapy clinics. Although the associated high Z component materials render EPIDs far from being water-equivalent compared to other ionisation chamber devices, it can effectively detect errors related to the delivery of dynamically modulated beams, e.g., MLC positioning errors, incorrect data transfer to the linear accelerator, and limitations or inaccuracies of the treatment planning system. Portal dosimetry is however limited in its ability to detect delivery errors associated with gantry position inaccuracies which can be dealt with in separate system level testing of the gantry position accuracy.
Acknowledgements
The authors would like to acknowledge with gratitude Nicholas Majtenyi for helping with the plotting of some of the Figures.
Conflicts of Interest
The authors declare that the research was conducted in the absence of any commercial or financial relationships that could be construed as a potential conflict of interest.