INTRODUCTION
High-current relativistic electron beams produced by high-voltage (HV) pulsed power generators have been widely used in such diverse areas as high-power microwave (HPM) generation (Barker et al., Reference Barker, Booske, Luhmann and Nusinovich2005; Li et al., Reference Li, Yuan, Zhang, Shu and Zhang2008a), the development of high-energy gas laser (Beilis, Reference Beilis2007), controlled thermonuclear fusion (Liu et al., Reference Liu, Zou, Wang, He and Zeng2008b), and material surface modification (Ozur et al., Reference Ozur, Proskurovsky, Rotshtein and Markov2003). The beam power is mainly limited by HV pulsed power technology (Zou et al., Reference Zou, Liu, Zeng, Han, Yuan, Wang and Zhnag2006; Liu et al., Reference Liu, Yin, Ge, Zhan, Chen and Feng2007a, Reference Liu, Zhan, Zhang, Liu, Feng, Shu, Zhang and Wang2007b, Reference Liu, Zou, Wang, Zeng and He2008c). Recent research has focused on the generation, control, transport, and concentration of these beams. The behavior of the electron beam within the diode region of HV pulsed power generator is of critical importance (Zhou et al., Reference Zhou, Yu and He2007). In high power diodes, the beam electrons are often generated from cathode surface by a process generally termed explosive electron emission. This explosive process causes the formation of a neutral cloud that is simultaneously ionized by electrons, leading to the formation of a plasma sheath on the cathode surface (Huang et al., Reference Huang, Duan, Lan, Tan, Wang, Tang and He2008; Li et al., Reference Li, Liu, Wen, Men and Liu2008b). These types of cathodes can be named as passive plasma cathode because the plasma formation occurs under the application of the accelerating pulse (Krasik et al., Reference Krasik, Dunaevsky and Felsteiner2001; Burdovitsin & Oks, Reference Burdovitsin and Oks2008). However, the ensuing expansion of plasma sheath into the diode gap reduces the diode impedance, ultimately resulting in the pulse shortening (Li et al., Reference Li, Liu, Chang, Wan, Wen and Liu2009a, Reference Li, Liu, Wen and Liu2009c). Actually, the evolution of the expanding plasma turns out to be a rather intricate problem of nonequilibrium plasma physics and has not been fully characterized.
For pulsed emission of HPM sources, several recent high-current electron beam sources have emerged as providing high current density emission from cathodes with mechanically and thermally robust construction (Shiffler et al., Reference Shiffler, Heidger, Cartwright, Vaia, Liptak, Price, Lacour and Golby2008b; Korovin et al., Reference Korovin, Litvinov, Mesyats, Rostov, Rukin, Shpak and Yalandin2006; Li et al., Reference Li, Liu, Xu, Wen and Liu2008c, Reference Li, Liu, Wan, Zhang, Wen and Liu2009b). Since the quite large fields are required for delivering enough energy to electrons to enable their escape of the binding forces into the vacuum, researchers often employ cathodes consisting of long slender structures with a large aspect ratio, of which carbon nanotube cathodes are the most extreme (Liao et al., Reference Liao, Zhang, Huang, Qi, Gao, Xia and Zhang2007). In spite of recent research breakthroughs in this area, the long-lived, low work-function, uniformly emitting, low emittance, high current density electron sources are still one of the remaining challenges in the HPM arena (Booske, Reference Booske2008). However, an idealized electron beam source does not exist yet, necessitating the research and development of different types of cathodes.
To understand more rigorously the relativistic high current diode with pulsed power generators, this class of plasma cathodes, distinguished by the absence of an applied magnetic field, has been studied to determine the plasma phenomena acting within the interelectrode volume. This article introduces a robust relativistic electron beam source with high-density emitters consisting of carbon-fiber-aluminum (CFA) composite. Properties of this beam source were investigated in two pulsed power generators with different pulsed emission modes, namely, single and repetitive pulse operations. Particularly, in single pulse operation, the beam flow behavior was investigated from a detailed analysis of voltage-current characteristics. Since the electron flow in the main pulse was found to be limited by space charges, the separation of the interrelated diode phenomena was facilitated by representing the voltage-current data in terms of the diode perveance. The mechanism governing plasma expansion was developed using the model of plasma supersonic flow.
EXPERIMENTAL SETUP
Pulsed Power Systems
Two HV pulsed power generators were utilized for relativistic electron beam generation experiments. The first, a single pulse generator using inductive energy accumulators, was a 50 Ω machine with a ~450 kV output voltage and ~350 ns pulse duration, as shown in Figure 1. The experimental system consists of an initial energy supplier, a HV pulse modulator, and a vacuum diode. The initial energy supplier includes five 3 µF capacitors and a three-electrode triggering switch, providing a HV pulse for the primary circuit of a coaxial transformer with a coupling coefficient of 0.89. Meanwhile, a high current of the secondary side goes through an electrically exploded opening switch (EEOS), consisting of two arrays of copper wires with 0.06 mm diameter. Once the EEOS current reaches its maximum value, electrical wire explosion occurs and the secondary circuit is cut-off, which leads to the breakdown of a spark-gap switch connected with the vacuum diode. Finally, a sharpened HV pulse forms across the vacuum diode.

Fig. 1. (Color online) Experimental setup for the generation of relativistic electron beams in single shot regime. The schematic shows the vacuum vessel with the HV pulse generator, cathode mount, cathode, anode, and vacuum pump. The diode gap can be changed by moving the shaft upon which the cathode is mounted.
The vacuum vessel for this pulsed power generator operated at (4–8) × 10−5 torr by a turbo pump with a pump rate of ~300 l/s. A self integrating Rogowski coil was used to measure the beam current, and the diode voltage was measured by a resistive divider. The side and front images of the light emission from the cathode and anode were registered with a fast framing camera. One image per pulse at a given gate delay could be registered. The electron-beam current-density distribution was obtained by fast X-ray imaging of the electron beam. In this case, instead of the anode, a 125-μm-thick Ta foil with a 2 mm thick plastic EJ-200 scintillator (polyvinyltoluene), which was attached to the back of the Ta foil, was used as an anode. The mean path of the electrons in the Ta foil is less than the Ta foil thickness. Therefore, electrons do not interact with the scintillator. However, the mean path of the X-rays produced by the electrons inside the Ta foil is larger than the foil thickness. The interaction of these X-rays with the scintillator produces a time-and-space-resolved image that is obtained by the fast framing camera.
The second HV pulsed power generator, a Tesla transfer pulsed power system, had a 100 Hz repetition rate, with a ~350 kV output voltage, a ~150 Ω impedance, and a <10 ns pulse width. This generator mainly included a charging device, a pulse shaping line with a Tesla transformer, a spark gap switch, a transmission line, a vacuum diode, and some control systems, as shown in Figure 2. A wideband current gauge, made of a Faraday cup, provided the current measurements with the diode voltage obtained from a capacitive divider.

Fig. 2. Schematic of a high-current electron beam generator using a Tesla transformer in repetitively pulsed operation.
The diode region for the test experiments is also presented in Figure 1. The two HV pulse generators had the same diode geometry with the exception of pulse emission modes. Each experiment utilized the same CFA cathode of 60 mm in diameter, and the construction of this cathode is described in the next section. A stainless steel grid of 200 mm in diameter and transparency of 95% was used as an anode. The anode-cathode (A-K) gap was varied in the range of (1–7) cm by moving the shaft upon which the cathode was mounted.
Electron Beam Source
The carbon fiber cathode is the most appropriate choice for generating high-current electron beam, mainly due to its nanosecond timescale turn-on (Vekselman et al., Reference Vekselman, Gleizer, Yarmolich, Felsteiner, Krasik, Liu and Bernshtam2008), relatively good vacuum compatibility (Umstattd et al., Reference Umstattd, Schlise and Wang2005), and long lifetime (Shiffler et al., Reference Shiffler, Luginsland, Ruebush, Lacour, Golby, Cartwright, Haworth and Spencer2004). These cathodes consist of an array of carbon fibers pyrolytically bonded to a carbon substrate or attached to a metal substrate using electrically conductive epoxy, or carbon fibers are bundled into bunches each containing ~103 microfibers and positioned on the cathode substrate (Shiffler et al., Reference Shiffler, Ruebush, Lacour, Golby, Umstattd, Clark, Luginsland, Zagar and Sena2001, Reference Shiffler, Ruebush, Haworth, Umstattd, Lacour, Golby, Zagar and Knowles2002). Generally, three basic principles should be followed in the cathode manufacture (Shiffler et al., Reference Shiffler, Haworth, Cartwright, Umstattd, Ruebush, Heidger, Lacour, Golby, Sullivan, Duselis and Luginsland2008a). Low out-gassing materials are used as cathode emission materials, best avoiding volatiles such as epoxy. Second, the fabrication process is controllable and repeatable, and the fabricated cathodes can be further machined, which is required for different microwave sources (Liu et al., Reference Liu, Li, Zhang, Zhang, Wen and Liu2008a). Third, robust or long-lived cathodes are acceptable, and can survive even under repetitively pulsed operation. Since the electron beam starts with the cathode, the cathode fabrication technique is a crucial issue in developing high-current electron beam sources.
To complete the construction of CFA cathode (see Fig. 3a), a squeeze casting technique is introduced. High-quality carbon fiber yarns (T300-3K, 5 µm) were selected as initial material. The epoxy layer inherent on the fiber surface was eliminated at 700°C under the protection of 10 atm., 99.95% nitrogen gas. Then the cleared fibers were bundled into a bunch. Next, the fiber bunch was mounted into a stainless steel tube that was positioned in a crucible. Subsequently, 750°C aluminum melt was poured on the carbon fiber bunch, and was fast pressed up to ~2 × 10⁷ Pa by a squeeze machine. After cooling, the crucible was removed and the roughcasts were machined into the preformed cylinders, which can be cut by a given thickness. Then the slice surface was immersed in 10–15% sodium hydroxide solution for several hours to remove aluminum surrounding carbon fibers. Interestingly, CFA composite material has a higher hardness than conventional aluminum, thus enabling the further machining. Notably, the cathode surface, although the poured aluminum was removed, remains fairly hard, so that carbon fibers can vertically protrude across the cathode surface in spite of the current density level.
To understand the surface morphology of the CFA cathode, the scanning electron microscope (SEM) image and the energy distribution spectrum (EDS) of the emission surface are presented in Figures 3b and 3c, respectively. From the front view, it was found that carbon fiber emitters distribute uniformly across the cathode surface without other attendants. Since explosive emission is initiated by the significant enhancement of microscopic electric field, these fiber emitters can facilitate the cathode turn-on. The axial length of carbon fibers standing the substrate was in the range of (3–5) mm, and there existed (2–3) × 104 fibers per square millimeters, a high distribution density. After surface treatment, carbon became the dominant component on the emission surface, with aluminum or other intermixtures being minor (Fig. 3c), indicating that carbon fiber emitters almost fully determine the emission property of CFA cathode. Thus, the robust nature of carbon fiber implies a long lifetime of the CFA cathodes. However, residual particles or scrapes between the fiber intervals can still be observed from the side view (Fig. 3d), and they may be aluminum or aluminum oxide. Since explosive electron emission is initiated from surface microprotrusions due to significant field enhancement, these particles or scrapes have little effects on the emission property. They mainly serve to link carbon fibers, enabling an excellent electric connection with the substrate, and potentially increase the hardness of emission surface.

Fig. 3. (Color online) Photograph (a) and SEM image (b) of the emission surface of the CFA cathode with the corresponding energy distribution spectrum (c), and side-view image (d).
EXPERIMENTAL RESULTS
Diode Characteristics in Single Pulse Operation
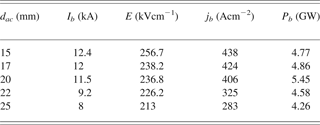
Typical waveforms of diode voltage φac and beam current I b at the diode gap d ac 20 mm are shown in Figure 4 for the CFA cathode of 60 mm diameter. Table 1 presents the beam current I b, the average electric field E = φac/d ac, the beam current density j b = I b/S where S = 28.3 cm2 is the cathode emission area, and the beam power P b = φac/I b for the different gaps d ac in a diode with the CFA cathode. Here these parameters were determined at a time delay τd ~ 100 ns with respect to the accelerating pulse (or at the maximum of the beam current). The explosive emission diode with the CFA cathode operated at j b = (280–440) A/cm2 in the range of d ac = (15–25) mm. Most notably, at d ac = 20 mm, a maximum beam power of 5.45 GW was obtained.

Fig. 4. Waveforms of the accelerating voltage φac and the diode current I b. The anode-cathode gap is d ac = 20 mm. The CFA cathode is tested.
Table 1. Beam current Ib, average electric field E, beam current density jb, and beam power Pb for different values of dac
The diode perveance is sensitive to the geometrical factors, namely, the emission area S e and the diode gap d ac, and remains constant during the accelerating pulse if there are no changes in S e and d ac. However, cathode or anode plasma bursts into the vacuum region, shortens the accelerating gap, which is accompanied by the radial expansion of plasma across the cathode surface. Thus, once plasma forms within a diode, S e and d ac are no longer constant parameters. The contribution due to edge emission can be accounted for by using the Langmuir-Compton equation, and the two-dimensional (2D) effect has been suggested (Roy et al., Reference Roy, Menon, Mitra, Kumar, Kumar, Sharma, Mittal, Nagesh and Chakravarthy2008; Parker et al., Reference Parker, Anderson and Duncan1974). Thus, the diode perveance based on the Child-Langmuir law can be described as

where α = ln(d ac/νpt) – 0.4[ln(d ac/νpt)]2 + 0.00917[ln(d ac/νpt)]3 + … Here νp is the plasma expansion velocity, d = d ac−νpt is the effective gap, and R = R 0 + νpt is the effective emission radius, with R 0 being the initial emission radius. The second term of P(t) corresponds to the edge emission (Parker et al., Reference Parker, Anderson and Duncan1974), and (1 + d/4R 0) is the coefficient for 2D effect (Lau, Reference Lau2001). Plasma expansion directly leads to an increase in the perveance with time at a given gap. However, its effects can be neglected for large gaps, since the expansion velocity is several cm/μs for the accelerating pulse of several hundreds of nanoseconds. At large gaps, the 2D effect becomes important.
In Figure 5, the experimental impedance and perveance of the diode with the CFA cathode are presented at d ac = 20 mm. We made a comparison between the experimental perveance and the predication of P(t) (dashed line). The diode impedance dropped from an infinite value to less than 80 Ω initially in the accelerating pulse. At τd < 50 ns, the perveance fast increased mainly due to an increase in the emission area as the cathode is turning on. At 100 ns < τd < 250 ns the experimental impedance was in a stage of slow changes. One can see a good agreement between the experimental and calculated purveyances assuming the expansion velocity and the initial emission radius to be 1.2 cm/μs and 3 cm, respectively. However, later in the accelerating pulse, a large difference between the experimental and calculated perveance appeared.

Fig. 5. (Color online) Impedance and perveance of the diode with the CFA cathode at d ac = 20 mm. The dashed line is the perveance calculated from the “3/2” law with corrections for the 2D and edge effects.
The effective gap as a function of time, based on the Child-Langmuir law, can be calculated from the voltage and current data. The diode closure rate is then found from the slope of the gap curve. Figure 6 presents the temporal behavior of A-K gap for the CFA cathode at d ac = 20 mm. At τd < 50 ns, a fast decrease in the gap was observed, which is accompanied by a slowly changed process. Most notably, the diode gap remained around 14 mm at τd = (100–200) ns. However, the decrease in the gap continued at τd > 200 ns. As a whole, the temporal dependence of the diode gap is consistent with the changes in the diode impedance and perveance as the pulse proceeded. To give a clear physical image, the corresponding closure rate is also plotted in Figure 6, and its data are fitted by Lorentz functions. Clearly, the evolution process of the closure rate can be divided into three stages as follows. First, at τd <50 ns it had a large initial value. Second, at 100 ns < τd < 200 ns it dropped to less than 1 cm/μs. Third, at τd > 200 ns a new increase in the closure rate appeared. The huge initial drop in the gap is closely related to the cathode turn-on. The application of external electric field causes emission sites to explode within several nanoseconds to form cathode flares or plasma spots. Once the plasma spots form across the cathode surface, these spots have a certain thickness, potentially shortening the accelerating gap. In the second stage, the diode exhibited stable operation, which may be attributed to the dynamic equilibrium between the plasma saturation electron current j pl and the space-charged limited current j sc (Vekselman et al., Reference Vekselman, Gleizer, Yarmolich, Felsteiner, Krasik, Liu and Bernshtam2008; Litvinov, Reference Litvinov1985). If the equality between them is satisfied, cathode plasma expansion will stop, and shows a quasi-stationary behavior. Once the equilibrium between j pl and j sc is broken as the current density decreases, it allows a new plasma expansion. In the third stage, the sudden increase in the closure rate is also likely due to an ion flow toward the cathode.

Fig. 6. (Color online) Temporal behavior of diode gap and its closure rate for the CFA cathode at d ac = 20 mm. The data for the closure rate are fitted by Lorentz functions.
Plasma Light Emission and X-Ray Imaging in Single Pulse Operation
The electron emission cross-sectional uniformity is an important characteristic of any electron beam source. In Figure 7, the front images of the light emission from the CFA cathode, observed at several τd, are presented. Framing images from the CFA cathode show the appearance of bright spots from the individual emitters. One can see that the distribution of bright spots was random on the cathode surface. Further, the amount and brightness of light spots on the surface increased as the pulse proceeded. Most notably, the larger and brighter light spots always appeared along the periphery of the cathode surface, mainly due to the edge effect.

Fig. 7. Front images of the light emission from the CFA cathode at different time delays τd with respect to the beginning of the accelerating pulse. Frame duration of 20 ns, j b = 400 A/cm2, and d ac = 20 mm. (a) τd = 50 ns, (b) τd = 150 ns, (c) τd = 250 ns.
It was observed that light emission was more or less uniform over the whole cathode surface; rather it appeared from many individual bright spots. In fact, later in the accelerating pulse, we can observe light emission from a larger cathode surface area. In this case, the strongest electron emission was also extracted from individual bright spots. These bright spots were separated from each other at distances of several millimeters, and the dimension of each of the bright spots was less than 3 mm. Also, it was observed that the intensity of the light emission from these bright spots was closely related to the amplitude of the cathode current. That is, with the decrease of the emitted current, a decrease in the light emission occurred. As a whole, the uniformity of electron emission tends to be tied with the amount and brightness of the emitting spots on the cathode surface.
The formation of the individual plasma jets rather than a plasma sheath on the cathode surface is mainly due to the screening effect. That is, ignition of an emission center retards the formation of new emission centers in its vicinity. The space charge from an emission center can screen the electric field in its immediate neighborhood. Small reductions in the electric field strength produce large delays in the electron emission of a microprotrusion. Thus, an emission center can retard the formation of its nearby emission centers. Such a “screening effect” should be independent of the cathode materials.
Side-view observations of the light emission from the diode gap with different time delays τd are shown in Figure 8. Side-view fast framing images show that a structure of individual light emission sources with dimensions of 1–2 mm appeared at the cathode surface. This structure of the light emission indicates that individual plasma jets are ejected. One can see that during the main pulse, the light emission occurred only from the narrow cathode region with a width of <3 mm, almost with the absence of the expansion of the light-emitting bright spots. Side-view framing photographs also show a structure of the emitting area in the form of separate bright spots. There also existed light emission from the anode at τd > 200 ns, while the cathode plasma significantly expanded into the vacuum gap. The observed data can indicate the existence of quasi-stationary boundaries in the cathode plasma during the main pulse. At τd > 200 ns, the increase in the diode perveance or the drop in the diode gap can be attributed to the formation of ion flow from the anode plasma (see Fig. 8c). Meanwhile, there existed a significant expansion of cathode plasma toward the anode, mainly due to the break of the equilibrium between j pl and j sc. Here the evolution behavior of the cathode plasma agrees well with the observed results in Figure 6.

Fig. 8. (Color online) Side images of the light emission from the CFA cathode with different time delays τd with respect to the beginning of the accelerating pulse (cathode on the left and anode on the right): (a) τd = 50 ns, (b) τd = 150 ns, (c) τd = 250 ns. Conditions: j b = 400 A/cm2, and d ac = 20 mm.
Figure 9 shows a typical set of framing photographs with time-and-space resolution where we used the CFA cathode at d ac = 20 mm, average electron current density of ~400 A/cm2 and electron energy of 470 keV. One can see that the patterns of the X-ray image had a form of islands or circles. Thus, it can be supposed that these rays are images of the electron beamlets emitted from the individual plasma sources on the cathode surface. The brightness and uniformity of X-ray images depended on the amplitude of the accelerating voltage. Namely, the X-ray image had the highest brightness and uniformity around the maximum voltage, shown in Figure 9b. As the pulse proceeded, one can observe a decrease in the brightness and uniformity of the X-ray image. Taking into account that each X-ray image is produced by electrons having almost the same energy, we hold that the observed uniformity of the X-ray images corresponds to the uniformity of the electron current density. Most notably, the electron current density is satisfactory in spite of the individual plasma sources on the cathode surface. There are two factors that can be responsible for the above contradiction. The first may be related to the electron-beam divergence. The second is related to a fast radial expansion of the cathode surface plasma that serves as an electron source.

Fig. 9. Typical X-ray images of the anode foil obtained with the phosphor screen for different time delays with respect to the beginning of the accelerating pulse and at d ac = 20 mm. (a) τd = 50 ns, (b) τd = 150 ns, (c) τd = 250 ns.
Repetitively Pulsed Emission
The cathode lifetime is of great importance, even for tubes requiring repetition rate operation at low duty cycles. The shot-to-shot reproducibility of the CFA cathode was performed with the repetitive pulsed generator at a 100 Hz repetition rate. The shot-to-shot reproducibility at different pressures is presented in Figure 10. Figure 10a shows a series of 100 voltage pulses at the pressure of 3 × 10⁻⁴ torr. It was found that the voltage waveforms had a significant fluctuation. At the end of 100 pulses, the cathode began to show a marked decrease in performance. Figure 10b presents an overlay of 100 voltage pulses at the pressure of 1 × 10⁻⁴ torr. As the pressure decreased, the cathode exhibited a good shot-to-shot reproducibility throughout the testing. Figure 10c gives a series of current traces at the pressure of 1 × 10⁻⁴ torr. Clearly, the current showed very little overall variation. Here, the voltage was around 300 kV with pulse duration of 5 ns, and the average current was about 2 kA. In this case, the base pressure, although it decreased by a factor of three, was at poor vacuum level. This demonstrates that in poor vacuum, the CFA cathode can still survive under repetitively pulsed operation.

Fig. 10. Shot-to-shot reproducibility at different pressures. (a) Is an overlay of voltage pulses at the pressure of 3 × 10⁻⁴ torr; (b) and (c) are, respectively, voltage and current traces for the pressure of 1 × 10⁻⁴ torr. Here, the pulsed generator operated at a 100 Hz repetition rate.
DISCUSSIONS
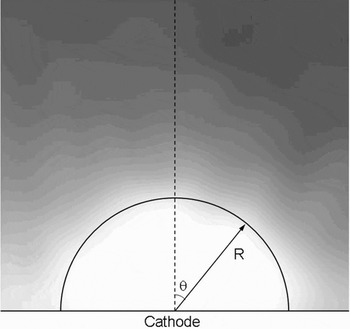
It has been found that the light emission is characterized by individual plasma jets from the CFA cathode. Here a model, based on supersonic isothermal plasma, is considered (Landau & Lifshitz, Reference Landau and Lifshitz1987). In Figure 11, a magnified image of an individual plasma jet is shown with the bright zone having a global form. The bright zone can be identified with the area of high plasma density. Let us consider a polar coordinate system with the center being the center of the plasma jet. The plasma flow can be characterized by two velocity components νR and νθ, measured in plasma sound velocity ![]() units. For the stationary case, the Euler (Eqs. (2) and (3)) and continuity (Eq. (4)) equations for νR and νθ can be described as follows:
units. For the stationary case, the Euler (Eqs. (2) and (3)) and continuity (Eq. (4)) equations for νR and νθ can be described as follows:

Fig. 11. Plasma jet ejected from the CFA cathode.
Here the relative plasma density N = ne/n 0, where n 0 is the plasma density at the explosive emission center.
To simplify the solution, we consider a uniform, constant plasma density N = 1 and a plasma flow that enters into the region where its density becomes N < 1. This solution follows from Eqs. (2)–(4), in the case when the values νR, νθ, and N depend only on the variable R. In this case Eqs. (2) and (3) read as follows:
Thus the Bernoulli equation can be obtained
Here ν0 is the velocity of the uniform flow in the area where N = 1. Thus, the decrease in the plasma density N < 1 leads to the increase in the plasma velocity ![]() . In the case of dependence, only on R, Eq. (4) becomes the form as follows:
. In the case of dependence, only on R, Eq. (4) becomes the form as follows:
Using Eq. (5) one can obtain
Combining with Eq. (6), the solutions of νR and νθ can be obtained, and then the relative plasma density can also been given. Here it is assumed that by explosion emission, the initial plasma has a uniform expansion, namely, νR = νθ = C s, which gives C s = 2 cm/μs for proton contained plasma.
The velocity distribution of a plasma jet at different emission radii is presented in Figure 12. It was found that the plasma velocity grows with the increase in the distance from the emission center. Moreover, for each case, rapidly increasing velocity occurs close to the emission center, which is followed by a slowly changed process at a distance of 3–4 mm from the emission center. Most notably, the plasma jet with different emission radii is a supersonic flow. Figure 13 shows the distribution of relative plasma density. Clearly, the plasma density fast drops along the expansion direction, forming a boundary between the emission zone and the rarefaction plasma region. Therefore, the emission zone has a large plasma density with intense light emission (see Fig. 11). According to the Mach number value, the velocity of the external plasma boundary is ~5 cm/μs for a plasma jet with 1 mm radius, while the plasma expansion velocity observed in the experiment is <2 cm/μs. The difference between the calculated and experimentally obtained plasma velocities can be explained by the application of the external accelerating field. The accelerating electric field changes the dynamic of the plasma boundary expansion due to the acceleration of electrons and slowing down of plasma ions.

Fig. 12. (Color online) Velocity distribution of plasma expansion at different emission radii of plasma spots.

Fig. 13. (Color online) Distribution of relative plasma density at different emission radii of plasma spots.
CONCLUSIONS
The generation of relativistic electron beams is based on electron emission from the plasma that is produced on the cathode surface as a result of the significant enhancement of the microscopic electric field. Thus, the above presented emission mechanism induces unavoidably the intense desorption of cathode materials during their operation. This is accompanied by the deterioration of emission properties, namely, the reduction in the amplitude of emission current and the appearance of a time delay in the electron emission. These drawbacks stimulate a continued interest in groping for robust cathode materials. The CFA cathode is constructed by squeeze casting technique. By surface treatment, the carbon became the dominant component, with aluminum or other intermixtures being minor.
The experiments on single pulse emission of the CFA cathode were conducted in a ~450 kV, ~350 ns, ~50 Ω HV pulse generator. The diode with the CFA cathode operated at j b = (280–440) A/cm2. Further, at d ac = 20 mm, a maximum beam power of over 5.4 GW was obtained. Taking the 2D and edge effects into account, the calculated perveance was close to the experimental result at νp = 1.2 cm/μs. The evolution of the diode closure rate can be divided into three stages. A quasi-stationary behavior was observed during the main pulse, possibly as a result of the dynamic equilibrium between the plasma saturation electron current and the space-charge limited current. Discrete plasma spots appeared on the cathode surface, which is closely related to the screening effect. Thus, it is unavoidable to generate beamlets, since these individual little plasma sources act as electron beam emitters. Surprisingly, it was found by taking X-ray images that the uniformity of the electron beam is satisfactory. There are two factors involved in this result, i.e., the beam divergence and the increase in the emission area as the pulse proceeded. The plasma jets ejected from the emission surface are analyzed using the model of plasma supersonic flow.
The CFA cathode was also tested in a repetitive pulse generator (350 kV, <10 ns, 150 Ω, and 100 Hz). Under repetitively pulsed operation, the CFA cathode exhibited a good shot-to-shot reproducibility at the pressure of 1 × 10⁻⁴ torr. Generally, two factors, the base pressure and the out-gassing rate, are involved in the shot-to-shot reproducibility. A high base pressure is detrimental to repetitive operation. Interestingly, the CFA cathode still exhibited stable operation in poor vacuum, potentially implying a low out-gassing rate.
ACKNOWLEDGMENT
This work was supported by the National High Technology Research and Development Program of China.