


I. INTRODUCTION
Severe plastic deformation (SPD) is now a well-established methodology for the processing of bulk ultrafine grained materials. The principle of SPD includes increasing dislocation density by heavily deforming materials, formation of dense dislocation walls, and transforming dislocation walls into high-angle grain boundaries (Valiev et al., Reference Valiev, Islamgaliev and Alexandrov2000). Among various SPD techniques, equal channel angular pressing (ECAP) is the most popular technique to generate ultrafine grain sizes bulk materials (Segal, Reference Segal1995; Valiev, Reference Valiev1997; Alexandrov et al., Reference Alexandrov, Islamgaliev, Valiev, Zhu and LoweI1998; Stolyarov et al., Reference Stolyarov, Zhu, Lowe and Valiev1999). During the ECAP process, a simple shear deformation is imposed on the material when passed through two intersecting channels of equal cross-sectional area (Segal, Reference Segal1995). Since the size of work piece remains unchanged after the pressing, this process can be, in principle, repeated for an indefinite number of times to tailor microstructure and strength (Segal, Reference Segal1995; Valiev, Reference Valiev1997; Alexandrov et al., Reference Alexandrov, Islamgaliev, Valiev, Zhu and LoweI1998; Stolyarov et al., Reference Stolyarov, Zhu, Lowe and Valiev1999).
In the multiple pass deformation technique there is a possibility to introduce a variety of strain path change, each of which is designated as a specific route of ECAP. Therefore, the processing route is an important parameter that would strongly influence the microstructural evolution. Generally, three routes in the ECAP pressing are usual: route A, without any rotation of the sample around its axis upon repeated deformation; route B c, with sequential rotation of the sample by 90° around its axis; and route C, with the rotation of sample by 180° around its axis during repeated deformation (Valiev et al., Reference Valiev, Islamgaliev and Alexandrov2000). We have previously reported the influence of processing route on texture evolution in commercially pure aluminum (Suwas et al., Reference Suwas, Tóth, Fundenberger and Eberhardt2005, Reference Suwas, Arruffat Massion, Tóth, Fundenberger and Beausir2009) and also the influence of processing routes on recrystallization in copper (Suwas et al., Reference Suwas, Eberhardt, Tóth, Fundenberger and Grosdidier2004; Suwas and Kim, Reference Suwas and Kim2007). However, these studies were qualitative and did not reveal all aspects of microstructural evolution. The aim of the present study is to investigate the effect of processing route on the microstructural evolution in more quantitative manner and comment on the efficiency of the processing route, with regard to further stability of the microstructure, which is a major concern now. The study has been focused on commercially pure copper, as the previous investigations (Suwas et al., Reference Suwas, Arruffat Massion, Tóth, Fundenburger, Eberhardt and Skrotzki2006; Skrotzki et al., Reference Skrotzki, Scheerbaum, Oertel, Arruffat-Massion, Suwas and Tóth2007) have shown the formation of stable deformation microstructures and the characteristic deformation patterns indicated though ideal texture formation for this material.
II. EXPERIMENTAL
A. Processing
An extruded bar of commercial purity copper was subjected to annealing at 350 °C for 1 h to obtain strain-free microstructure with equiaxed grain. Specimens with dimensions of 100 mm × 10 mm × 10 mm were machined from the annealed bar. The ECAP experiments were carried out at a cross head speed of 1 mm s−1 at room temperature using a Zwick 200 kN screw driven machine. A specially designed die (Mathieu et al., Reference Mathieu, Suwas, Eberhardt, Tóth and Moll2006) with square cross section of the extrusion channels (90°) was used. The specimens were subjected to ECAP up to four passes following routes A, B c, and C.
B. Differential scanning calorimetry (DSC)
To estimate the amount of stored energy of cold work and the recrystallization temperature, DSC was carried out for each of the deformed samples. As it is well established that strain heterogeneities develop in ECAP processed samples because of different amount of friction along the die walls (Suwas et al., Reference Suwas, Arruffat Massion, Tóth, Fundenburger, Eberhardt and Skrotzki2006; Skrotzki et al., Reference Skrotzki, Scheerbaum, Oertel, Arruffat-Massion, Suwas and Tóth2007), only the central part of the billets has been investigated. Therefore, the DSC analysis was carried out on cubical samples (2 mm × 2 mm × 2 mm) cut from the central portion of each of the ECAP processed rods. These samples were then chemically polished using a solution of 30 ml of nitric acid, 10 ml of hydrochloric acid, 10 ml of phosphoric acid, and 50 ml of glacial acetic acid to remove any surface deformation that could have been generated by the cutting procedure. The cubes were further cleaned in ethanol and dried before they were used for DSC. They were then placed in one of the two furnaces of a SETARAM DSC 131 Differential Scanning Calorimeter and analyzed at a constant heating rate of 20 K min−1. A reference sample of well-annealed silver was placed in the other furnace. The power difference between the two furnaces, required to maintain the heating rate constant was recorded as a function of temperature. Recrystallization phenomenon is exothermic in nature and consequently results in peak in the DSC heat flow curve. The specimens were then cooled and reheated under identical conditions to establish a base line. The stored energy per unit mass is then the ratio of the area under the peak with respect to the sample weight.
Activation energy of recrystallization was calculated from the DSC measurements at different heating rates 5, 10, 15, and 20 K min−1. The dependence of the peak temperature on the heating rate was used to calculate the apparent activation energy for recrystallization based on the Kissinger method (Kissinger, Reference Kissinger1957). Kissinger analysis is used to determine the apparent activation energy (Q) for recrystallization.

where V is the heat rate, T p is the peak temperature, A is a constant, Q is the apparent activation energy, and R is the gas constant.
C. X-ray diffraction
Samples with an area of 8 mm × 8 mm were cut from the central portion of the deformed specimens and electro-polished for the X-ray diffraction experiments. The X-ray diffraction patterns were recorded from the polished surface by a PANalytical X'PertPro diffractometer using Cu K radiation. All the diffraction profiles were obtained by varying 2θ from 40° to 120° in a continuous scan mode. The data were recorded in a 2θ interval of 0.017°. The diffraction profiles were corrected for the instrumental broadening using a standard silicon sample, which had large crystallites and was free from the defects.
III. RESULTS
A. DSC measurement
Figure 1 shows the DSC thermograms of the deformed samples processed using routes A, B c, and C. Peaks in the plot indicate the exothermic heat flow because of recrystallization. It is clear that the onset of recrystallization starts earlier for the route B sample. It can also be seen that for routes A and C the peaks are sharper compared with the samples deformed using route B c. The area of the peak corresponds to the stored energy in the material and the values of the stored energy along with the recrystallization peak temperatures are reported in Table I for the different samples. The activation energy for recrystallization has been determined using the Kissinger analysis. Figure 2 shows the plot of ln(V/T p2) vs. 1/T p for Kissinger analysis of the samples deformed for four passes using different routes. The slope of the curve corresponds to the activation energy of recrystallization (Q). The values of Q for different processing routes are reported in Table I. It can be seen that the Q value is minimum for the sample deformed using route B c. The values of the stored energy and Q are of the same order of magnitude of conventionally deformed samples (Cao et al., Reference Cao, Gu, Pereloma and Davies2008).
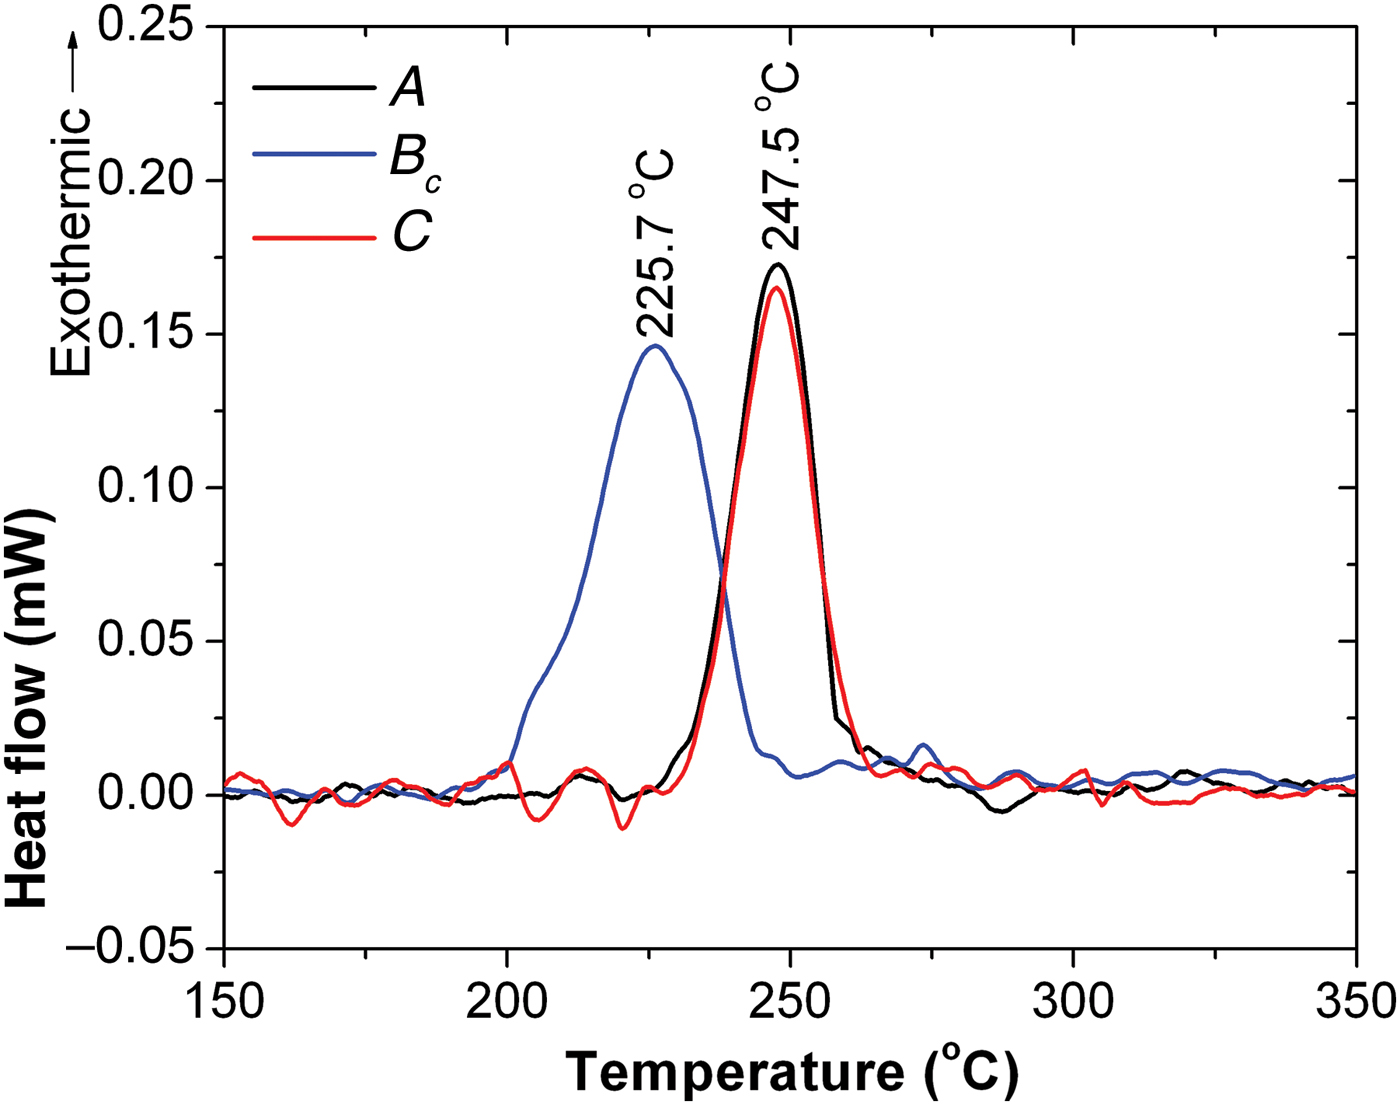
Figure 1. (Color online) DSC thermograms for Cu samples deformed up to four ECAP passes using different routes.

Figure 2. (Color online) Plot for Kissinger analysis to determine activation energy for Cu sample after four ECAP passes using different routes.
TABLE I. Results obtained from DSC study of four pass deformed samples.

B. XRD measurement
Figure 3 shows that the XRD traces obtained on the deformed samples using the three different routes. It is interesting to note that the relative intensities of the diffraction peaks are different for the three different processing routes. This indicates that a crystallographic texture has been produced during the ECAP deformation and that the nature of this texture is different depending on the exact processing route. A typical whole powder pattern fitting of the XRD profile of the sample deformed using route C is shown in Figure 4. Integral breadths of the peaks obtained from the fitting were used to draw the classical Williamson–Hall (WH) plot (Williamson and Hall, Reference Williamson and Hall1952). Figure 5 shows the classical WH plots for the three different samples. In the plots, ΔK (=2β cosθ/λ, β being the integral breadth) is plotted against K (=2sinθ/λ). It can be seen that the broadening is highly anisotropic, i.e. not a monotonic function of K for all the cases. The anisotropic broadening indicates the presence of a large amount of dislocations in the samples (Ungar and Borbely, Reference Ungar and Borbely1996; Gubicza et al., Reference Gubicza, Kassem, Ribárik and Ungár2004, Reference Gubicza, Balogh, Hellmig, Estrin and Ungar2005; Ungar, Reference Ungar2004).

Figure 3. X-ray diffraction profiles for Cu sample after four ECAP passes using different routes.

Figure 4. (Color online) Whole pattern fit of the XRD profile for Cu sample after four ECAP passes using route C.

Figure 5. (Color online) Classical Williamson–Hall plot for Cu samples after four ECAP passes using different routes.
The dislocation-type factor q, dislocation density ρ, arrangement of dislocation M, as well as the median and variance of the size of coherently diffracting domains distribution of the ECAPed Cu were determined using the multiple whole powder (MWP) pattern fitting computer program (Ribárik et al., Reference Ribárik, Ungár and Gubicza2001). The details of theoretical background of this method can be found in different literatures (Ungar and Tichy, Reference Ungar and Tichy1999; Ungar et al., Reference Ungar, Dragomir, Revesz and Borbely1999; Ribárik et al., Reference Ribárik, Ungár and Gubicza2001). In this procedure, normalized Fourier transform of all the profiles after de-convolution were fitted simultaneously with those calculated according to the theoretical size and strain profile functions for a restrictedly random dislocation distribution (Wilkens, Reference Wilkens, Simmons, de Wit and Bullougs1970a) and a log-normal distribution of spherical crystallites (Ribárik et al., Reference Ribárik, Ungár and Gubicza2001). In this program, the unit-cell parameter (a), Burgers vector (b) for the most common dislocation slip system and the average contrast factor of dislocation (![]() ) as calculated from the ANIZC program (Borbely et al., Reference Borbely, Dragomir, Ribarik and Ungar2003) are the non-refinable input parameters. The results of the MWP fitting procedure are shown in Table II. A typical fit of the intensity profile for 4C pass sample is shown in Figure 6. A good fit could be observed in the present case. From the table it is clear that the size of coherently diffracting domains is slightly smaller in the case of the sample deformed through route A compared with routes B c and C. Table II further lists the parameters determining the type of dislocation (q) and dislocation arrangement parameter (M). The dislocation density of the different deformed samples is ~1015 m2. This corroborates the results obtained by other researchers (Gubicza et al., Reference Gubicza, Balogh, Hellmig, Estrin and Ungar2005; Schafler et al., Reference Schafler, Steiner, Korznikova, Kerber and Zehetbauer2005). In our case, the value of dislocation density is maximum in the case of sample deformed through route B c. The stored energy (E) of the deformed materials can also be calculated from the ρ values using the relation:
) as calculated from the ANIZC program (Borbely et al., Reference Borbely, Dragomir, Ribarik and Ungar2003) are the non-refinable input parameters. The results of the MWP fitting procedure are shown in Table II. A typical fit of the intensity profile for 4C pass sample is shown in Figure 6. A good fit could be observed in the present case. From the table it is clear that the size of coherently diffracting domains is slightly smaller in the case of the sample deformed through route A compared with routes B c and C. Table II further lists the parameters determining the type of dislocation (q) and dislocation arrangement parameter (M). The dislocation density of the different deformed samples is ~1015 m2. This corroborates the results obtained by other researchers (Gubicza et al., Reference Gubicza, Balogh, Hellmig, Estrin and Ungar2005; Schafler et al., Reference Schafler, Steiner, Korznikova, Kerber and Zehetbauer2005). In our case, the value of dislocation density is maximum in the case of sample deformed through route B c. The stored energy (E) of the deformed materials can also be calculated from the ρ values using the relation:
where G is the shear modulus. The calculated values of the stored energy are listed in Table II. Consistently with the results obtained by DSC, the XRD results indicate that the stored energy is maximum for the sample processed using the route B c.

Figure 6. MWP fit of XRD intensity profile for Cu sample after four ECAP passes using route C.
TABLE II. Results of MWP fit of the XRD profiles of samples deformed up to four passes using different routes.

Values of the dislocation-type factor parameter q obtained from the MWP fit analysis are shown in Table II. Theoretical values of q for pure edge and pure screw-type dislocations for copper are 1.60 and 2.34, respectively, and for nearly equally populated screw and edge dislocation, the value comes out to be approximately 1.97 (Gubicza et al., Reference Gubicza, Ribárik, Goren-Muginstein, Rosen and Ungar2001). The values experimentally obtained here for q indicate that the processing route changes the character of the dislocation. The dislocation structure is a combination of equally populated edge and screw type for route A, while the amount of edge-type dislocations increases for route B c. Ultimately, the sample processed using route C is essentially characterized by dislocations of edge character. The dislocation arrangement parameter (M) is less than 1 for all the routes and is independent of the processing route. The values of arrangement parameters indicate that dislocations are highly correlated (Wilkens, Reference Wilkens1970b). The crystallite size distribution functions for all different samples are shown in Figure 7. It is observed from the values of variance and median of size distribution that the distribution functions are narrower and sharper for routes A and B c deformed samples compared with the sample deformed using route C.

Figure 7. (Color online) Crystallite size distribution function for Cu samples after four ECAP passes using different routes.
VI. DISCUSSION
Nanostructured bulk materials can be produced by a number of processing methods. It has been found experimentally that the nanostructured metals produced by these techniques show a very high strength – typically several times higher than observed in coarse-grained materials – but a limited ductility of only a few percent of uniform elongation. For practical applications of nanostructured metals, it is therefore required to optimize the balance between strength and ductility. In a recent paper Wang and Ma (Reference Wang and Ma2004), have explored different ideas to remove or delay the plastic instabilities that hamper the useful ductility because of the presence of the nanostructure. The suggested stabilizing mechanisms were invoked by selecting appropriate tensile deformation conditions (such as deformation temperature and strain rate) or by tailoring the grain size structure to obtain bimodal or multi-modal grain size distributions (Wang et al., Reference Wang, Chen, Zhou and Ma2002; Wang and Ma, Reference Wang and Ma2004). For the latter case, even if the number fraction of larger grains in the nanostructure is low, their volume fraction can be sufficiently high to contribute to dislocation-based plasticity in the material (Ma, Reference Ma2003). In addition, the thermal stability is also an important issue for the potential applications of nanostructured materials. Thus, when discussing the efficiency of the ECAP routes, it is important to consider that the effectiveness of a given route is directly related to the necessity of producing the most favorable microstructure associated with the required properties in the end products.
Despite the fact that all the ECAP routes lead to submicron-grained microstructures because of the high imparted strain, one of the interest of this technique is that the different routes of processing should help tailor the fine scale features of the microstructure – such as dislocation density, nature of grain boundary, and size distribution to achieve optimum mechanical properties. Some attempts have already been made in the literature to characterize the efficiency of the processing routes (Ferrasse et al., Reference Ferrasse, Hartwig, Goforth and Segal1997; Oh-Ishi et al., Reference Oh-Ishi, Horita, Furukawa, Nemoto and Langdon1998; Stolyarov et al., Reference Stolyarov, Zhu, Alexandrov, Lowe and Valiev2001; Li et al., Reference Li, Gazder, Beyerlein, Pereloma and Davies2006). Based on the experimental observation and the deformation modes involved, Stüwe (Reference Stüwe2003) speculated route A to be the most efficient in terms of storage of dislocations. However, earlier experimental studies showed the trend that the density of dislocation is higher in route B c deformed sample (Langdon et al., Reference Langdon, Furukawa, Nemoto and Horita2000; Dobatkin et al., Reference Dobatkin, Kopylov, Pippan and Vasil'eva2004). Dobatkin et al. (Reference Dobatkin, Szpunar, Zhilyaev, Cho and Kuznetsov2007) examined the effect of the route and strain of ECAP on the structure and properties of oxygen-free copper pressed between N = 5 and 25 passes. They investigated the microstructure of the deformed samples by transmission electron microscopy (TEM) and orientation imaging microscopy (OIM) and also determined the mechanical properties. Their study indicated that the size of the structural element virtually does not depend on the processing route. The yield strength (YS) was found to be higher in the case of the sample deformed using route B c. One of the interesting result they found was that the strength properties remained essentially constant in the range of N = 5–25 passes, while – particularly for route B c – the ductility could increase between N = 10 and N = 25. The authors suggested that this may be because of the presence of a bimodal-like structure (Dobatkin et al., Reference Dobatkin, Szpunar, Zhilyaev, Cho and Kuznetsov2007). Grosdidier et al. also detailed the evolution of microstructure and corresponding tensile properties in high-purity copper processed using route B c (Grosdidier et al., Reference Grosdidier, Goran, Ji and Llorca2010). Their analysis revealed that after sufficient strain deformation imparted to their commercial purity Cu samples (>12 passes using route B c), a balance between recovery/recrystallization and deformation processes occurred during ECAP that generated a multi-modal grain size distribution in the sample. Again, this multi-modal grain size distribution generated the best strength – ductility compromise (Grosdidier and Llorca, Reference Grosdidier and Llorca2010).
Results reported in the previous section as obtained from the DSC and XRD studies indicate that the stored energy is higher in the route B c deformed sample compared with the routes A and C. The stored energy in the material is related to the amount of dislocations accumulated during processing which is directly related to the strength level of the processed materials. Thus, according to our results in terms of storage of dislocation, the strength of the sample deformed using route B c should be higher. Dobatkin et al. (Reference Dobatkin, Szpunar, Zhilyaev, Cho and Kuznetsov2007) have studied the properties of Cu samples processed using the three routes (A, B c, and C) for increasing the amount of strain up to ɛ = 29. They found, indeed, that the samples processed following route B c always revealed higher strength. Therefore, in terms of efficiency of the SPD process for imparting maximum dislocation in the material, route B c is the most efficient route.
However, because of the high-stored energy, the microstructures obtained through SPD are far from equilibrium. This can be a detrimental feature regarding thermal stability of a material. Therefore, the thermal stability of the ECAP microstructure is important in terms of the practical application of the ECAP processed material. The activation energy of recrystallization of the deformed sample gives an indication of the thermal stability. The result of the Kissinger analysis indicated that the activation energy is low for the route B c deformed sample. Low activation energy corresponds to poor thermal stability of the deformed microstructure and, thus, samples processed through route B c are the least thermally stable. Comparatively, routes A and C deformed sample microstructures have better thermal stability.
As discussed earlier the other important microstructural parameter that plays crucial role in determining mechanical properties of ultrafine grain materials is the distribution of crystallite size. It is now established from different studies that the broad crystallite size distribution yields better ductility. It has been observed that the crystallite size distribution is broader in the case of route C deformed sample compared with routes A and B c. Hence route C sample is expected to show better mechanical property.
Thus, if we consider the efficiency of the route of ECAP taking into consideration the thermal stability and mechanical properties of deformed microstructure, route C seems to be better compared with the other two routes.
V. CONCLUSION
Based on DSC and XRD studies of the samples deformed through routes A, B c, and C using ECAP, the following conclusions can be drawn:
1. Route B c leads to maximum storage of dislocations in the sample deformed using ECAP. This leads to higher value of stored energy in this sample.
2. The activation energy for recrystallization is low for the route B c deformed sample indicating the poor thermal stability of the deformed microstructure.
3. The crystallite size is smaller in the case of route A deformed sample and the size distribution is narrow in the case of routes A and B c.
4. The character of dislocations present in the deformed sample is dependent on the processing route. Route A leads to a dislocation structure that is combination of equally populated edge and screw type, while for route B the edge-type dislocations are more. For route C samples, the dislocations are entirely of edge character.
5. The arrangement of dislocations is independent of the processing route. The dislocations are arranged in a highly correlated fashion in all the ECAPed samples.
ACKNOWLEDGEMENT
We express our gratitude to Professor A. Eberhardt of Université Paul Verlaine de Metz, France for his help in DSC measurements.


