INTRODUCTION
The rubber plant (Hevea brasiliensis Muell. Arg.) was brought to Asia from Amazon jungles for the extraction of latex for the natural rubber production. Even to date, latex production has been the primary objective of the rubber plantations. The usage of rubber products is highly associated with the lifestyle of people, particularly the quality of life; therefore, due to increase in the population, the demand for rubber has increased despite any short-term market price fluctuations (Anon, 2010). In addition to the latex production, the rubber tree has been identified as a good source of timber and firewood, providing a significant income to the growers at the end of the lifespan. For instance, rubber timber is considered to be of high quality once treated, else it could be used in the manufacture of medium density fibre boards. Therefore, rubber plantations lessen the pressure on natural forests. Rubber is grown in ca. 11 million hectares globally (Anon, 2010); hence, its potential as a renewable timber or fuel source is vast. With the economic lifespan of 30 years, it has the potential of being harvested ca. 370,000 hectares annually.
Regardless of originally being a plantation crop, socioeconomic benefits of rubber have attracted smallholder farmers with 80% of world rubber produced from this sector (Anon, 2010). In most parts of the world, rubber cultivation is being expanded to under-developed areas with smallholder participation. This provides an opportunity to alleviate the rural poverty with a steady and substantial income given by rubber. As in Sri Lanka, most of such lands being converted to rubber are marginal lands for arable crops or meadows having no tree species. As per the regulations of the Clean Development Mechanism (CDM) of the Kyoto protocol, rubber cultivation (being a tree crop with over 20 years of economic lifespan and over 2–5 m height) in those lands is eligible for carbon credits under afforestation and reforestation of CDM (AR-CDM) as the lands concerned have had no forests since 1990. Furthermore, additional expenditure incurred on research and development activities in the expansion process justifies the needs of carbon credits. The additional income generated from carbon sales could be diverted either to farmers directly for their improved livelihood or to cover up the additional cost involved in the expansion process. Obviously, social benefits increase the quality of carbon credits, so the value of certified emission reductions in rubber cultivations.
Although the treaty was to expire in 2012, the commitment of developed countries for the CO2 abatement had been far beyond the reach, hence CDM continues even in 2013. Negotiations in Doha have set 2020 as the next milestone for the reduction of global emissions (Anon, 2012). Furthermore, a new proposal called reduce emission from deforestation and forest degradation (REDD) has been tabled based on two points of logic: (1) continuous sequestration of atmospheric CO2 by the existing forest and (2) not damaging the carbon stocks in forests for alternative ventures are to be remunerated. Although no conclusion could be derived during the recent Copenhagen, Cancun and Doha summits, it is likely to be effective in near future. If so, existing rubber plantations may be eligible for carbon trading depending on the regulations accepted.
In addition to the potential of direct sale of CO2 fixed in rubber trees, biomass in rubber could be used as a renewable energy replacing the fossil fuel and so eligible for CDM. To obtain carbon benefits from rubber cultivation, protocols are to be made available for in situ assessments of biomass and carbon. Although some studies have been conducted to estimate biomass and carbon in different components/whole tree of rubber (Saengruksawong et al., Reference Saengruksawong, Khamyong, Anongrak and Pinthong2012), most of them were on aboveground components (Rodrigo et al., Reference Rodrigo, Munasinghe and Gunawardena2005; Rojo-Martinez et al., Reference Rojo-Martinez, Jasso-Mata, Vargas-Hernandez, Palma-Lopez and Velazquez-Martınez2005). Wauters et al. (Reference Wauters, Coudert, Grallien, Jonard and Ponette2008) compared seven such models in estimating the aboveground carbon and the estimated values were found in a reasonable range despite some variations attributed mainly to the variation in the site of origin. The variations could also be due to genotype differences and the way data were generated for model testing (e.g. estimating tree circumference at different trunk heights). However, for developing rubber-based carbon projects, predictive models are required for different climatic conditions (Wauters et al., Reference Wauters, Coudert, Grallien, Jonard and Ponette2008). This should be mostly for the wet and intermediate rainfall regimes since rubber is not generally grown in very dry conditions. Due to difficulty in the assessment, the root system has not been given due consideration in carbon analyses, as a result most of the models developed have been confined to aboveground components of the rubber tree. The situation has been the same for most of other crops (Specht and West, Reference Specht and West2003). Obviously for convenience, ultimate assessments are to be based on non-destructive measurements. Tree circumference is the easiest and simplest measurement in rubber trees; however, the inclusion of total tree height has improved the accuracy of allometric relationships (Wauters et al., Reference Wauters, Coudert, Grallien, Jonard and Ponette2008). To build up the confidence in carbon markets, any model developed should never overestimate the values. Even though trees are generally looked after well in experimental projects, models developed in average management conditions in a particular climatic regime would avoid any risk on the supply failure. Furthermore, it will minimise the effect of genotype variation as the climatic factor is more prominent than other factors (Wauters et al., Reference Wauters, Coudert, Grallien, Jonard and Ponette2008). With this background, the present study was aimed at developing a simple protocol to assess biomass and carbon in rubber plantations (including belowground components) under two climatic regimes: wet and intermediate (note that rubber is not generally grown in very dry climates). Allometric relationships were expected to develop in this regard using both tree circumference and total height and, furthermore, empirical models on ontogenetic tree development and tree stand variation were to be built under average growth conditions. Thereby, for a given climatic regime, realistic and plausible values for biomass and carbon could be predicted at any stage of rubber plantations using interconnected relationships. For any project implemented, the values could be audited/monitored in situ simply and non-destructively with tree circumference and total height of few sample trees.
MATERIALS AND METHODS
Rubber grown already on commercial plantations under average growth conditions in Sri Lanka was assessed for the study. Basically, the study comprised three steps: (1) building up allometric equations to assess the timber, biomass and carbon content in rubber trees based on growth parameters (tree circumference and total height); (2) developing empirical models to quantify the ontogenetic changes in growth parameters and tree stand per hectare; and (3) estimating the biomass and carbon availability in the rubber crop at different growth stages by combining the models developed in previous steps.
Allometric equations to assess timber, biomass and carbon in rubber trees
This was based on the destructive growth analysis of the trees and confined to the wet zone (WZ) of Sri Lanka (latitude: 6° 34′–6° 41′ north; longitude: 79° 57′–80° 24′ east). The area received an annual rainfall of more than 2500 mm, with no pronounced dry period (Punyawardena, Reference Punyawardena, Mapa, Dassanayake and Nayakekorale2005) and soil was Ultisols (Dassanayake and Senerath, Reference Dassanayake, Senerath, Mapa, Somasiri and Nagarajah1999). Due to high economic value of rubber trees and difficulty in infilling vacant plants once removed, trees could not be uprooted on researchers’ discretion in existing plantations. Therefore, destructive growth analyses was confined to the trees due for uprooting for other reasons, i.e. those at the end of economic harvesting of latex and those to be removed to get the space for infrastructure development programmes. This has resulted in differences in the number of trees sampled from each site.
Resources available for the study did not permit to conduct all growth assessments in every site. To avoid site-specific discrepancy in data analysis, timber biomass with growth indicators was initially assessed in key sites of the study (as in the next two sections) and its proportional association with other components of the tree was subsequently determined by separate growth analyses. In this attempt, all activities in growth analyses were conducted in three steps. First, the timber log volume of trees was assessed together with tree girth and total height; then, its biomass was estimated with the knowledge on wood density. Second, the proportional distribution of biomass in tree components aboveground (i.e. leaves, twigs and timber logs) was assessed. Third, root biomass was assessed together with tree girth. Carbon assay in each tree component was made and the total carbon content in the whole tree was derived with the knowledge of biomass distribution.
Assessment of the total timber log volume in rubber trees
Rubber trees were studied in four sites in the low country WZ, comprising three genotypes (clones), i.e. RRIC100 in two sites, RRIC121 and RRIM600. Trees of RRIC100 in two sites were 28 and 30 years old after planting, while the age of plants in the clones RRIC121 and RRIM600 was 11 and 30 years, respectively. The number of trees felled for growth analyses in each site was 21 and 13 in RRIC100, 19 in RRIC121 and 11 in RRIM600, totalling 64 trees. Tapping the tree for latex extraction had caused some bark deformation up to ca. 1.2 m and therefore tree diameter at a height of 1.5 m was measured with the total height of the tree.
The main trunk and branches up to the circumference of 50 cm (i.e. 16-cm diameter, which is generally considered to be the minimum level used for sawing in Sri Lanka) and 20 cm (i.e. for total timber) were separated into sections and timber volume (T volume) in m3 was measured using Smalian's formula (Equation (1)) with the knowledge of length and diameter of each section (Philip, Reference Philip1994):
The total volume of each tree was calculated as the sum of the volume of the different sections.
Assessment of biomass
Wood samples were taken from four different positions of the tree (i.e. in the main trunk and branches) using an increment borer (SUUNTO, Finland). Of a known volume, oven-dry weight was measured for the wood density. The mean value was derived (730 ± 4.6 kg m−3) and used to estimate the biomass in timber (i.e. biomass in timber = the log volume × wood density).
Fractional partitioning of biomass in the aboveground tree components, i.e. timber, twigs – branches less than 20-cm circumference – petioles and leaves, was assessed in 20 trees (five from each site given in the ‘Assessment of the total timber log volume in rubber trees’ section). The timber log volume of the main trunk and branches up to a 20-cm circumference was measured and its biomass was estimated with the knowledge of wood density. Total fresh weight was measured in other components and subsamples (ca. 5% of fresh weight) were kept in a draft oven at 80 °C to a constant weight for dry weight analyses. On the basis of dry- to wet-weight ratio, biomass was estimated. The mean fractional distribution of biomass in aboveground components was calculated and thereby the total aboveground biomass (AGBM) in each of 64 trees assessed for timber log volume was determined as given in Equation (2):
Difficulties in the excavation of all rubber roots did not permit for the simultaneous assessment of roots and aboveground biomass. Therefore, root assessment was conducted at different sites with 17 trees in five age categories (5 trees of 9 years, 3 trees of 13 years, 6 trees of 15 years, 1 tree of 21 years and 2 trees of 23 years of age) representing the tree lifespan. Fresh weights of roots (up to 1-cm diameter) were measured after excavation up to 1.2-m depth and then as done in aboveground biomass, subsamples (ca. 5% of fresh weight) were taken for dry-weight analyses. Of the same trees, tree diameter at 1.5-m height of the trunk was measured; however, total height could not be measured as most of top components had been removed by the time of the study. Then, the relationship of tree diameter with root biomass was established (Equation (3)) with the simple linear regression procedure of the GENSTAT statistical package (GenStat, Release 11) (Payne, Reference Payne2008). With the knowledge of tree diameter, Equation (3) was used to determine the belowground biomass of 64 trees used for timber log volume assessment. Both above- and belowground biomass was added together to derive the total biomass of the tree:
Assessment of the carbon content
During the biomass assessment, eight subsamples (ca. 1 g) were taken from each of tree components in four trees for carbon analyses. Organic carbon content (i.e. % carbon in biomass) was assessed using the Walkley–Black rapid titration method (Piper, Reference Piper1950) and mean values were derived for each tree component. Then, with the knowledge of biomass content, total carbon in each tree component and in the whole tree was derived.
Model fitting for the estimation of timber log volume, biomass and carbon
Tree diameter and total height are easily measurable key parameters of plant growth. Considering the simplicity and convenience in usage, linear allometric relationships were intended to build up with above two parameters to estimate the contents of timber, biomass and carbon in rubber trees. Geometrically, the volume of a timber log is directly proportional to the squared diameter and the length and, therefore, the product of squared tree diameter at 1.5-m height and total height of rubber trees (Equation (4)) was taken to build up a linear function to estimate timber log volume, biomass and carbon content using the simple linear regression procedure of the GENSTAT statistical package (GenStat, Release 11) as
Allometric equations developed for three principal components, i.e. total timber volume, biomass and carbon, were validated in two separate sites (9 and 30 YAP) comprising mixture of Hevea genotypes. Measurements were made in 29 trees and the actual amounts of timber, biomass and carbon were obtained together with fitted values from model estimates. Deviations of the parameters (intercept and slope) of regression lines fitted to actual values were statistically tested against the fitted values using the ‘T test’. Also, the mean absolute percentage error (MAPE) was calculated.
Quantification of the ontogenetic changes in growth parameters
This was primarily to build up the growth curves with respect to tree diameter and total height of rubber trees under varying climatic regimes. Furthermore, changes in the tree stand were quantified. The measurements were based on non-destructive in situ assessment on tree diameter (by diameter tape) and total tree height (by altimeter; Haga, Germany) in rubber plants and confined to the most widely grown genotype, RRIC100 due to its availability.
Rubber in Sri Lanka is grown in two agro-climatic zones, i.e. WZ and intermediate zone (IZ). The former comprises the area receiving the mean annual rainfall of more than 2500 mm with no distinct dry periods, while the rainfall in the latter is between 1750 and 2500 mm with two dry periods (Punyawardena, Reference Punyawardena, Mapa, Dassanayake and Nayakekorale2005). Furthermore, soils in the rubber growing areas of above zones are Ultisols and Alfisols, respectively (Dassanayake and Senerath, Reference Dassanayake, Senerath, Mapa, Somasiri and Nagarajah1999). In total, 60 sites of RRIC100 at different stages of growth were selected from each zone and, in each site, 25 trees were assessed for tree (main trunk) diameter at 1.5-m height. However, total height was measured only in 50 sites in the wet and 40 in the intermediate zones. In each site, five trees were measured for the total height.
As expected, ontogenetic variations of tree diameter and height were not linear; hence, the following logistic growth function (Equation (5)) was fitted using the nonlinear regression procedure of the GENSTAT statistical package (GenStat, Release 11):
Existing tree stand (trees ha−1) at different growth stages representing the 30-year life cycle was assessed in 50 sites in the WZ and IZ. The functions fitted to both agro-climatic zones were comparable; hence, a common function (Equation (6)), ‘linear by linear’ (rectangular hyperbola) was developed with pooled data using the nonlinear regression procedure of the GENSTAT statistical package (GenStat, Release 11):
Biomass content and carbon fixed at different growth stages
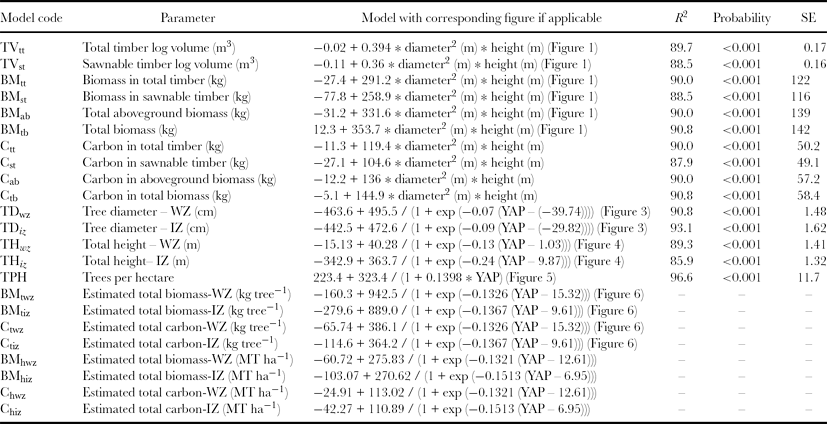
Values of tree diameter and total height of the rubber tree in each agro-climatic zone at each year of growth obtained from the models developed (model codes TDwz and THwz for WZ and TDiz and THiz for IZ in Table 2) using Equation (5) were fed into the allometric equations to derive the values for the timber log volume and biomass and carbon in timber [models developed (model codes TVtt, BMtt and Ctt) using Equation (4)], aboveground components (model codes BMab and Cab) and in the whole tree (model codes BMtb and Ctb). Thereafter, considering the ontogenetic changes in tree density (model code TPH), biomass and carbon values were obtained on hectare basis. Since all growth analyses and model development were confined to the rubber plants above the age of 6 years, model predictions were also limited to the same. Finally, for easy prediction of ontogenetic changes in all important yield parameters, a logistic growth function (Equation (5)) was fitted using the nonlinear regression procedure of the GENSTAT statistical package (GenStat, Release 11). (Note that yield parameters were the dependent variable of the equation.)
RESULTS
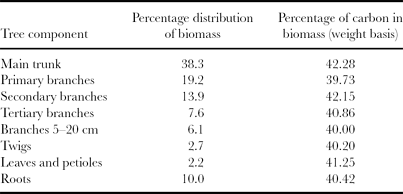
Biomass in timber logs up to 20-cm circumference (up to tertiary branches) comprised 79% of the total biomass of the tree (Table 1). Root biomass accounted only for 10% and biomass in leaves (including petioles) was 2.2%. Carbon content was comparable among the tree components with a mean value of 40% (Table 1).
Table 1. Biomass distribution in the rubber tree together with the presence of organic carbon in each component.

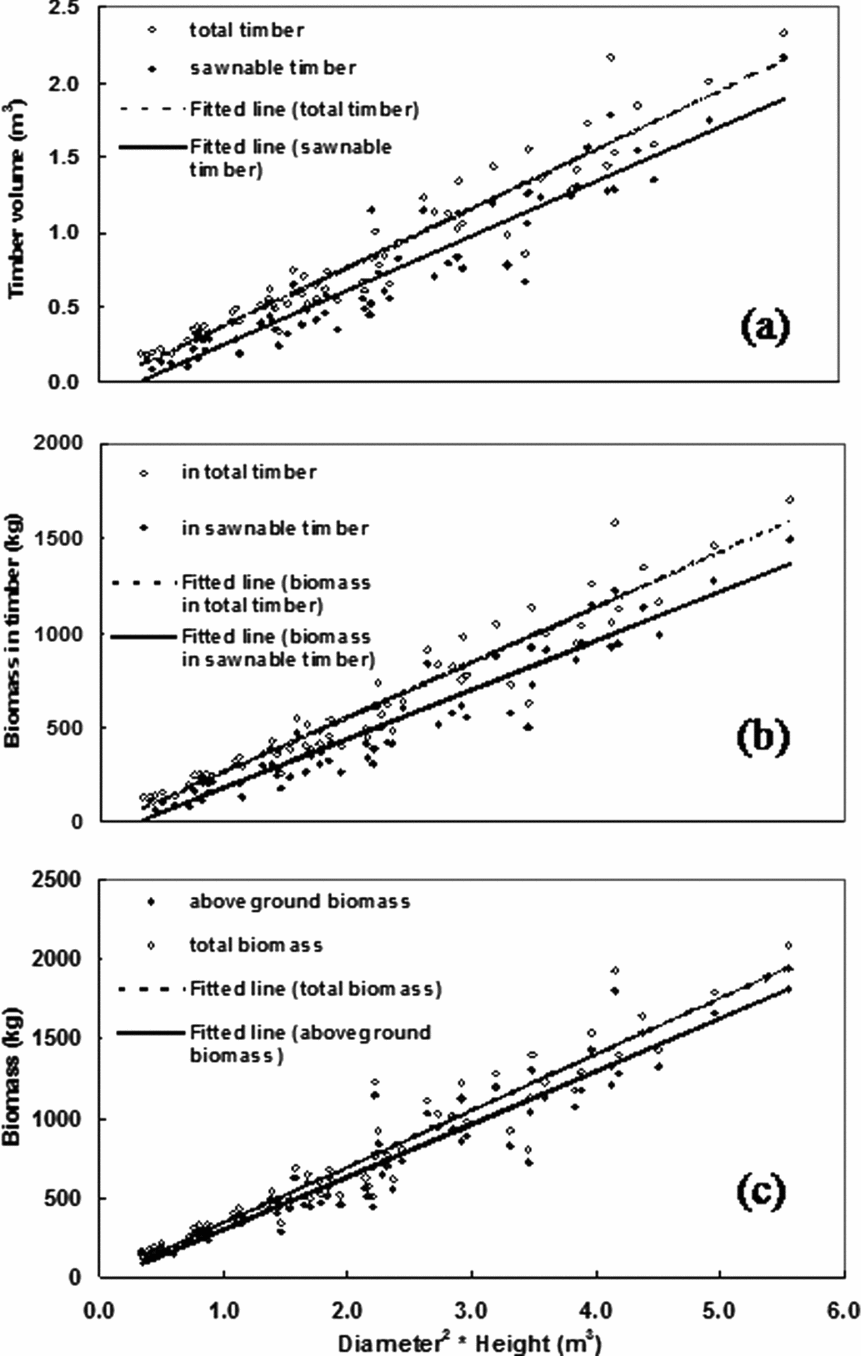
Linear functions based on the tree diameter at 1.5-m height and the total height were well fitted (p < 0.001) to the timber log volume and biomass in timber, aboveground components and whole tree (Figure 1). As indicated by regression coefficients (r 2), all functions were able to describe the variability over 90%. The intercepts of the linear functions remained very close to the origin. Full details of all functions are given in Table 2.

Figure 1. Relationship of (a) timber log volume (per tree), (b) biomass in timber (per tree) and (c) total and aboveground biomass (per tree) with the tree diameter (at 1.5 m height) and the total height. Models (model codes TVtt, TVst, BMtt, BMst, BMab and BMtb) derived from the best-fitted lines to the values are shown in Table 2. N = 64.
Table 2. Summary of the all models developed together with general statistics. Codes WZ, IZ, YAP and SE refer to wet zone, intermediate zone, years after planting and standard error, respectively.

For a unit increase in the overall value of diameter squared into total height (D 2 × H), the increase in total timber (i.e. up to 20-cm circumference) was 9.4% higher than that in sawnable timber (i.e. up to 50-cm circumference) (as given by the slope of the curves). The highest values recorded for total and sawnable timber log volumes were 2.33 and 2.17 m3 tree−1, respectively. For a centimetre increase in diameter, total timber volume increases by 0.02–0.09 m3 in the height range present. Similarly, the sensitivity of timber volume for a unit change in total height (m) was in the range of 0.01–0.09 m3 (in overall diameter range).
Similar to the timber log volume, biomass in total timber logs of the tree showed a higher rate of increase than that in sawnable timber logs (ca. 12.5%). The difference between the highest and lowest recorded biomass in total timber was in the range of 1703–128 kg. In the whole range of trees assessed, the rate of increase in biomass per 1 cm increase in tree diameter was in the range of 14–68, 16–77 and 17–82 kg in total timber logs, aboveground components and whole tree, respectively. Similarly, the sensitivity for a 1-m change in total height was in the order of 5–68, 6–78 and 7–83 kg tree−1.
Allometric models fitted for carbon contents were quite similar to those for biomass despite the differences in the values of constants. The models were statistically significant (p < 0.001) with an accuracy of ca. 90% (i.e. r 2 = 90) (Table 2). Within the range tested, carbon content varied by 6–28, 7–32 and 7–34 kg in total timber, aboveground components and total tree, respectively, for a 1-cm change in tree diameter. Corresponding values for the 1-m change in tree height were 2–28, 3–32 and 3–34 kg.
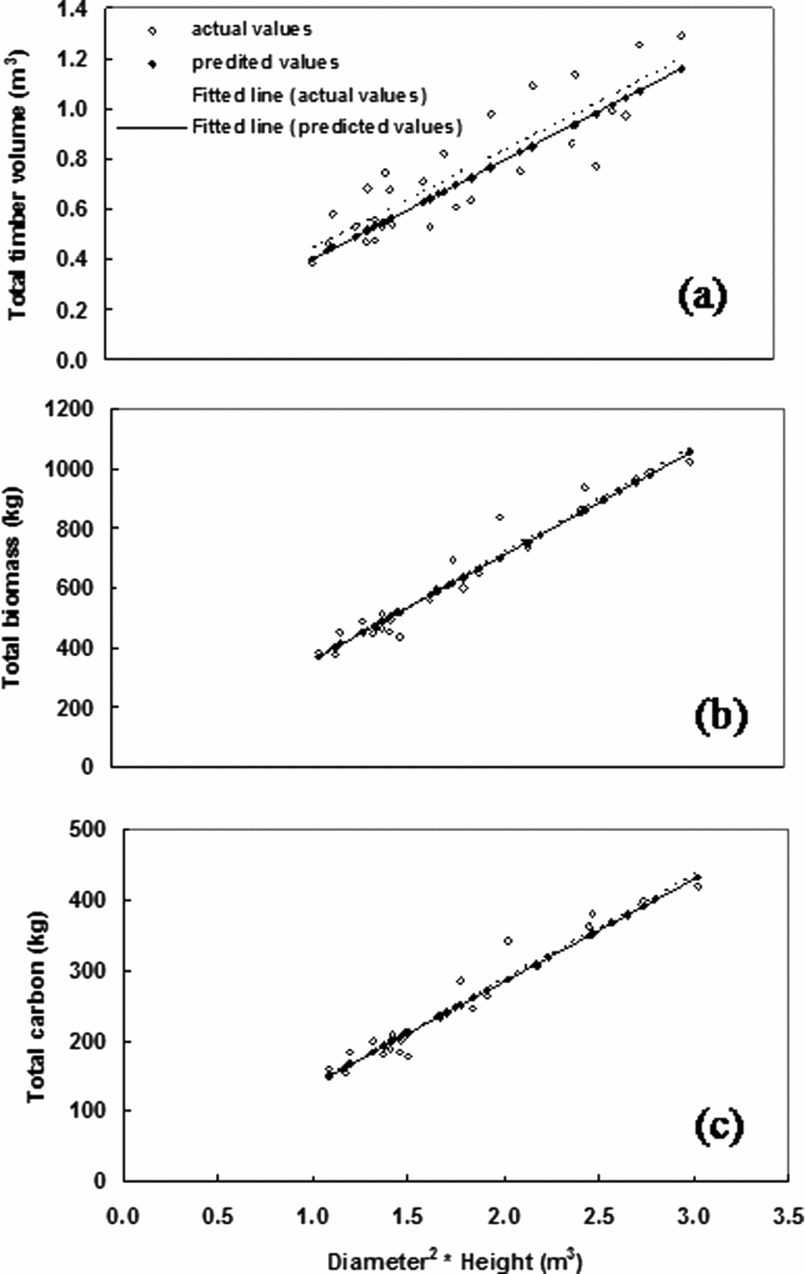
Two parameters, i.e. intercepts and slopes, of allometric equations developed for timber, biomass and carbon showed no significant variation in the validation sites having 29 rubber trees in a mixture of genotypes (Figure 2). Whist the MAPE recorded for the timber volume function was 12.9%, that for biomass and carbon functions was below 5%.

Figure 2. Comparison between actual and fitted values using allometric models developed for (a) timber, (b) biomass and (c) carbon. Validation was made in completely different sites from model development.
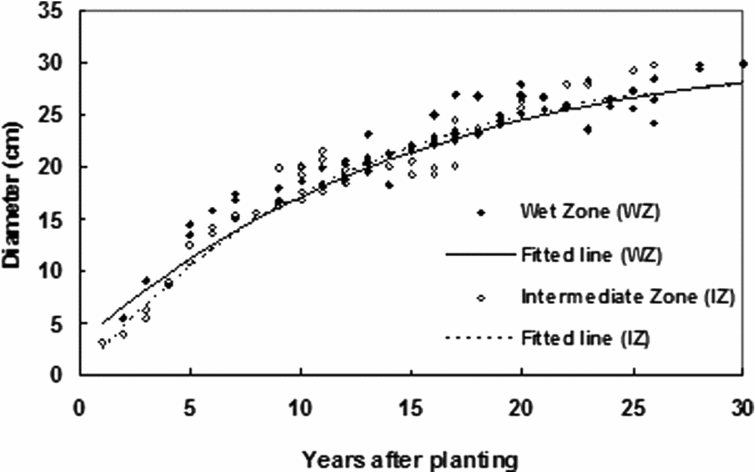
The logistic function (model codes TDwz and TDiz) fitted to the values of tree diameter at 150-cm height of the trunk in the genotype RRIC100 has been able to explain the ontogenetic development in both climatic zones successfully (Figure 3). Models were statistically significant (p < 0.001) and accounted for the variability of ca. 90% (i.e. r 2 = 0.9) (Table 2). Basically, the trunk expansion was more or less the same in both WZ and IZ. Nevertheless, tree diameter in the IZ was less at the beginning but picked up quickly. As shown by the parameter m, the fitted logistic function (Equation (5)), the maximum growth rate was achieved quicker in the IZ. The highest diameter achieved (as given by the upper asymptote, parameter c) was slightly higher in the WZ.

Figure 3. Ontogenetic variation in diameter of rubber tree (genotype RRIC100). Models (model codes TDwz and TDiz) derived from the best-fitted lines to the values are shown in Table 2. N = 60 (for each zone).
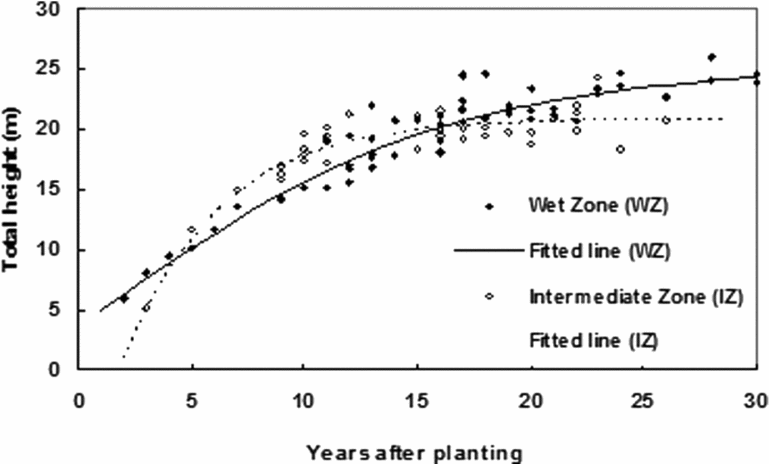
Ontogenetic variations of total tree height could also be successfully explained by the logistic function (Figure 4). The models (THwz and THiz) were statistically significant (p < 0.001) and have explained the variability by ca. 90% (i.e. r 2 = 0.9) (Table 2). The ultimate height of the tree was greater in the WZ than in the IZ and was indicated by the parameters a and c, which represent the upper asymptote of the logistic curves. However, the height expansion was more rapid in the IZ in early stages of growth, where it achieved the highest height, quicker than that of the WZ. Assuming that growth is linear during the first 10 years, total height in the IZ increased at a rate of 1.6 m year−1 whilst that of the WZ was 1 m.

Figure 4. Ontogenetic variation in total height of rubber tree (genotype RRIC100). Models (model codes THwz and THiz) derived from the best-fitted lines to the values are shown in Table 2. N = 50 (wet zone), 40 (intermediate zone).
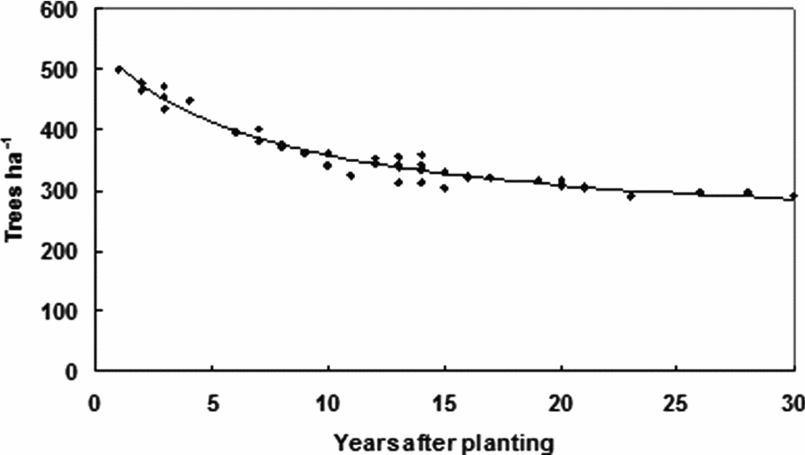
Although 500 trees were planted at the beginning, what remained at the end of the 30-year planting cycle was about 285 ha−1 (Figure 5). The rate of decline in tree density diminished with time; hence, the function linear by linear was well fitted to the observation (i.e. r 2 > 0.9 and p < 0.001). According to the first constant a in Equation (6) (model code TPH in Table 2), the tree density would never fall below 223 trees ha−1. On average, the annual decline in tree density appeared to be ca. 1.5%.

Figure 5. Ontogenetic variation of rubber tree stands in Sri Lanka (genotype RRIC100). Model (model code TPH) derived from the best-fitted line to the values is shown in Table 2. N = 50.
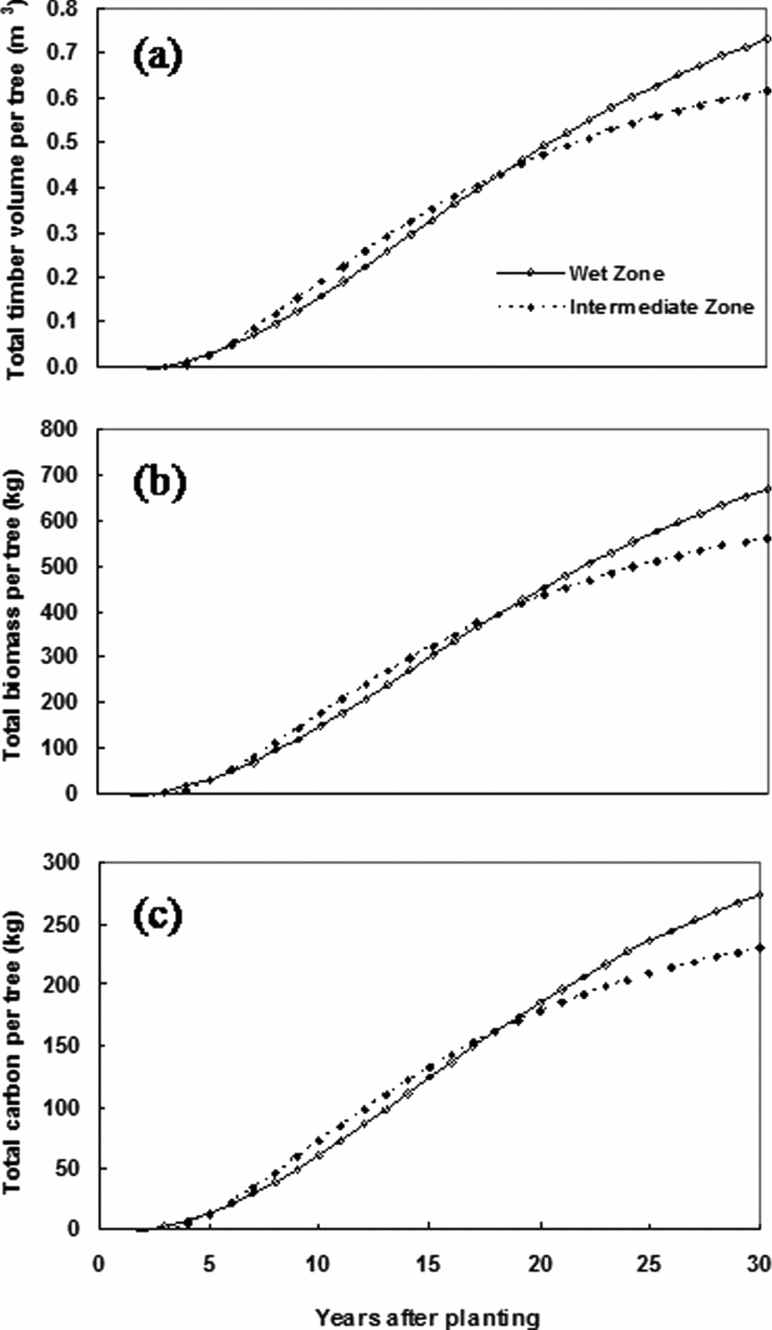
Overall model predictions of the ontogenetic accumulations of the total timber log volume, biomass and carbon in the rubber tree in both climatic zones could be explained by logistic functions (model codes BMtwz, BMtiz, Ctwz and Ctiz in Figure 6). Despite the slightly higher values in the early stages of IZ, ultimate quantities were fairly higher in the WZ than in the IZ. For instance, timber volume per tree at the end of the 30-year lifespan of the rubber tree was 0.73 m3 in the WZ and 16 % lesser than that in the IZ. Similarly, total tree biomass and total carbon content in a 30-year-old tree was 668 and 274 kg in the WZ and 561 and 230 kg in the IZ, respectively. Time-bound changes in the values on hectare basis resembled those in the tree as explained by logistic functions (model codes BMhwz, BMhiz, Chwz and Chiz in Table 2). The timber volume per hectare of rubber was 208 m3 in the WZ and 175 m3 in the IZ in 30 years. Also, the biomass and carbon content fixed in a hectare of rubber land at the end of the life cycle was 191 and 78 MT for the WZ and 160 and 66 MT for the IZ, respectively.

Figure 6. Model predictions of the ontogenetic accumulations of (a) total timber log volume, (b) total biomass and (c) total carbon per tree in the rubber crop for the wet zone and the intermediate zone of Sri Lanka. Details of the models (model codes BMtwz, BMtiz, Ctwz, Ctiz) are shown in Table 2.
DISCUSSION
Growth models are powerful tools in the quantification of biomass and carbon stocks in any vegetation providing a non-destructive approach for in situ assessments. With the combination of allometric models at the tree level and empirical growth models developed in the present study, it was possible to quantify timber, biomass and carbon in the rubber crop under average growth conditions in wet and intermediate climates of Sri Lanka. This could be considered as a structurally based operational model and the most important feature is that it is based on simple growth indices. Models developed accounted for over 90% of the variability in the data used for developing those. One may suggest improving the accuracy of models with genotypic specific relationships; however, the level achieved in the present study is substantial enough for any extended usage of the allometric models. More importantly, key allometic models have been validated in completely different sites with a different combination of genotypes. No parameter of original functions varied significantly in these sites and, so the models could be used to predict the values at reasonable accuracy. The level of accuracy in biomass and carbon estimation would be as high as over 95%; however, that in timber has been limited to ca. 87% (as shown by MAPE). Unlike the assessment of biomass or carbon in the whole tree, the timber component is demarcated by diameter measurements and, therefore, any slight deviation in the demarcation point (i.e. the point at 20-cm circumference) changes the value of timber, reasoning out the 12.9% MAPE. The accuracy of allometric functions could be affected only by the changes in tree architecture/geometry and the model validation showed that the influence of soil and environmental conditions, crop management and genotypes on rubber tree geometry is not large enough to change the models developed.
Most commonly, polynomials and power functions and their combinations are used in allometric modelling (Dey et al., Reference Dey, Chaudhuri, Vinod, Pothen and Sethuraj1996; Shorrocks et al., Reference Shorrocks, Templeton and Iyer1965). With the disadvantage of biologically unreasonable behaviour of such allometric functions, linear regression models were preferred as standard methods. Allometric models developed in the present study resemble the simple mathematical equation generally used to estimate the volume of the cylinder, i.e. diameter squared to represent the cross-sectional area and total height to length of the cylinder. Little variability in wood density within the tree was observed and woody components represented the majority of biomass. Furthermore, percentage carbon contents in different components of the tree did not vary largely. On this basis, allometric models developed here for even total biomass and carbon could rather be considered as structurally meaningful than empirical models.
Only limitation in the use of allometric models is that these cannot be applied to the immature rubber trees (below 6-year-old), which have not been assessed in the present study. The timber component is not clearly apparent in those trees and if required, only biomass and carbon could be assessed. As observed in the growth functions, the enlargement of trees is rather linear in this phase and so the ontogenetic change of biomass and carbon in immature rubber trees could be estimated using the assumption of linearity. A nonlinear model adopted to explain the ontogenetic variation in the carbon content of the rubber tree by Wauters et al. (Reference Wauters, Coudert, Grallien, Jonard and Ponette2008) showed a high level of deviation between actual and predicted values below the age of six years, supporting the above assumption. In addition to the key equations, a variety of allometric models were developed for different uses. One would be interested only in total aboveground biomass/carbon or else biomass in wood components. Depending on the end-user need, models are available here to estimate sawnable timber log volume or biomass/carbon in it. Therefore, practical application of the models developed is vast. In addition to CDM projects, they facilitate the estimation of carbon in existing rubber plantations and the assessment of the annual increment or change in carbon stocks facilitating REDD if implemented.
Logistic functions are suitable and generally used to build up growth curves, as they are capable of showing the classic ‘S’ type of growth. In order to model the tree growth with respect to tree trunk expansion and height increase, logistic functions were used. Although the model fitted well, the classic ‘S’ type could not be observed due to the fact that growth values were collected from different sites which were managed for commercial exploitation, resulting in the low level of resolution. Furthermore, rubber plantations are established with bud-grafted plants and, therefore, their growth pattern would be slightly different from that originated directly from seeds. Nevertheless, the logistic function fitted to the continuous data collected from a single site in a rubber/banana intercropping experiment showed the classic ‘S’ type curve (Rodrigo et al., Reference Rodrigo, Stirling, Teklehaimanot and Nugawela2001) proved the suitability of this function to explain the growth of rubber. In spite of similar growth patterns, the ultimate growth in the WZ was slightly higher than in the IZ. This could be expected due to the suboptimal growth conditions with respect to rainfall distribution and soil water prevalence in the IZ. Nevertheless, as per the logistic function fitted, the maximum growth rate was achieved quicker in the IZ. Although this was quite unexpected, Rodrigo et al. (Reference Rodrigo, Stirling, Teklehaimanot and Nugawela2001), in a study on rubber-based intercropping systems, concluded that rubber plants grown with intercrops such as banana achieve the highest growth rate earlier than the sole cropped rubber. Unlike in the WZ, the rubber in the IZ is grown by traditional farmers, who always tend to grow some other crop with rubber. This is particularly important to protect the rubber plants from the additional solar radiation (Rodrigo et al., Reference Rodrigo, Iqbal and Munasinghe2009) and would have been the reason for reaching the highest growth rate quicker in the IZ.
Empirical models that explain the ontogenetic development of tree diameter, total height and tree stand of the genotype RRIC100 represent only the average management and growth conditions. In general, fertilizer application and weed management are not properly done and, in some instances, the quality of planting materials may be poor. Particularly in the smallholder sector, only the half of the recommended dose of fertilizer is applied during the immature phase as this is the amount given as rubber subsidy in Sri Lanka and, also in the mature phase, no proper records of fertilizer application are available. With an ideal management condition, a tree diameter expansion rate of 3.2 cm is expected during the first five years of growth, although the value recorded in this study was ca. 1.5 cm. Therefore, with proper management conditions, the growth of rubber would be much better, resulting in a greater amount of biomass and carbon fixed. The average diameter recorded for a rubber tree at the end of 30 years was 28 cm; however, in the development of allometric models for the estimation of timber, biomass and carbon, trees having a diameter up to 50 cm were taken and, therefore, those models will undoubtedly be applied for such improved growth conditions. Though not assessed due to limited availability in grower use, other genotypes also show similar growth rates to RRIC100 (Anon, 2009a). Therefore, the growth models developed here for RRIC100 could also be used for other genotypes under average growth conditions.
As per the recommendation of RRISL, the initial tree density was 500 trees ha−1. Due to natural deaths, the actual tree density tended to decline with time and reached an average of 285 trees ha−1 at 30 years. According to the UNFCCC guideline, the acceptable rate of the annual decline in tree stand in forestry projects is in the range of 0–2% (Anon, 2009b) and, therefore, the value recorded here (ca. 1.5% year−1) was falling towards the high end of this range. Particularly during the initial five years, the decline was as high as 3.7% and only 1.1% after ten years. This reflects the low level of the initial crop establishment, which could be attributed to problems associated with either crop management or quality of planting material. Therefore, with the improvement in such aspects, tree stand could be maintained at higher level for increased total biomass and carbon per unit area. Under proper management, it is expected to have ca. 400 trees ha−1 at the end of 30 years. Furthermore, high density planting with a shorter life cycle could be advocated for greater biomass production. Though not generally practised for latex production due to high costs, such an approach could be adopted for increased amounts of carbon fixed. For instance, high density planting in Thailand has shown ca. 50% increase in carbon stocks at 20 years over the values recorded in the present study (Saengruksawong et al., Reference Saengruksawong, Khamyong, Anongrak and Pinthong2012).
In the WZ, an average rubber tree is capable of fixing 274 kg of carbon, which is equivalent to ca. 1000 kg of CO2. The values given here are comparable with those reported in Malaysia (Sivakumaran et al., Reference Sivakumaran, Kheong, Hassan and Rahman2000) and China (Cheng et al., Reference Cheng, Wang and Jiang2007). Studies in India also quoted a similar value as the average over six genotypes tested (Ambily et al., Reference Ambily, Meenakumari, Jessy, Ulaganathan and Nair2012). The amount of carbon fixed within a plant in the IZ was 16% less than that in the WZ due to the difference in growth. Similar differences were also observed in both timber volume and biomass. With fewer clouds, one would expect to have a high level of carbon sequestering in the IZ; however, soil moisture and vapour pressure deficit seem to limit the photosynthetic rates of rubber (Rodrigo et al., Reference Rodrigo, Nugawela, Sivanathan, Witharama and Jayasinghe2000).
On a hectare basis, the total amount of carbon fixed in biomass and latex in the WZ and IZ was 79 and 66 MT, respectively. These amounts are equivalent to 290 and 242 MT of sequestered CO2, respectively. Annual litter fall was capable of adding another 23 MT of carbon during the 30-year lifespan; however, only 1–2% of that amount (Ayanaba and Jenkinson, Reference Ayanaba and Jenkinson1990), i.e. ca. 2 MT of CO2, would remain long term in soil. Those amounts collectively could be marketed should carbon trading be undertaken. Particularly in the IZ of Sri Lanka, most of farmers are new to the rubber and are dependent on seasonal crops. Because of the uncertainty in income from seasonal crops, they are either at or below the poverty line. This would be the case in the expansion of rubber cultivation to non-traditional areas in other countries. Rubber provides a permanent and continuous income, lifting them from the poverty. Therefore, social benefits of rubber projects are huge and so the face value of the carbon market would be greater.
In addition to the aforestation/reforestation projects targeting direct sale of carbon in the rubber tree, energy-based CDM projects could be built up using rubber firewood as a renewable energy, replacing the fossil fuel burning. In general, 3 kg of biomass is required to compensate 1 kg of fossil fuel. On this basis, biomass in 1 ha of land (at the end of 30 years) is equal to 64 MT of fossil fuel. Therefore, the potential emission reduction in this manner would be ca. 187 MT CO2 ha−1 (1 MT of fuel ≈ 3 MT of CO2).
In conclusion, the present study has provided sufficient information to develop and monitor rubber-based projects, particularly for carbon trading. It provided allometric models to estimate timber, biomass and carbon in rubber trees in situ and also a framework to assess them in different climatic conditions. Not only for the total amounts but also for biomass and carbon in key components (e.g. aboveground biomass and sawnable timber), allometric models were developed and, therefore, project developers could select them on their discretion. Although empirical models for growth patterns of rubber demonstrate Sri Lankan average growth conditions, allometric functions would be acceptable even elsewhere.
Acknowledgements
The authors acknowledge the research grants of the Sri Lanka Council for Agricultural Research Policy (No.12/530/400) and Climate Change Enabling Activity (Phase II) of the Ministry of Environment and Natural Resources, Sri Lanka, for the financial support. Also, the assistance provided by Dr (Mrs) W. Wijesuriya and Mr P. K. W. Karunathilake of the Rubber Research Institute of Sri Lanka in statistical analyses and field data collection, respectively, was greatly appreciated.


