


INTRODUCTION
Stressors associated with ocean acidification (OA) and parasitic infection have the potential to alter the metabolic demands experienced by many marine organisms. OA changes the relative concentrations of physiologically important charged molecules, such as hydrogen, bicarbonate and carbonate ions (Dickson et al. Reference Dickson, Sabine and Christian2007), potentially increasing the energetic costs of intra- and extra-cellular acid–base homeostasis (Pan et al. Reference Pan, Applebaum and Manahan2015) and the biomineralization of calcium carbonate (Kelly and Hofmann, Reference Kelly and Hofmann2013). This is especially true for marine invertebrates, many of which possess a limited ionoregulatory capacity and biogenically form calcified structures (Pörtner, Reference Pörtner2008). Parasitic infection can also increase the energetic demands of host organisms, by absorbing nutrients from, or causing damage to, host tissue, and by inducing behaviours that are energetically costly (Bates et al. Reference Bates, Leiterer, Wiedeback and Poulin2011; Toledo and Fried, Reference Toledo and Fried2011).
The process of maintaining pH balance across cellular spaces requires a significant investment of metabolic energy (Pörtner et al. Reference Pörtner, Bock and Reipschlager2000), and exposure to an acidified environment has often been correlated with increased respiration (Zhang et al. Reference Zhang, Cheung and Shin2014). The simultaneous reduction of the carbonate ion concentration of seawater could also dramatically increase the energy required to form calcified structures (see review in Parker et al. Reference Parker, Ross, O'Connor, Pörtner, Scanes and Wright2013). Consequently, changes to the chemical speciation of seawater caused by OA may have wide-ranging physiological effects on many marine species, which may manifest themselves as changes in energy usage.
By definition, parasitic infection has a negative effect on host organisms, and, like changing abiotic environmental conditions, can alter the energy demands of the host. Parasites can withdraw energy from hosts directly, through the absorption of nutrients or ingestion of tissue (Sorensen and Minchella, Reference Sorensen and Minchella2001), and indirectly, by initiating behaviours that increase the host's metabolic demands (Bates et al. Reference Bates, Leiterer, Wiedeback and Poulin2011; Macnab and Barber, Reference Macnab and Barber2012). Accordingly, parasites additively increase the energy requirements of infected organisms, as the host must generate sufficient energy to meet its own needs plus the needs of the parasite, invest metabolic energy into tissue repair, and/or compensate for parasite-mediated increases in energetically costly behaviour.
The energy status, and rates of energy consumption, of living organisms are commonly quantified by measuring oxygen consumption rates (e.g. Melatunan et al. Reference Melatunan, Calosi, Rundle, Moody and Widdicombe2011) and the concentration of free glucose in body tissues and fluids (e.g. Berthelin et al. Reference Berthelin, Kellner and Mathieu2000), The oxygen consumption rates of marine gastropods typically increase in response to moderate abiotic stress, as a result of compensatory or regulatory processes requiring more metabolic energy, and decrease in response to extreme abiotic stress as their compensatory ability is overwhelmed, i.e. metabolic depression (Pörtner and Farrell, Reference Pörtner and Farrell2008). Changes in tissue glucose concentration can be caused by an imbalance between glycogen breakdown and the rate of glucose consumption in the glycolytic process. If glycogen breakdown outpaces glucose consumption, tissue glucose levels will rise; conversely, if glucose consumption outpaces glycogen breakdown, tissue glucose will fall (Martínez-Quintana and Yepiz-Plascencia, Reference Martínez-Quintana and Yepiz-Plascencia2012). Elevated rates of glucose consumption can eventually lead to mortality, as energy stores are depleted at a greater rate than they are replenished.
The results of previous studies of marine gastropods exposed to simulated OA conditions are variable: increased rates of oxygen consumption at 6·63 and 7·8 pH (Zhang et al. Reference Zhang, Cheung and Shin2014); decreased rates of oxygen consumption at 7·6 pH (Melatunan et al. Reference Melatunan, Calosi, Rundle, Moody and Widdicombe2011); reduced heart rates at 7·6 pH (Ellis et al. Reference Ellis, Bersey, Rundle, Hall-Spencer and Spicer2009); increased ATP concentration at 7·6 pH (Melatunan et al. Reference Melatunan, Calosi, Rundle, Moody and Widdicombe2011); and increased mortality between 7·4 and 7·98 pH (Kimura et al. Reference Kimura, Takami, Ono, Onitsuka and Nojiri2011; Zhang et al. Reference Zhang, Cheung and Shin2014). Variability in the oxygen consumption rates of different species exposed to the same pH suggests that the metabolic tolerance of marine gastropods is highly species-specific. The few studies that have exposed more than one species of marine gastropod to acidified seawater (Coleman et al. Reference Coleman, Byrne and Davis2014; Zhang et al. Reference Zhang, Cheung and Shin2014), or conspecifics taken from different populations (Lardies et al. Reference Lardies, Arias, Poupin, Manríquez, Torres, Vargas, Navarro and Lagos2014), concluded that abiotic characteristics of the gastropods’ habitat were the major predictors of tolerance to stressors associated with OA. Although caused by very different physiological mechanisms, the effects of trematode infection and OA on marine gastropods are relatively similar. Trematode infection can increase or decrease oxygen consumption rates, elevate heart rates and positively or negatively affect the survival of infected gastropods (see the review in Galaktionov and Dobrovolskij, Reference Galaktionov and Dobrovolskij2003). In addition, trematode infection has been linked with changes in haemolymph glucose levels and increases in the rate of glycolysis; these effects appear to be specific to host and parasite species (Fried and Graczyk, Reference Fried and Graczyk1997).
The aim of this study was to describe the combined effects of trematode infection and exposure to acidified seawater on the metabolic status of the intertidal mud snail Zeacumantus subcarinatus, and to identify species-specific effects of the infecting parasite. Accordingly, Z. subcarinatus snails were categorized as infected with one of three trematode species (Maritrema novaezealandensis, Acanthoparyphium sp. or Philophthalmus sp.), or as uninfected, and exposed to acidified (7·6 and 7·4 pH) or unmodified (8·1 pH) seawater. The pH treatments chosen for this experiment correspond to the current average seawater pH measured at the collection site of the experimental organisms (8·085 pH, see Supplementary Material Table S1 and MacLeod, Reference MacLeod2015), which was similar to the global average of 8·1 pH, and predicted average conditions for the year 2100 (7·6 pH) and 2300 (7·4 pH) reported in the Intergovernmental Panel on Climate Change (IPCC, Reference Field, Barros, Dokken, Mach, Mastrandrea, Bilir, Chatterjee, Ebi, Estrada, Genova, Girma, Kissel, Levy, MacCracken, Mastrandrea and White2014).
MATERIALS AND METHODS
Trematode–snail system
The herbivorous New Zealand mud snail, Z. subcarinatus, is widely distributed along the New Zealand coast, occupies a wide range of habitats (sand, rock and mud substrates) from the sublittoral zone to the littoral fringe, and is a first intermediate host, i.e. the site of asexual reproduction, for many species of trematode parasites (Fredensborg et al. Reference Fredensborg, Mouritsen and Poulin2005). Trematode infection of Z. subcarinatus causes complete sterilization, as parasite tissue displaces the host's reproductive organs. At the collection site used in this experiment [Lower Portobello Bay (LPB), South Island, New Zealand] Z. subcarinatus is infected by eight trematode parasites (Leung et al. Reference Leung, Donald, Keeney, Koehler, Peoples and Poulin2009), although in the following experiments we focus on the three most common species: M. novaezealandensis (60% prevalence), Philophthalmus sp. (10% prevalence) and Acanthoparyphium sp. (3% prevalence). All three trematode species produce free-swimming larvae (cercariae) within the snail host, which periodically emerge in large numbers to actively infect the next host in the parasite's life cycle (Acanthoparyphium sp. and M. novaezealandensis) or form a cyst on the surface of a transport host (Philophthalmus sp.) (Martorelli et al. Reference Martorelli, Fredensborg, Mouritsen and Poulin2004, Reference Martorelli, Fredensborg, Leung and Poulin2008).
Snail collection and morphology, and parasite identification
Approximately 2000 Z. subcarinatus snails were collected at LPB in July 2013 and subsequently screened for trematode infection by exposing snails to physical conditions that trigger cercarial emergence: warmed seawater (25 °C) and constant light. Trematode species were identified by inspecting cercariae under a dissecting microscope and comparing cercarial morphology with published descriptions of all parasite species (Martorelli et al. Reference Martorelli, Fredensborg, Leung and Poulin2008). Snails that were positively identified as infected with a parasite of interest were maintained at room temperature (approximately 18–20 °C) for one week before being screened a second time, thus reducing the probability of selecting snails that were infected by two parasite species. All snails selected for the experiment were then marked with individual identification labels (Bee Works, Orillia, Canada), maintained at room temperature in aerated seawater (approximately pH 8·1, 20 °C), and fed sea lettuce (Ulva spp.) ad libitum. Prior to the experiments, the wet weight of each snail was recorded (±0·001 g), and the shell length measured using digital photographs (64× magnification) and image analysis software (ImageJ). Snail length was used throughout the experiment as a proxy for age, as snails taken from the same population typically have similar growth rates (Graham, Reference Graham2003).
OA simulation system
In order to expose snails to acidified seawater, a modular OA simulation system was designed (MacLeod et al. Reference MacLeod, Doyle and Currie2015). Three seawater aquaria were constructed, each consisting of a 120 L culture tank (Stowers Containment Solutions, Christchurch, New Zealand) [870 mm (L) × 600 mm (W) × 295 mm (H)], an Aquis700 pump and filtration unit (Aqua One®, Nelson, New Zealand), a Hailea HC-150A refrigeration unit (Hailea, Guangdong, China) and a TUNZE™ pH/CO2 regulation unit (TUNZE™, Penzberg, Germany). The pH, measured on the total hydrogen ion scale, was adjusted with 100% CO2 gas and monitored potentiometrically with glass electrodes calibrated with saltwater buffers [2-amino-2-hydroxy-1,3-propanediol (Tris) and 2-aminopyridine (AMP)]. Temperature was actively controlled using the flow-through chiller unit, while total alkalinity (A T) and salinity were passively controlled by the regular replacement of unmodified seawater (20 L/48 h); light levels were also standardized across all culture tanks. Seawater in the three culture tanks was maintained at 12·5 °C, 32 salinity and at one of the three pH treatment levels: pH 7·4, 7·6 and 8·1. Each culture tank was also aerated with ambient air by an AquaOne 9500 aquarium bubbler (Aqua One®, Nelson, New Zealand), and oxygen saturation, measured daily with a YSI ProODO (YSI, Yellow Springs, OH, USA) was maintained at similar levels to those found in the habitat of Z. subcarinatus (approximately 98%, MacLeod, Reference MacLeod2015). We also validated the potentiometric regulation of pH by measuring AT and dissolved inorganic carbon (DIC) in seawater samples taken from each culture tank, and used that data to calculate pH with the software package SWCO2 (Hunter, Reference Hunter2007) (Table 1).
Table 1. Mean values (±s.d.) of all measured and calculated parameters used to characterize the carbonate chemistry of unmodified and acidified seawater

Note: pH was measured on the total hydrogen ion scale.
Temp., temperature; DIC, dissolved inorganic carbon; Ω, saturation state.
Experimental design
The combined effects of parasitic infection and exposure to acidified seawater on Z. subcarinatus individuals were investigated by exposing snails from four infection categories, i.e. uninfected snails and those infected with M. novaezealandensis, Philophthalmus sp. or Acanthoparyphium sp., to all pH treatments. In each pH treatment, approximately 30 snails from each infection category were distributed evenly between five nylon mesh chambers, i.e. 20 chambers and 120 snails per treatment, and the chambers submerged in unmodified or acidified seawater for a period of 90 days. To minimize the effects of abrupt changes in seawater pH, snails in the acidified treatments were gradually acclimated to reduced pH over a 2-week period. Average snail length was 14·223 ± 1·52 (s.d.) mm (max. 19·64 mm, min. 10·38 mm) and average wet weight was 0·233 ± 0·06 (s.d.) g (max. 0·503 g, min. 0·115 g). Preparatory analysis showed no significant differences in these parameters between groups (length – F 11,228 = 1·831, P = 0·205, weight – F 11,228 = 0·965, P = 0·479). Throughout the 90-day period, snails were provided with a constant supply of sea lettuce (Ulva spp.). To account for any unrecorded and unwanted variation in the performance of a particular culture tank and associated apparatus, i.e. tank effect, the pH assigned to each culture tank was changed at 30 and 60 days and snails transferred between tanks. Consequently, all snails experienced constant pH conditions and spent equal amounts of time in each culture tank. In addition to transferring snails between culture tanks, the position of each chamber was changed within each tank every four days, so that all chambers spent an equal period of time at each of the 20 positions available in the culture tanks. The periodic movement of snail chambers was carried out so that no snails spent an unequal amount of time in close proximity to the CO2 inflow point, although frequent testing of seawater pH did not identify any pH gradient in the culture tanks.
During the 90-day period, the oxygen consumption of 20 snails from each infection category in each pH treatment was measured three times at 4-week intervals, i.e. three separate trials of 240 snails. Oxygen trials were completed before snails were transferred between tanks. Consequently, oxygen consumption data represent an average value for each snail using data from all trials, thus compensating for a potential tank effect. At the end of the 90-day period, all snails were euthanized, parasite tissue was removed, and the remaining tissue was frozen (−80 °C) for glucose analysis.
Oxygen consumption
In each trial, the oxygen consumption of 20 snails was measured over 4 h, normalized for snail mass (g), and converted into the rate of oxygen consumed in micromoles per hour (μmO2 h−1 g−1). The snails were placed in individual plastic 50 mL screw-top containers which were then completely filled with acidified or unmodified seawater by fully submerging container and lid in the culture tank associated with each snail; the oxygen concentration of source water was also measured prior to filling containers. A blank container, i.e. one containing only acidified or unmodified seawater, was also used for each pH/infection category combination, i.e. 12 blank containers per trial. The containers were then closed, sealed with Parafilm, and fully submerged in the appropriate culture tank to maintain constant temperature. After 4 h, the oxygen content of seawater (±0·1 mg L−1) in each container was measured with an optical oxygen sensor (YSI-proODO), and the total oxygen consumed by each snail was calculated using the formula:
 $$\hskip-5pt{\rm Oxygen \;\;\;\;\; consumed} \;\;\;\; = \;\;\;\;({{\rm O}_{{\rm 2(i)}}} - {{\rm O}_{{\rm 2(b)}}}) - ({{\rm O}_{{\rm 2(i)}}} - {{\rm O}_{{\rm 2(s)}}})$$
where O2(i) is the initial oxygen concentration of the source water, O2(b) is the final oxygen concentration of seawater in the blank container and O2(s) is the final oxygen concentration of seawater in the containers that held snails. The oxygen concentration of the seawater in the blank container was used to account for changes to the oxygen content of source water caused by planktonic photosynthesis and/or respiration, which would also occur in containers holding snails. The oxygen concentration in the 50 mL containers did not fall below 85% during the 4 h trials, and we assumed that this minimal decrease in available oxygen would not alter the respiration rate of the snails.
Glucose concentration
The free glucose concentration of snail muscle tissue was measured in approximately 20 snails per infection category per pH treatment using a GAGO-20 colorimetric assay kit (Sigma-Aldrich, St. Louis, MO, USA). Assay reagents in this kit react with D-glucose to form a pink colour, the intensity of which is proportional to the concentration of D-glucose in a sample fluid. D-glucose is the most common monosaccharide in living organisms, and is integral to the glycolytic pathway of gastropods (Martínez-Quintana and Yepiz-Plascencia, Reference Martínez-Quintana and Yepiz-Plascencia2012). Free glucose was extracted from pre-weighed snail tissue (±0·001 g) by immersing the tissue in 500 µL of de-ionized water, heating to 60 °C for 1 h, and grinding to an opaque slurry with a small pestle. The snail solution was then centrifuged at 14 000 rpm for 5 min and 200 µL of clear supernatant removed and stored at −20 °C until assays were conducted.
For each assay, 40 µL of supernatant was mixed with 80 µL of assay reagent in one well of a 96-well plastic culture plate and incubated at 37 °C for 30 min. After 30 min, 80 µL of 12N sulphuric acid was added to each well to stop the colorimetric reaction. Duplicate assays were completed for each snail and used to calculate an average value of glucose concentration for each individual. As a precaution against sample loss or human error, samples from each infection category/pH combination were divided such that no entire group was processed in a single incubation.
The colour intensity of all samples was measured using a multi-mode Fluostar Omega microplate reader (BMG Labtech GMBH, Ortenberg, Germany), which exposed each well to 540 nm light and measured the absorbance of each sample. A single well filled with de-ionized water was included in each 96-well plate to provide a negative control, allowing the absorbance of de-ionized water to be subtracted from the absorbance of the samples. Per the protocol for the assay kit, each plate also contained a series of standard solutions of D-glucose: 5, 10, 20, 30 and 40 µg glucose mL−1. The absorbance readings for these standards were used to create an absorbance concentration curve that was then used, in conjunction with the initial weight of the tissue sample, to convert sample absorbance to micrograms of glucose per gram of snail tissue.
Statistical analysis
Oxygen consumption data were analysed using three different model structures. The first model analysed the combined oxygen data from all three trials with a linear mixed-effect structure, and used oxygen consumption as the response variable, pH, infection category and initial shell length as fixed effects, and ‘Snail ID’, ‘Chamber ID’ and ‘Trial’ as random effects. To further quantify the effect of infection, this model was also run with two modifications: data from all infected snails were pooled to compare only ‘infected’ vs ‘uninfected’ snails; and infection status was removed from the analysis, thus pooling data from all snails. The second model structure analysed each pH treatment (three groups) and infection category (four groups) separately, i.e. seven separate models each using a different subset of the overall data. This model type also had a linear mixed-effect structure and used oxygen consumption as the response variable, infection category/pH (depending on data subset) and initial shell length as fixed effects, and ‘Snail ID’, ‘Chamber ID’ and ‘Trial’ as random effects. These models were used to identify significant differences within the ‘infection category’ and ‘pH’ groups (Fig. 1 and Supplementary Material Tables S2 and S3). The third model used a linear structure to analyse the consumption of oxygen in each trial separately, with oxygen consumption as a response variable, and pH and initial shell length as fixed effects (Supplementary Material Table S4).

Fig. 1. Mean oxygen consumption rates (±s.e.m.) of snails exposed to acidified and unmodified seawater for 90 days: (A) data grouped by pH treatment and (B) data grouped by infection category. Lowercase letters in bold indicate significant differences between infection categories within pH treatments (A), and between pH treatments within infection categories (B). n = 20 in each pH/infection category combination.
Glucose concentration was analysed using two linear mixed-effect models. The first provided an overall analysis, using glucose concentration as the response variable, pH, infection category, and initial shell length as fixed effects, and ‘Chamber ID’ as a random effect. As with the oxygen analysis, this model was also run with two modifications: data from all infected snails were pooled to compare only ‘infected’ vs ‘uninfected’ snails; and infection status was removed from the analysis, thus pooling data from all snails. The second model analysed each pH treatment (three groups) and infection category separately (four groups), i.e. seven separate models each using a different subset of the overall data. This model type also had a linear mixed-effect structure and used glucose concentration as the response variable, infection category/pH (depending on data subset) and initial shell length as fixed effects, and ‘Chamber ID’ as a random effect. As with oxygen consumption data, these models were used to identify significant differences in glucose concentration within the ‘infection category’ and ‘pH’ groups (Fig. 2 and Supplementary Material Tables S5 and S6).

Fig. 2. Mean tissue glucose concentration (±s.e.m.) of snails exposed to acidified and unmodified seawater for 90 days: (A) data grouped by pH treatment and (B) data grouped by infection category. Lowercase letters in bold indicate significant differences between infection categories within pH treatments (A), and between pH treatments within infection categories (B). Sample sizes: uninfected, 8·1 pH = 14, 7·6 pH = 18, 7·4 pH = 20; Philophthalmus sp., 8·1 pH = 18, 7·6 pH = 19, 7·4 pH = 18; M. novaezealandensis, 8·1 pH = 19, 7·6 pH = 17, 7·4 pH = 13; Acanthoparyphium sp., 8·1 pH = 18, 7·6 pH = 20, 7·4 pH = 18.
The random effects ‘Snail ID’ and ‘Trial’ were used in the oxygen data analysis to compensate for repeated measurements of each snail and for pooling data from each trial, respectively. The random effect ‘Chamber ID’ was used in both oxygen and glucose trials to quantify the repeatability of measurements of groups of snails maintained in the same tank. Repeatability can be estimated by calculating the intra-class correlation (ICC) between groups, in this case snails within a particular chamber, by finding the per cent variance attributed to the grouping factor (Chamber ID). An ICC score of 0% indicates no repeatability of measurements between groups and a score of 100% indicates identical measurements, i.e. pseudoreplication. Calculating ICC scores allowed us to assess the independence, or lack thereof, of data points taken from multiple chambers:
 $${\rm ICC}\; =\; \left( {\displaystyle{{\left( {{\rm between} - {\rm chamber\; variance}} \right)} \over \matrix {\left( {{\rm between} - {\rm chamber\; variance}} \right) \, + \left( {{\rm within} - {\rm chamber\; variance}} \right)}}} \right) \times 100$$
An a posteriori correlation analysis was also conducted on oxygen consumption rates and tissue glucose concentration, after it became clear that there was a weak negative relationship between these parameters. This relationship was analysed using a simple linear model that used end point oxygen data and glucose data.
In all analyses, model selection was performed using comparative AIC values and manual simplification of model parameters. Where necessary, oxygen consumption data was normalized using the powerTransform function in the package car (Fox et al. Reference Fox, Weisburg, Adler, Bates, Baud-Bovy, Ellison, Firth, Friendly, Gorjanc, Graves, Heiburger, Laboissiere, Monette, Murdoch, Nilsson, Ripley, Venables and Zeileis2014). All models used for oxygen and glucose analysis were designed using the function lmer in the package lme4 (Bates et al. Reference Bates, Maechler, Bolker and Walker2014) using R version 3.1·0 (R Development Core Team, 2014). Fixed effects were considered significant if P values were less than or equal to 0·05.
RESULTS
Oxygen consumption
The oxygen consumption of Z. subcarinatus was significantly affected by pH, initial shell length and the interaction of infection category with both pH and initial shell length, but not by infection category alone (Table 2). Both modifications of the overall analysis, i.e. pooling infected snails and pooling all snails, found similar results (Supplementary Material Table S7). Despite the non-significant effect of infection category in the overall analysis, the individual analysis of each pH treatment and infection category found significant differences in oxygen consumption rates in both data subsets (Fig. 1). At 8·1 pH, the rate of oxygen consumption was higher in infected snails relative to uninfected individuals, although these differences were only significant in snails infected with Acanthoparyphium sp. and Philophthalmus sp. This trend was reversed in the 7·6 pH treatment, where uninfected snails consumed more oxygen per hour than all infected categories. In the same treatment, the oxygen consumption rate of M. novaezealandensis-infected snails was significantly lower than uninfected and Philophthalmus sp.-infected snails. The relative oxygen consumption rates of infection categories changed again in the 7·4 pH treatment, where there was no statistical difference between uninfected and Philophthalmus sp.-infected snails, while Acanthoparyphium sp.- and M. novaezealandensis-infected snails consumed oxygen at a significantly higher rate than the other two groups. Snails in all infection categories exhibited higher rates of oxygen consumption at 7·6 pH relative to 8·1 pH, and these differences were significant for all infection categories except Philophthalmus sp.-infected snails (Fig. 1B). At 7·4 pH, oxygen consumption rates were more varied relative to the 7·6 pH treatment: uninfected and Philophthalmus sp.-infected snails exhibited significantly reduced consumption rates, M. novaezealandensis-infected snails showed significantly increased consumption rates, and Acanthoparyphium sp.-infected snails showed no difference between the two pH treatments. These observations were supported by the overall analysis which found that pH significantly altered rates of oxygen consumption (Table 2), although only one out of three trials found a significant effect of pH on the oxygen consumption rate of Acanthoparyphium sp.-infected snails (Supplementary Material Table S4).
Table 2. Output for the linear mixed-effect analysis of oxygen consumption rates in snails maintained for 90 days in acidified or unmodified seawater (n = 240). ‘Length’ represents the length of snail shells at the beginning of the 90-day trial. Significant P-values are shown in bold

IC, infection category.
ICC scores generated by the random effect ‘Chamber ID’ showed that the repeatability of oxygen consumption data was 11% overall and between 5 and 22% in the data subsets (Supplementary Material Table S8), indicating that repeatability was low and pseudoreplication not a confounding factor in these data.
Initial shell length, the variable used as a proxy for age, significantly affected oxygen consumption rates in the overall analysis (Table 2). However, in the individual analysis of each infection category, we see that initial shell length was only a significant factor for M. novaezealandensis- and Acanthoparyphium sp.-infected snails (Table 3). Subsequent analysis of the relationship between shell length/age and oxygen consumption showed that infected snails exhibited a negative correlation between length and oxygen consumption (average R 2 value, 0·16), while uninfected snails exhibited a positive correlation (average R 2 value, 0·01).
Table 3. Output for the linear mixed-effect analysis of oxygen consumption rates in each infection category and pH treatment (n = 240). ‘Length’ represents the length of snail shells at the beginning of the 90-day trial. Significant P-values are shown in bold
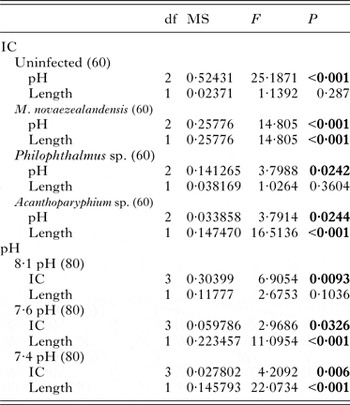
IC, infection category.
Free glucose concentration
The free glucose concentration in Z. subcarinatus tissue was significantly affected by pH, infection category, and the interaction of these variables (Table 4), although the response of each infection category to acidified seawater was quite different (Fig. 2B). Modifications of the overall analysis found that pooling all infected snails also showed a significant effect of infection status, i.e. infected vs uninfected, while pooling all snails regardless of infection category removed the significant effect of pH (Supplementary Material Table S9). The individual analysis of each infection category showed that the glucose concentration of Philophthalmus sp.-infected snails was not significantly affected by pH, but was significantly affected by initial shell length (Table 5). Within infection categories, uninfected and Acanthoparyphium sp.-infected snails exhibited significantly lower glucose concentrations in the 7·6 pH treatment relative to the control (8·1 pH) treatment, while Philophthalmus sp.- and M. novaezealandensis-infected snails showed no statistical differences between the two treatments. Uninfected, Acanthoparyphium sp.-infected and Philophthalmus sp.-infected snails exhibited higher glucose concentrations at 7·4 pH relative to the 7·6 pH treatment, although relative to the control (8·1 pH) treatment, glucose concentrations were higher (Philophthalmus sp.), lower (Acanthoparyphium sp.) or not significantly different (uninfected). Snails infected with M. novaezealandensis exhibited significantly lower glucose concentrations at 7·4 pH relative to 8·1 and 7·6 pH treatments. There were significant differences in free glucose concentration between infection categories in all pH treatments (Fig. 2A): at 8·1 pH, Acanthoparyphium sp.-infected snails exhibited significantly higher glucose concentrations than M. novaezealandensis-infected snails, and both infection categories exhibited significantly higher glucose concentrations than uninfected and Philophthalmus sp.-infected snails; at 7·6 pH, all infected snails exhibited significantly higher glucose concentrations than uninfected snails, and M. novaezealandensis-infected snails exhibited significantly higher glucose concentrations than Acanthoparyphium sp.-infected snails; and at 7·4 pH, Philophthalmus sp.-infected snails exhibited significantly higher glucose concentrations than uninfected and M. novaezealandensis-infected snails, and uninfected and Acanthoparyphium sp.-infected snails exhibited significantly higher glucose concentrations than M. novaezealandensis-infected snails. ICC scores generated by the random effect ‘Chamber ID’ showed that the repeatability of glucose data was 13% overall and between 1 and 13% in the data subsets (Supplementary Material Table S8), indicating that repeatability was low and pseudoreplication not a confounding factor in these data. The linear model used to analyse the relationship between oxygen consumption rates recorded in the final trial and tissue glucose concentration showed that there was a weak but significant negative relationship (t = 4·003, P < 0·001, R 2 = 0·10), i.e. as oxygen consumption increased, tissue glucose concentration decreased.
Table 4. Output for the linear mixed-effect analysis of tissue glucose concentration in snails maintained for 90 days in acidified or unmodified seawater (n = 214). ‘Length’ represents the length of snail shells at the beginning of the 90-day trial. Significant P-values are shown in bold
IC, infection category.
Table 5. Output for the linear mixed-effect analysis of tissue glucose concentration of snails in each infection category and pH treatment. Sample sizes for each data subset are given in parentheses. ‘Length’ represents the length of snail shells at the beginning of the 90-day trial. Significant P-values are shown in bold

IC, infection category.
DISCUSSION
The goal of this study was to assess changes to the metabolic status of the mud snail Z. subcarinatus caused by the combined stressors of OA and parasitic infection. The metabolic status of Z. subcarinatus was quantified by recording oxygen consumption rates and tissue glucose content during a 90-day exposure to unmodified (8·1 pH) or acidified (7·6 and 7·4 pH) seawater. In light of the negative correlation found between endpoint oxygen consumption rates and tissue glucose content, exposure to 7·6 pH seawater appeared to increase the metabolic demands experienced by both uninfected and infected individuals, although the relationship between these parameters was less clear in infected snails. Upon exposure to 7·4 pH seawater, uninfected snails exhibited a decrease in oxygen consumption rates relative to the 7·6 pH treatment, while the response of infected individuals was again less clear and also exhibited a high degree of variability depending on the species of infecting parasite. These results suggest that Z. subcarinatus will be negatively affected by the reductions in seawater pH predicted to occur over the next 100–300 years (IPCC, 2014), and that the species of infecting parasite will modify this effect. Given the high degree of variability found in the oxygen consumption rates and tissue glucose content of snails infected with different species of parasite, we will first discuss the effects of acidified seawater on these parameters in uninfected snails and then address the modifications to this response caused by trematode infection.
Relative to snails maintained in control (8·1 pH) conditions, individuals exposed to 7·6 pH seawater exhibited significantly increased oxygen consumption rates and decreased tissue glucose content. These results suggest that Z. subcarinatus experiences higher metabolic costs at 7·6 pH due to the increased ionoregulatory activity required to maintain acid–base homeostasis and the biomineralization of calcified structures. As Z. subcarinatus snails are occasionally exposed to 7·6 pH seawater in their habitat (MacLeod, Reference MacLeod2015), it is unsurprising that this species can tolerate this degree of acidification, albeit at a metabolic cost. The ability of Z. subcarinatus to tolerate exposure to these conditions is also supported by the positive shell growth of individuals maintained in 7·6 pH seawater (MacLeod and Poulin, Reference MacLeod and Poulin2015).
Zeacumantus subcarinatus is not exposed to seawater pH as low as 7·4 in its habitat, and we predicted that this degree of acidification would cause the snails to enter a state of metabolic depression, as has been found in other species of marine gastropod (Ellis et al. Reference Ellis, Bersey, Rundle, Hall-Spencer and Spicer2009; Kimura et al. Reference Kimura, Takami, Ono, Onitsuka and Nojiri2011; Melatunan et al. Reference Melatunan, Calosi, Rundle, Moody and Widdicombe2011; Zhang et al. Reference Zhang, Cheung and Shin2014). While the oxygen consumption rates of uninfected snails in the 7·4 pH treatment did decrease relative to those exposed to 7·6 pH seawater, they did not fall below the consumption rates of snails maintained in control (8·1 pH) conditions indicating that the snail did not experience metabolic depression. Similarly, tissue glucose concentration of snails in the 7·4 pH treatment increased relative to those exposed to 7·6 pH seawater, but did not differ significantly from snails maintained at 8·1 pH. These results indicate that Z. subcarinatus is somewhat tolerant of 7·4 pH conditions. However, it is logical that Z. subcarinatus would experience some metabolic stress in the more acidic seawater, which suggests that an unknown factor or factors are modifying the metabolic processes of the snails in these conditions. As described above, uninfected snails in the 7·4 pH treatment consume more oxygen relative to those in control (8·1 pH) conditions, but have higher tissue glucose content. Glucose levels in marine gastropods can be altered by a number of factors, such as the quantity and quality of food, stress hormones, hibernation and starvation (Hochachka, Reference Hochachka1983; Lacoste et al. Reference Lacoste, Jalabert, Malham, Cueff and Poulet2001). Consequently, it is possible that the stress experienced by the snails in the 7·4 pH treatment caused glucose to be released while simultaneously depressing oxygen consumption rates. We must also consider that, despite an acclimation period, the snails in acidified treatments may have been exposed to environmental conditions out with the range found in their natural habitat.
In addition to their own metabolic requirements, infected snails must also supply parasites with sufficient energy to grow and reproduce, leading to a de facto increase in the total energetic costs experienced by infected snails. Figure 1A shows that in control (8·1 pH) conditions, the oxygen consumption rates of snails infected with all species of parasite are indeed greater than the consumption rates of uninfected snails, although this increase is only significant in snails infected with either Acanthoparyphium sp. or Philophthalmus sp. The tissue glucose content of infected snails, however, does not change as we would expect, i.e. reduced tissue glucose content correlates with increased rates of oxygen consumption.
At 8·1 pH, infected snails exhibit increased tissue glucose concentrations relative to uninfected individuals, although, again, this difference is only significant for two of the three infecting parasite species. The lack of correlation between oxygen and glucose in infected individuals is the first indication in these data that parasitic infection alters the concentration of free glucose independently of oxygen consumption rates. At 7·6 pH, snails infected with M. novaezealandensis exhibit significantly lower oxygen consumption rates and significantly higher tissue glucose content relative to uninfected individuals, re-establishing the negative relationship between these parameters for this species of parasite. The data on Acanthoparyphium sp.- and Philophthalmus sp.-infected snails, however, confirm the disconnect between oxygen and glucose, as their rates of oxygen consumption are similar to uninfected individuals while their glucose levels are significantly higher.
There are many aspects of the host–parasite association that may explain the observed differences between the oxygen consumption and tissue glucose levels of infected and uninfected snails, and between snails infected with different species of parasite. In this paper, we limit discussion to two mechanisms which may explain the observed changes in oxygen consumption and tissue glucose concentration, the effects of parasitic castration and the oxygen uptake and nutrient absorbing capacity of the trematode life stages found within first intermediate gastropod hosts (rediae and sporocysts).
The energy requirements of gastropods are radically altered by trematode infection. Not only does infection withdraw energy from the host organism to meet the metabolic demands of parasite growth and reproduction, but also partially or completely castrates the host, dramatically reducing the energy required by the host for reproduction. This can cause an energy imbalance in which the host generates more metabolic energy than is required by the parasite, and in some cases this results in increased somatic growth rates of infected snails (Hay et al. Reference Hay, Fredensborg and Poulin2005). However, as parasite energetics are likely to be species-specific, the energy available to host organisms may vary between individuals infected with different species of parasite. This variability in the energy available to host organisms may explain the differences in oxygen consumption and glucose concentration we observed between groups of snails infected with different species of parasite. As all parasite species used in this experiment completely sterilize host snails, differences in the metabolic status of snails infected with different species of trematode, but maintained at the same pH, may be solely due to species-specific energy requirements of the infecting parasite.
Rediae and sporocysts asexually produce cercariae, a free-swimming life stage of trematode parasites, within the reproductive organs of the first intermediate gastropod host. Despite their similar function, sporocysts and rediae are morphologically distinct: sporocysts have a simple sac-like structure, while rediae have a primitive gut, a muscular pharynx and an oral sucker (Galaktionov and Dobrovolskij, Reference Galaktionov and Dobrovolskij2003). Both reproductive morphs have the ability to regulate oxygen (Vernberg, Reference Vernberg1963; Popiel and James, Reference Popiel and James1976) and nutrient consumption rates (Richards, Reference Richards1970; Richards et al. Reference Richards, Pascoe and James1972) in response to changing environmental conditions, and absorb exogenous nutrients, such as glucose, through microvilli on their external surface (McDaniel and Dixon, Reference McDaniel and Dixon1967; Pojmanska and Machaj, Reference Pojmanska and Machaj1991); rediae also use their muscular pharynx to actively consume host tissue (Cheng, Reference Cheng1963). Rediae and sporocysts are also capable of increasing the concentration of free glucose in host tissue by releasing a digestive enzyme that breaks down host glycogen stores into glucose (Cheng, Reference Cheng1963) or by inducing the host to break down its own glycogen (Cheng and Snyder, Reference Cheng and Snyder1963). The rediae and sporocysts of many trematode species are also facultative anaerobes, meaning they can switch between aerobic and anaerobic respiration in response to the changing internal conditions of their host (Van Hellemond et al. Reference Van Hellemond, Van Remoortere and Tielens1997).
Clearly, the oxygen absorbed by sporocysts and rediae will not be available to host snails, causing a compensatory increase in oxygen consumption by infected individuals. This is the most likely explanation for the higher oxygen consumption rates of infected snails maintained at 8·1 pH. In addition, at 8·1 and 7·6 pH, snails infected with rediae-producing parasites (Philophthalmus sp. and Acanthoparyphium sp.) exhibit increased rates of oxygen consumption relative to snails infected with sporocyst-producing parasites (M. novaezealandensis). The higher oxygen consumption rates of Acanthoparyphium sp.- and Philophthalmus sp.-infected snails could indicate that rediae have greater oxygen requirements than sporocysts, as the former are more active. Alternatively, increased oxygen consumption could be the metabolic cost of tissue repair in snails infected with rediae-producing parasites, due to the destructive feeding strategy of this reproductive morph.
As both rediae and sporocysts can directly or indirectly increase the concentration of glucose in host tissue, and regulate the rate at which they absorb nutrients from the host, the observed deviation from the negative relationship between oxygen and glucose in infected snails may be caused by parasite-induced breakdown of glycogen and/or species-specific nutrient requirements. If parasite-induced glycogen breakdown occurs at a greater rate than glucose consumption, the resultant nutrient accumulation could explain the elevated glucose levels recorded in infected snails.
Concluding remarks
The data presented here support our prediction that parasitic infection may alter the effects of OA on marine organisms. By incorporating multiple parasite species into this study, we have also shown that the species-specific effects of the infecting parasite can be pronounced and alter the apparent tolerance of host organisms to an acidified environment. The integration of parasitology into the physiological assessment of marine organisms exposed to simulated OA conditions is urgently required. A failure to do so may lead to the incorrect identification of some marine species as tolerant or susceptible to acidified seawater, when in fact the physiological response of the organism is modified by parasitic infection. This concern is supported by our analysis of the glucose dataset, which showed that when the infection status of the snails was excluded from the analysis, the significant effect of pH was no longer found. In the context of OA, predictions on the future states of marine ecosystems rely on data describing the relative tolerance of sympatric marine species to acidified seawater; these predictions will be misleading if parasitic infection is not taken into consideration.
SUPPLEMENTARY MATERIAL
The supplementary material for this article can be found at http://dx.doi.org/10.1017/S0031182016000913.
ACKNOWLEDGEMENTS
The authors would like to thank Matthew Downes and Tony Stumbo for technical assistance with the analysis of tissue glucose and two anonymous reviewers for comments on an earlier draft of this manuscript.
FINANCIAL SUPPORT
This research was supported by a University of Otago Doctoral Scholarship (to C.M.), funding from the Department of Zoology, University of Otago, New Zealand (to C.M. and R.P.) and the Royal Society of New Zealand Hutton Fund (to C.M.).


