


1. Introduction
A majority of the rural population in developing countries depends on agriculture for its livelihood. When agriculture is rain-fed, weather shocks like drought can severely damage output and productivity (Mendelsohn et al., Reference Mendelsohn, Nordhaus and Shaw1994; Hanna and Oliva, Reference Hanna and Oliva2016). Incomplete insurance and credit markets make agriculture-dependent households even more vulnerable to weather shocks. Moreover, weather risk is spatially co-variant: local and informal insurance is unavailable when a majority of households are affected (Rosenzweig and Binswanger, Reference Rosenzweig and Binswanger1993; Townsend, Reference Townsend1994). Drought can affect children through both direct and indirect channels such as declining agricultural incomes and wages, poorer nutrition due to income loss and rising prices, and declining health due to harsh weather conditions. Unable to smooth consumption, drought-affected households may be forced to reduce investment in the education and health of their children.
In India, the states of Rajasthan, Andhra Pradesh, Maharashtra, and Karnataka are considered drought-prone. According to the Manual for Drought Management (Government of India, 2016), Maharashtra ranks third in terms of frequency of droughts (since 2000), but has the least irrigated area. It has been suffering from agrarian distress since the past decade and is notorious for having the highest number of farmer suicides (Mishra, Reference Mishra2006). In 2012, Maharashtra experienced a severe drought shock (Udmale et al., Reference Udmale, Ichikawa, Kiem and Panda2014a). Rainfall was deficient by 36 per cent compared to the long-term mean (figure 1). The standardized precipitation index (SPI) was lower than − 1 in nearly half of the state's districts, indicating moderate to extremely dry conditions (figure 2).Footnote 1 Although Maharashtra frequently experiences deficient rainfall of varying intensity, 2012's drought was the worst in the state since 1972 (The Economic Times, 2013). It resulted in damages to agriculture, water resources, food security and rural livelihood in the affected areas (Udmale et al., Reference Udmale, Ichikawa, Kiem and Panda2014a,et al., Reference Udmale, Ichikawa, Manandhar, Ishidaira and Kiemb, Reference Udmale, Ichikawa, Nakamura, Shaowei, Ishidaira and Kazama2016).
Figure 1. Rainfall deviation from long-term mean in Maharashtra, 2000–2016 (in %).
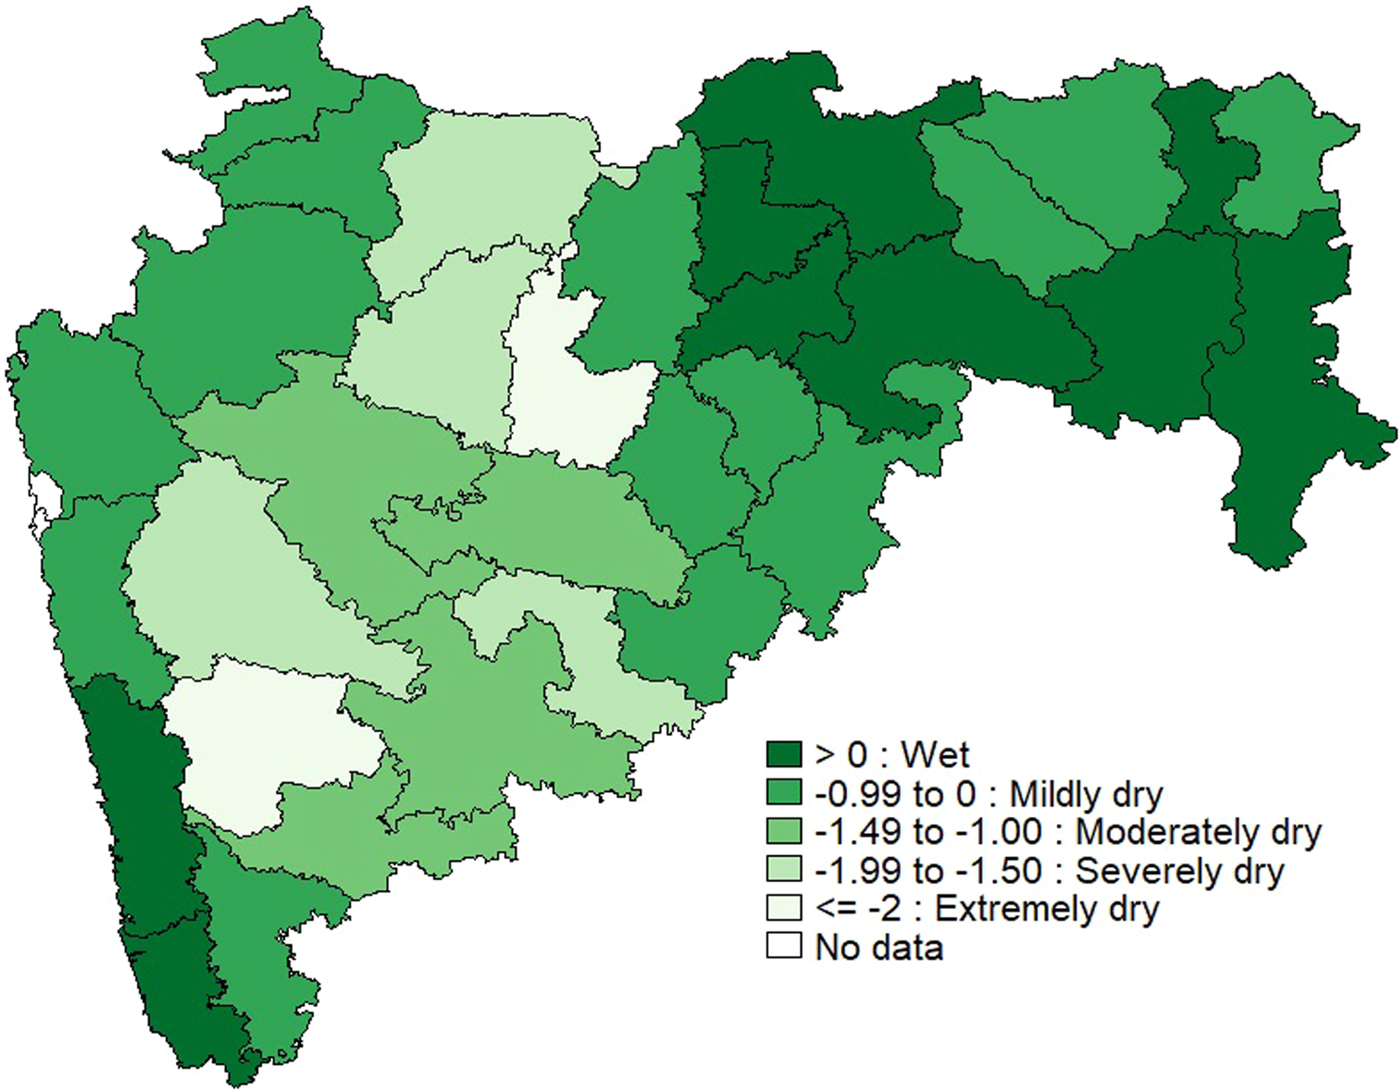
Figure 2. Standardized Precipitation Index (SPI) in districts of Maharashtra in 2012.
We study the impact of the 2012 drought on children's education in rural Maharashtra. In theory, the effect of weather shocks on education is a priori undetermined and depends on the underlying channels. While a drought-induced decline in income can lead to reduced investments in education (income effect), a decline in wages also lowers the opportunity cost of education (substitution effect). The net impact of drought depends on whether the income or the substitution effect dominates. It is thus of empirical interest. We exploit the quasi-experimental nature of the 2012 drought wherein only a subset of districts were affected. Using a difference-in-differences methodology, we find that the 2012 drought had an adverse impact on education. In previous work, education has primarily been measured by enrollment and thus corresponds to the quantity of schooling. We use test scores which measure learning, or the quality of schooling. We find that the 2012 drought caused a decline of 4.14 per cent in math scores and 2.67 per cent in reading scores of affected children.
Our paper contributes to the growing body of research on the impact of weather shocks on human capital.Footnote 2 While several studies find negative health consequences of weather shocks (Maccini and Yang, Reference Maccini and Yang2009; Bonjean et al., Reference Bonjean, Brunelin and Simonet2012; Skoufias and Vinha, Reference Skoufias and Vinha2012; Lohmann and Lechtenfeld, Reference Lohmann and Lechtenfeld2015), the evidence on the impact of weather shocks on education is mixed. It depends on the underlying channels through which drought affects education. Jacoby and Skoufias (Reference Jacoby and Skoufias1997), Jensen (Reference Jensen2000), Baez and Santos (Reference Baez, De la Fuente and Santos2007), Björkman-Nyqvist (Reference Björkman-Nyqvist2013), Deuchert and Felfe (Reference Deuchert and Felfe2015) and Groppo and Kraehnert (Reference Groppo and Kraehnert2017) find that weather shocks adversely affect schooling via an income effect. In contrast, Duryea and Arends-Kuenning (Reference Duryea and Arends-Kuenning2003), Kruger (Reference Kruger2007) and Shah and Steinberg (Reference Shah and Steinberg2017) find evidence in support of a substitution effect.
Most relevantly, for India, Shah and Steinberg (Reference Shah and Steinberg2017) show that a fall in wages during deficit rainfall years lowers the opportunity cost of schooling, resulting in improved test scores of affected children. Our paper differs from theirs in the following ways. First, while Shah and Steinberg (Reference Shah and Steinberg2017) focus on year-to-year rainfall variation in districts of India, we study the impact of one particularly severe drought shock in 2012. Second, we focus on a more relevant sub-sample, Maharashtra, which is the most drought-prone state in India (Udmale et al., Reference Udmale, Ichikawa, Kiem and Panda2014a). In 2012, the average SPI in the state was − 0.51 compared to 0.39 in Rajasthan and 0.36 in Andhra Pradesh (two of the most drought-prone states in India). Since drought adaptation and mitigation policies are made at the state level in India, our analysis is also relevant from a policy perspective. Third, Shah and Steinberg (Reference Shah and Steinberg2017) use data from the Annual Status of Education Report (ASER) 2005 to 2009. We extend the ASER sample from 2007 to 2016. Fourth, households' response to yearly rainfall fluctuations can be different from their response to a more severe drought shock. We hypothesize that the drought in 2012 affected education over and above yearly rainfall fluctuations in Maharashtra. Thus, in our empirical model, we control for the effect of district-year rainfall deviations from long-term mean (as do Shah and Steinberg (Reference Shah and Steinberg2017)). We then additionally identify the impact of the 2012 drought via the difference-in-differences in test scores of children who were affected by it and children who were not affected by it. Finally, in severely drought-affected areas, wages could fall such that households are unable to smooth consumption. In other words, the income effect could dominate the substitution effect. Our results support this hypothesis: the 2012 drought led to a fall in test scores of affected children in Maharashtra.
We study heterogeneity by gender, age, parents' schooling, and household wealth to further deconstruct the impact of the 2012 drought. Girls' test scores are more severely affected than boys' in 2012–2013, but this gender difference fades in the short term (2014–2016). There is no heterogeneity in the impact by age: younger and older children are similarly affected by the drought. Parents' schooling partially offsets the negative impact of drought, implying that children from lower socio-economic strata are more likely to be affected than those from higher socio-economic strata. However, household wealth does not help to buffer the impact, indicating the severity of the drought.
Given the importance of education in eradicating poverty in rural India, weather shocks could force households into poverty traps (Alderman et al., Reference Alderman, Hoddinott and Kinsey2006; Udry, Reference Udry, Banerjee, Benabou and Mookherjee2006). There is evidence to suggest that affected children can be lacking in educational attainment long after a drought shock has passed (Maccini and Yang, Reference Maccini and Yang2009; Groppo and Kraehnert, Reference Groppo and Kraehnert2017). Identifying those who are affected by drought in rural India is necessary for efficient targeting of adaptation and mitigation policy. Children are largely ignored by such policy, even though they are increasingly at risk as extreme weather events become more frequent. Our paper highlights the need for more comprehensive drought policy that addresses the welfare of future human capital.
2. Background: drought and education in Maharashtra
Maharashtra is the second largest state in India and is situated in the central-western part of the country. It has 36 districts and a long tradition of planning policies at the district level. Agriculture accounts for 12.5 per cent of the state's GDP. It has a larger role in the state's economy, with over 55 per cent of the population engaged in agriculture. The percentage is even higher in rural areas where the main source of livelihood is agriculture and allied activities.Footnote 3 The principal crops grown in Maharashtra are cereals (rice, wheat, jowar, bajra), pulses, sugarcane, cotton and oilseeds. There are different climatic regions in the state: the western/coastal side has a tropical climate and heavy rainfall during monsoon, while the central parts are drier and receive lower rainfall.
Agriculture is rain-fed, with irrigation covering only 17 per cent of the gross cropped area. In recent years, the state has made efforts to extend irrigation and provide crop insurance to farmers, but the coverage of these policies remains scanty. In 2012, low rainfall and high temperature resulted in a fall in overall agricultural production. It was the worst drought in Maharashtra in 40 years. The then agriculture minister claimed that it was worse than the drought of 1972, which is known in the country's history as a disastrous famine (The Economic Times, 2013; Udmale et al., Reference Udmale, Ichikawa, Kiem and Panda2014a). Farmers were adversely affected during both the kharif (summer-monsoon) and rabi (winter) cropping seasons due to water shortages. The Economic Survey of Maharashtra (Government of Maharashtra, 2012) estimated a fall in production of almost all crops grown in the state (table 1).
Table 1. Agricultural production in Maharashtra (in thousand metric tonnes)
Source: Economic Survey of Maharashtra Government of Maharashtra (2012).
Note: Cotton production is given in 1000 bales of 170 Kg each. Figures for sugarcane are in terms of harvested area instead of production.
Public education in Maharashtra is free and compulsory for children 6–14 years old. This covers primary and secondary school but not senior secondary school.Footnote 4 In 2012, there were 1,02,054 primary and secondary schools and only 23,449 senior secondary schools. The primary school enrollment rate is approximately 100 per cent but secondary school enrollment falls to less than half of this. Similarly, while the gender gap in enrollment is lower than 6 per cent in primary schools, it is higher than 15 per cent in secondary and senior secondary schools. The state is implementing policies like the Mid Day Meal scheme, conditional cash transfer programs, and free education for minority castes to improve school attendance and enrollment. However, child labor is still common in both urban and rural areas. According to the 2011 Census of India, there are 727,932 children working in Maharashtra, and 58 per cent of them are working in agriculture and cultivation. Wages from child labor are the main opportunity cost of schooling (Udry, Reference Udry, Banerjee, Benabou and Mookherjee2006). Even in the case of simultaneous labor and schooling, a child suffers from reduced capacity to learn and perform in school.
3. Theoretical framework: the effect of drought on education
The effect of drought on education is ambiguous and depends on the underlying channels (Jensen, Reference Jensen2000; Baez and Santos, Reference Baez, De la Fuente and Santos2007; Ferreira and Schady, Reference Ferreira and Schady2009; Baez et al., Reference Baez and Santos2010). The primary effect of a drought shock is a decline in agricultural output and productivity. It may also adversely affect the health and mortality of individuals. In the absence of formal credit and insurance markets, rural households are unable to smooth consumption when faced with adverse income shocks (Paxson, Reference Paxson1993; Rose, Reference Rose1999). If markets were complete, parents could borrow to finance investment, and transitory income shocks would not affect education. Missing markets induce a change in human capital investment (Fitzsimons, Reference Fitzsimons2007). When a majority of households are affected by drought, even local/informal insurance ceases to be available (Rosenzweig and Binswanger, Reference Rosenzweig and Binswanger1993; Townsend, Reference Townsend1994). In this paper, following Skoufias (Reference Skoufias2001) and Baez and Santos (Reference Baez, De la Fuente and Santos2007), we model drought as an aggregate shock which affects a majority of households within districts. The theoretical model is described in detail in the online appendix.
The effect of drought on investment in children's education, and consequently on the children's educational outcomes, operates through income and wages. When agricultural income declines, the household faces a tradeoff between current consumption and future earnings of the child (Udry, Reference Udry, Banerjee, Benabou and Mookherjee2006). Loss of crops, decline in productivity, and disruption of schooling and health facilities, reduces the income and time available for investment in children. Since public education is subsidized in India, a decrease in educational investment comes from decreased investment in study materials, school transportation, uniforms, parent's time dedicated to the child's learning, and child's time dedicated to learning. Additionally, health and nutrition investments may also decline, negatively affecting a child's learning ability and cognitive skills. Children may also stop going to school to work in household-owned farms or take up other part-time work. This decline in education due to a decline in income is the income effect of drought.
The income effect is based on the underlying idea that increases in household income lead to increases in educational investment. However, this does not necessarily imply that increases in wages lead to increases in educational investment (Udry, Reference Udry, Banerjee, Benabou and Mookherjee2006). When an increase in household income comes primarily from wages, a substitution effect is also at play. Higher wages reflect a higher opportunity cost of schooling and are associated with lower schooling rates (Psacharopoulos, Reference Psacharopoulos1997). A drought shock causes a slowdown in the economy that results in inflation and lower wages. The opportunity cost associated with schooling falls, encouraging children to stay in schools, leading to improved learning outcomes compared to a situation of good rainfall (Shah and Steinberg, Reference Shah and Steinberg2017). This is the pro-schooling substitution effect of a drought shock (Ferreira and Schady, Reference Ferreira and Schady2009).
The overall impact of drought on education is thus determined by whether the income or the substitution effect dominates.
4. Data and descriptive statistics
4.1. Education data
The Annual Status of Education Report (ASER) is a survey of children's educational attainment in rural India. It has been conducted annually (since 2005) by the NGO Pratham, covering all rural districts with over 15,000 villages, 300,000 households and 700,000 children in a given year.Footnote 5 It is a cross sectional dataset, representative at the district level. Information on school enrollment, household size, parents' schooling, and household assets is collected for all children in the age group of 3–16.Footnote 6 In addition, 5–16 year-old children are administered standardized tests on basic reading and basic mathematics (in their native language). ASER is a household-based rather than a school-based survey, which allows all children to be included, regardless of whether they are currently enrolled in school or not.Footnote 7 This minimizes sample selection bias. For instance, children might drop out of school due to a drought shock, and this would have biased the analysis of drought on enrolled children.
We use Maharashtra ASER data from the 2007, 2008, 2009, 2010, 2011, 2012, 2013, 2014, and 2016 rounds.Footnote 8 Reading and math scores are coded on a scale of 1 to 5 where 1 means that the child cannot read anything/cannot do any math. The reading score progresses as follows: it is 2 if the child can read letters, 3 if the child can read words, 4 if the child can read a standard 1 level text, and 5 if the child can read a standard 2 level text. Similarly, the math score is 2 if the child can recognize numbers from 0–9, 3 if the child can recognize numbers from 11–99, 4 if the child can do subtraction, and 5 if the child can do division. Reading score and math score are the main outcome variables in our analysis. Figure 3 shows the average reading and math scores of children in Maharashtra from 2007 to 2016. There is a fall in both reading and math scores after 2011.

Figure 3. Average reading and math scores of children aged 5–16 years in Maharashtra, 2007–2016.
Descriptive statistics of the ASER variables used in our analysis are given in table 2. Our final sample consists of 226,965 children aged 5–16 years. We use principle components analysis to create a standardized household wealth index using information on household use of electricity, television, mobile, and the household construction type.Footnote 9 Information on household wealth index is missing in the 2007 round. Father's schooling is missing in the 2007 and 2008 rounds.
Table 2. Descriptive statistics of Maharashtra ASER data from 2007 to 2016
Note: ‘Reading score’, ‘Math score’, and ‘Total test score’ are continuous variables. ‘Child's age’ is measured in years and ‘Household wealth index’ is a standardized variable. ‘Child's gender’, ‘Enrolled’, ‘Mother attended school’, and ‘Father attended school’ are indicator variables.
4.2. Rainfall data
The Department of Agriculture of the state government of Maharashtra records daily rainfall in millimeters using rain gauges installed at every circle.Footnote 10 The dataset also has information on the long-term mean rainfall for every district, calculated from 1988 onwards. Central Maharashtra receives lower rainfall than the Western-coastal and Eastern parts. However, there is extensive variation in rainfall across both time and space (table A1 in the online appendix). Figure 1 shows the percentage deviation of actual rainfall from the long-term mean in Maharashtra over the past decade. Maximum deviation was observed in 2012, followed by 2014 and 2015.
We use the variation in the intensity of rainfall deviation in 2012 across districts to identify whether there was a drought shock.Footnote 11 ‘Drought 2012’ is our treatment variable, equal to 1 if the rainfall deviation from long-term mean is greater than 20 per cent in a district in 2012. This is the standard cutoff used to define drought in India (Pathania, Reference Pathania2007; Government of India, 2016). We also use the continuous measure of rainfall deviation from long-term mean instead of the binary drought variable to test the robustness of our analysis. Figure 4 is a map of the percentage deviation of rainfall across districts in 2012. (Rainfall patterns are similar to those obtained using the SPI in figure 2.) Districts are subsequently classified into treatment or control depending on the value of ‘Drought 2012’ (figure 5).Footnote 12 Fifity-eight per cent of the districts suffered from the drought shock, while the rest received normal or sub-normal rainfall.
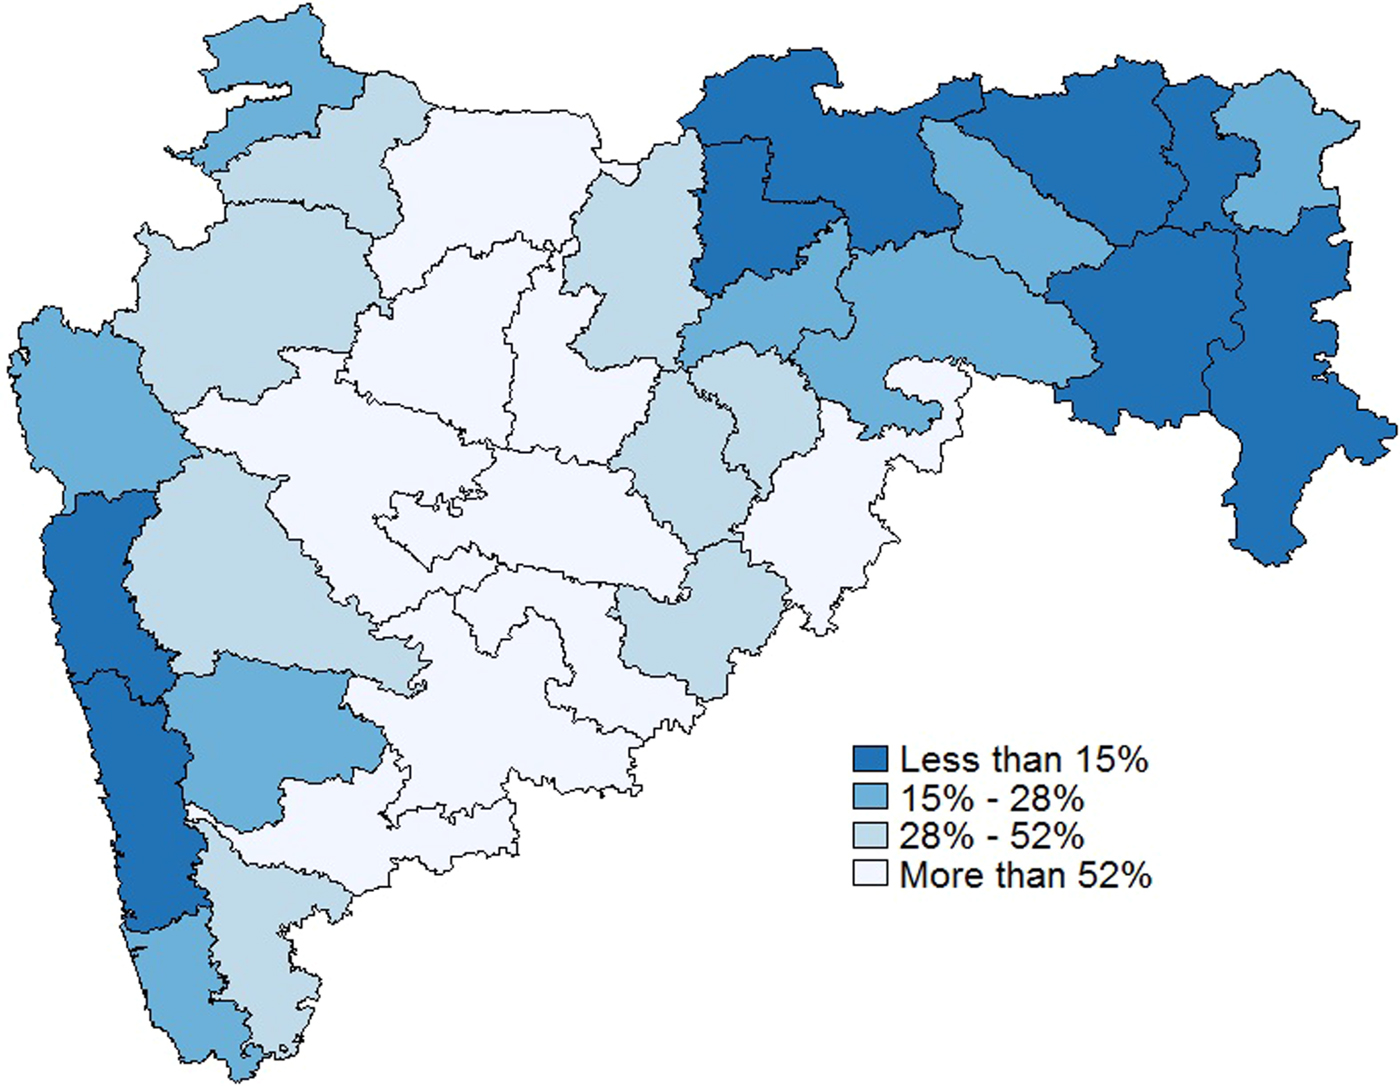
Figure 4. Rainfall deviation from long-term mean in districts of Maharashtra in 2012 (in %).
Figure 5. Drought-affected districts in Maharashtra in 2012.
We also obtained data on the district-level SPI in 2012 in Maharashtra from the Indian Meteorological Department (IMD).Footnote 13 The SPI is a universal measure of drought as it can be compared across markedly different climatic regions. IMD uses high resolution (0.25 × 0.25) daily gridded rainfall data since 1901 to calculate the SPI. The long time series of rainfall is fitted to a gamma distribution, which is then transformed into a standardized normal distribution so that the mean SPI of the location and desired period is zero (McKee et al., Reference McKee, Doesken and Kleist1993). An SPI value of −1 and below implies a drought shock in India (Government of India, 2016).Footnote 14 According to this definition, 10 districts (30 per cent) suffered from a drought shock in 2012 (figure 2). In the analysis that follows, we use the continuous district level SPI to test the robustness of our main result.
5. Estimation methodology
5.1. Difference-in-differences
Our aim is to identify the average treatment effect on the treated (ATT), i.e., the average effect of the drought in 2012 on test scores (reading and math scores) of children who were affected by it. Ideally, we would like to compare the test scores of children affected by the drought to their test scores in the absence of drought. Since the counter-factual is not observed, it needs to be estimated using a comparison group. The drought shock in 2012 is a natural experiment. Affected districts form the treatment group and unaffected districts form the control group (figure 5). A difference-in-differences methodology (DID) is then used to compare the changes in test scores over time between children in the treatment and control groups. The main regression equation is:
 $$\eqalign{TS_{ihdt} & =\alpha +\sum_{t=2007}^{2016}\beta _{t}Y_{t}D_{d,2012}+\delta D_{d,2012}+\gamma X_{ihdt} \cr & \quad +\lambda R_{d,t}+\theta R_{d,t-1}+\eta _{d}+\psi _{t}+\varepsilon _{ihdt},}$$
where TS ihdt is the test score (reading score or math score) of child i of household h living in district d in year t = 2007, 2008, 2009, 2010, 2011, 2012, 2013, 2014, 2016. Y t is equal to 1 if year = t. D d,2012 is a treatment indicator for drought in a district in 2012. It is equal to 1 if rainfall deviation from the long-term mean is greater than 20 per cent in district d in 2012. It controls for all time invariant differences between the treatment and control groups. Xihdt is a vector of other controls including age and gender of the child, total household members, household wealth index, and indicators for whether the father and mother attended school. η d controls for district fixed effects. ψ t controls for year fixed effects (time trend in test scores that is common to all districts). α is the constant term.
Apart from the drought shock in 2012, Maharashtra experienced deficit rainfall in 2008, 2009, 2011, 2014, 2015 and 2016, and surplus rainfall in 2006, 2007, 2010 and 2013 (figure 1). Since these rainfall shocks can also affect children's test scores, it is important to include them in our model (Shah and Steinberg, Reference Shah and Steinberg2017). R d,t and R d,t−1 are the percentage deviations of actual rainfall from long-term mean rainfall in district d in years t and t−1 respectively.
We are interested in the coefficients β t of the interaction terms of Y t and D d,2012. Taking 2011 (the pre-drought year) as base, β 2007 to β 2010 are the pre-treatment differences in trends in test scores between the treatment and control groups. If the pre-treatment trends are parallel, i.e., if β 2007 to β 2010 are equal to zero, it supports the assumption that trends in test scores were parallel in the absence of treatment, lending confidence to our DID result. β 2012 to β 2016 are the DID coefficients of the impact of the 2012 drought on test scores in the years 2012 to 2016 respectively. β 2012 and β 2013 identify the contemporaneous effects while β 2014 and β 2016 identify the short-term effects of the 2012 drought.
5.2. Heterogeneous effects
We use a difference-in-difference-in-differences methodology (DDD) to study heterogeneity in the impact of drought by gender, age, parents' schooling and household wealth. This provides some evidence on underlying channels. For example, boys are more likely to be working than girls, and older children are more likely to be working than younger children (Udry, Reference Udry, Banerjee, Benabou and Mookherjee2006). So one would expect a larger negative impact of drought on boys and older children as compared to girls and younger children if the underlying channel is increased child labor. Similarly, if younger children are found to be more severely affected by the drought shock, it is possibly via changes in nutritional investments or direct health effects. Finding no differential effect of drought by gender or by age is indicative of an income effect wherein the test scores of all children fall due to lowered expenditure capacity of the household (Groppo and Kraehnert, Reference Groppo and Kraehnert2017).
Parents' education is considered to be an indicator of the household's socio-economic status, i.e., its permanent income level. We study whether parents' schooling plays a role in insuring children's education against the drought shock. In a related study, Beegle et al. (Reference Beegle, Dehejia and Gatti2006) find that rural agricultural households use assets to offset the negative effect of an income shock. Households with more assets also have better access to credit markets. We study heterogeneity by household wealth index to find out whether children in households with a greater ability to offset a shock, i.e., those with more assets, are shielded from the impact of drought. We estimate the following equation:
 $$\eqalign{TS_{ihdt} & =\alpha +\sum_{t=2007}^{2016}\beta _{t}Y_{t}D_{d,2012}Z_{ihdt}+\delta D_{d,2012}+\pi Z_{ihdt}+\phi Y_{t}Z_{ihdt} \cr & \quad +\kappa D_{d,2012}Z_{ihdt}+\gamma X_{ihdt}+\lambda R_{d,t}+\theta R_{d,t-1}+\eta _{d}+\psi _{t}+\varepsilon _{ihdt},}$$
where Z ihdt is either gender, age, parents' schooling or household wealth index, and all other variables are the same as before. The coefficients β t of the triple interaction terms are the DDD over the years. As an example, consider gender as the Z ihdt variable. Then, the β t coefficients tell us whether the drought shock has a differential impact on girls' test scores as compared to boys' test scores in year t.
6. Results
6.1. Results from difference-in-differences
The DID results from equation (1) are displayed in table 3 for reading scores and in table 4 for math scores. In the first column of each table, we report the DID coefficient without disaggregating the impact by years. We define ‘Post’ equal to 1 for post-drought years (2012, 2013, 2014, 2016) and equal to 0 for pre-drought years (2007–2011). The coefficient of the interaction term ‘Post × Drought 2012’ is the overall impact of the drought. In columns 1 and 2, we report results using the full sample and in column 3, since we add father's schooling and household wealth index as explanatory variables, we use the 2009 to 2016 sample.
Table 3. Impact of the 2012 drought on reading scores in Maharashtra
Note: Standard errors are clustered at the district level, and shown in parentheses. Statistically different from zero at the 1% (***), 5% (**), or 10% (*) level of significance. ‘Drought 2012’ is equal to 1 if rainfall received is less than 20% of long-term mean rainfall in a district in 2012. Interactions of ‘Drought 2012’ with 2007, 2008, 2009, and 2010 capture pre-treatment (pre-drought) trends and interactions with 2012, 2013, 2014, 2016 capture post-treatment (post-drought) difference-in-differences. 2011 is the base year. Rainfall deviations are measured as the percentage deviation of actual rainfall from long-term mean rainfall in a district in a year. ‘Child's age’ is measured in years and ‘Household wealth index’ is a standardized variable with mean 0 and standard deviation 1. ‘Child's gender’, ‘Mother attended school’, and ‘Father attended school’ are indicator variables. ‘DID’ stands for difference-in-differences regression.
Table 4. Impact of the 2012 drought on math scores in Maharashtra
Note: Standard errors are clustered at the district level, and shown in parentheses. Statistically different from zero at the 1% (***), 5% (**), or 10% (*) level of significance. ‘Drought 2012’ is equal to 1 if rainfall received is less than 20% of long-term mean rainfall in a district in 2012. Interactions of ‘Drought 2012’ with 2007, 2008, 2009, and 2010 capture pre-treatment (pre-drought) trends and interactions with 2012, 2013, 2014, 2016 capture post-treatment (post-drought) difference-in-differences. 2011 is the base year. Rainfall deviations are measured as the percentage deviation of actual rainfall from long-term mean rainfall in a district in a year. ‘Child's age’ is measured in years and ‘Household wealth index’ is a standardized variable with mean 0 and standard deviation 1. ‘Child's gender’, ‘Mother attended school’, and ‘Father attended school’ are indicator variables. ‘DID’ stands for difference-in-differences regression.
The coefficients of the interaction terms ‘2007 × Drought 2012’, ‘2008 × Drought 2012’, ‘2009 × Drought 2012’, and ‘2010 × Drought 2012’ are not significantly different from zero in table 3 and table 4, supporting the assumption of parallel pre-treatment trends in reading and math scores between the treatment and control groups.
We find that there is a decline in both reading and math scores as a result of the drought. Math scores fall more than reading scores. There is an overall decline post drought equal to 4.14 per cent in math scores and 2.67 per cent in reading scores.Footnote 15
Reading scores of affected children fall by 0.122 points in 2012 and 0.134 points in 2013. This is equal to a contemporaneous decline of 3.08 per cent and 3.38 per cent respectively. The drought has a lasting negative impact on reading scores in the short term. In 2014, the treatment effect is 3.03 per cent (although it is not statistically significant), and in 2016 it increases to 4.22 per cent. However, since 2015 and 2016 were also severe drought years in Maharashtra (figure 1), the coefficient of ‘2016 × Drought 2012’ may be a compounded effect of all three shocks. Although we control for district-year rainfall deviations in our model, it is possible that we are unable to fully isolate the impact of the 2012 drought in 2016. Nonetheless, results from column 3, controlling for household wealth and father's schooling, also show a significant negative impact in 2016.
Math scores of affected children fall by 0.177 points in 2012 and 0.202 points in 2013. This is equal to a contemporaneous decline of 5.05 per cent and 5.77 per cent respectively. The drought has a lasting negative impact on math scores in the short term as well. In 2014, the treatment effect is 3.82 per cent, and in 2016 it increases to 6.48 per cent. Again, we cannot rule out the possibility that the impact in 2016 may be a compounded effect of multiple droughts. However, the effect persists on adding additional controls in column 3.
The coefficients of other control variables in table 3 and table 4 have the expected signs. Children in drought-affected districts score lower on average as compared to those in control districts. Age has a significantly positive effect on test scores. An increase in the number of household members has a significantly negative effect on the test scores. Typically, larger households have more children and the educational or nutritional investment on each child is lower if the household is credit constrained. Interestingly, girls have lower math scores than boys, but higher reading scores on average. Father's and mother's schooling are also important determinants of higher reading and math scores. Similarly, household wealth index is a significant determinant of test scores. Wealthier households are able to spend more on their children, resulting in higher test scores.Footnote 16
To contextualize the magnitude of the effect of drought, we compare it to the coefficients on parent's schooling. Drought affects test scores by nearly the same amount and in the opposite direction as parents' schooling. Footnote 17 Our results are also comparable to literature from other countries. Baez and Santos (Reference Baez, De la Fuente and Santos2007) find that children affected by Hurricane Mitch in Nicaragua were 7 percentage points more likely to be simultaneously enrolled in school and working. Björkman-Nyqvist (Reference Björkman-Nyqvist2013) finds that negative rainfall shocks lead to a decline of 5 percentage points in female enrollment in Uganda. Shah and Steinberg (Reference Shah and Steinberg2017) find that negative rainfall shocks increase test scores by 1.5 per cent on average in India. We find that negative rainfall shocks in the current year do not have an effect on test scores in Maharashtra: the coefficient of ‘Rainfall deviation current year’ is not significantly different from zero for both reading and math scores. It is significant only in column 1 of tables 3 and 4, but the size of the effect is close to zero. There is a slight positive effect of previous year's rainfall shock, as shown by the positive and significant coefficient of ‘Rainfall deviation previous year’ in tables 3 and 4. This is in line with Shah and Steinberg's (Reference Shah and Steinberg2017) finding that negative rainfall shocks improve test scores of children in rural India (substitution effect). Our results show that the 2012 drought affects test scores over and above yearly rainfall shocks.
We also use alternate definitions of drought (a continuous district level measure of percentage rainfall deviation from long-term mean, and the district level SPI as dependent variables in the DID models (tables 5 and 6). There is a decline in reading scores and math scores due to the drought as defined by both rainfall deviation and SPI. Higher rainfall deviation (implying lower rainfall) results in lower test scores and higher SPI (implying higher rainfall) results in higher test scores.
Table 5. Impact of the 2012 drought on reading scores in Maharashtra using alternate definitions of drought
Note: Standard errors are clustered at the district level, and shown in parentheses. Statistically different from zero at the 1% (***), 5% (**), or 10% (*) level of significance. ‘Rainfall deviation 2012’ is the percentage deviation of district rainfall in 2012 from its long-term mean. ‘SPI 2012’ is the district level standardized precipitation index in 2012. 2011 is the base year in both cases. Control variables are gender, age, mother's schooling, total household members, and rainfall deviations in district d in year t and year t−1 (t=2007 to 2016). ‘DID’ stands for difference-in-differences regression.
Table 6. Impact of the 2012 drought on math scores in Maharashtra using alternate definitions of drought
Note: Standard errors are clustered at the district level, and shown in parentheses. Statistically different from zero at the 1% (***), 5% (**), or 10% (*) level of significance. ‘Rainfall deviation 2012’ is the percentage deviation of district rainfall in 2012 from its long-term mean. ‘SPI 2012’ is the district level standardized precipitation index in 2012. 2011 is the base year in both cases. Control variables are gender, age, mother's schooling, total household members, and rainfall deviations in district d in year t and year t−1 (t=2007 to 2016). ‘DID’ stands for difference-in-differences regression.
Additionally, we perform the same analysis for enrollment. The dependent variable is equal to 1 if a child is enrolled in school in year t. It is equal to 0 if the child is not enrolled. We find that there is no significant contemporaneous effect of drought on the probability of enrollment. There is a decline of 2 per cent in enrollment in 2014, but it recovers in 2016 (table A2 in the online appendix). Overall, the 2012 drought affected test scores more than enrollment. Since public schooling is free and compulsory in Maharashtra, one would not expect the enrollment status of children to be severely affected in the short run by a drought shock. It is common for children to be enrolled in schools on paper but not actually attending school or learning (Ravallion and Wodon, Reference Ravallion and Wodon2000). They might be working part-time to contribute to the household's income or suffer from reduced investments in resources needed for schooling as a result of the drought shock. Reduced investment in books, transport, time spent on learning and care by parents, time spent on learning by children, and reduced nutritional and health investments all contribute to a decline in test scores but may not change enrollment status.
6.2. Results from heterogeneous effects
To investigate the underlying channels through which drought negatively affects test scores, we study heterogeneity in the impact for different sub-groups (using the DDD model in equation (2)). Results by gender and age are shown in panel A of table 7 for reading scores and panel A of table 8 for math scores. The coefficient of the triple interaction term ‘Post × Drought 2012 × Girl’ shows that girls' reading scores fell by an additional 1.8 per cent compared to boys' reading scores. Reading scores are more severely affected contemporaneously, and the heterogeneity by gender fades in the short term. The impact of drought on math scores is not significantly different for girls compared to boys overall. There is a slight decline in 2012 but the difference does not persist after 2012 and math scores of both girls and boys decline evenly from 2013 to 2016.
Table 7. Heterogeneous effects of the 2012 drought on reading scores in Maharashtra
Note: Standard errors are clustered at the district level, and shown in parentheses. Statistically different from zero at the 1% (***), 5% (**), or 10% (*) level of significance. ‘Drought 2012’ is equal to 1 if rainfall received is less than 20% of long-term mean rainfall in a district in 2012. ‘Girl’ is equal to 1 if the child is a girl. ‘Young’ is equal to 1 if the child is 13 years or younger, and is thus of compulsory schooling age. ‘Father attended school’ is equal to 1 if the child's father ever attended school. ‘HH wealth is above median’ is equal to 1 if the household wealth index is above the median level. ‘DDD’ stands for difference-in-difference-in-differences regression.
Table 8. Heterogeneous effects of the 2012 drought on math scores in Maharashtra

Note: Standard errors are clustered at the district level, and shown in parentheses. Statistically different from zero at the 1% (***), 5% (**), or 10% (*) level of significance. ‘Drought 2012’ is equal to 1 if rainfall received is less than 20% of long-term mean rainfall in a district in 2012. ‘Girl’ is equal to 1 if the child is a girl. ‘Young’ is equal to 1 if the child is 13 years or younger, and is thus of compulsory schooling age. ‘Father attended school’ is equal to 1 if the child's father ever attended school. ‘HH wealth is above median’ is equal to 1 if the household wealth index is above the median level. ‘DDD’ stands for difference-in-difference-in-differences regression.
For heterogeneity across age groups, we compare the impact on test scores of younger versus older children. ‘Young’ is an indicator variable equal to 1 if the child is attending compulsory school (is 13 or younger). It is equal to 0 if the child has finished compulsory school (is 14 or older). We find that there is no significant difference in the impact of drought on both reading and math scores of younger children compared to older children (as coefficients of ‘Post × Drought 2012 × Young’ are statistically insignificant). Looking at the coefficients disaggregated by years, reading scores do decline more for younger children in 2013, however this difference does not persist in the short term. Math scores are not significantly different over the years. Overall, since boys and older children are not more severely affected by the drought than girls and younger children, it is unlikely that there is an increase in child labor due to the drought (Groppo and Kraehnert, Reference Groppo and Kraehnert2017).
Panel B of table 7 and panel B of table 8 present results on the heterogeneity in the impact of drought by father's schooling and household wealth. For both reading and math scores, father's schooling partially offsets the negative effect of the drought shock. It is more important in the years following drought than later (as there is no differential effect in 2016). In a separate regression, we find that mother's schooling does not have a significant differential effect on test scores. This is puzzling but perhaps reflective of socio-cultural and gender biases in rural India.Footnote 18 Insofar as father's education level is associated with the socio-economic status or permanent income level of the household, our results indicate that children from higher socio-economic strata are shielded by the drought compared to children from lower socio-economic strata.
Reading and math scores of children from households with above median levels of wealth are not differentially affected by the drought compared to those from households with below median levels of wealth. This implies that assets do not help offset the impact of the drought shock on test scores (Beegle et al., Reference Beegle, Dehejia and Gatti2006).
7. Conclusions
We find evidence that drought shocks adversely affect education in rural India. We estimate the impact of a severe drought in 2012 on test scores and school enrollment in rural Maharashtra. We measure drought intensity using district-level rainfall and the standardized precipitation index. Results from a difference-in-differences model show that the drought caused a contemporaneous and short-term decline (from 2012 to 2016) in test scores of affected children. Math scores fell by 4.14 per cent and reading scores fell by 2.67 per cent on average. In terms of magnitude, the impact of drought is comparable to the effect of parents' schooling (an important determinant of children's educational outcomes) on test scores. The estimated impact represents the net effect of possible underlying channels. The 2012 drought was exceptionally drastic for Maharashtra, resulting in loss of agricultural output, loss of livelihood, and food scarcity (Udmale et al., Reference Udmale, Ichikawa, Kiem and Panda2014a). Our results support the hypothesis that drought-affected households were unable to smooth consumption, resulting in a decline in investment in their children's education.
A decline in investment in children's education can take any of the following forms: reduced spending on human-capital-related goods and services (uniform, books, transport, tuition, food, medicine, vaccination), reduced time dedicated by parents to their children's learning and care, reduced time dedicated by children to learning/studying, or increased time dedicated by children to working. It is unlikely that there was an increase in time dedicated to working, since test scores of older children and boys were not more severely affected by the drought than test scores of younger children and girls (Udry, Reference Udry, Banerjee, Benabou and Mookherjee2006). (This is similar to Shah and Steinberg (Reference Shah and Steinberg2017), who find that child labor actually falls in deficit rainfall years in India.) Moreover, school enrollment also remained unaffected by the drought. However, schooling and child labor are not perfect substitutes (Ravallion and Wodon, Reference Ravallion and Wodon2000). The drought may have caused changes in child labor that we are unable to capture due to the unavailability of data.
Additionally, we find that parents' schooling is an important determinant of test scores in rural Maharashtra, and children whose fathers attended school were significantly more shielded from the impact of drought than children whose fathers did not attend school. Uneducated households are likely to form the lower socio-economic strata. Thus, children from lower socio-economic strata suffer more severely from drought shocks than children from higher socio-economic strata. We also find that household assets were ineffective in offsetting the negative impact of drought on test scores. In particular, households with above median levels of assets were not differentially affected by the drought, i.e., they were unable to use assets as buffer stock to smooth consumption. This is indicative of the severity of the drought shock (Beegle et al., Reference Beegle, Dehejia and Gatti2006).
Our analysis comes with a few limitations. First, we are unable to study the possibility of a health channel (whereby children's health suffers because of drought, causing a fall in their test scores) due to data limitations and confoundedness of the health channel with the income channel. No paper in the literature so far has been able to study the impact of weather shocks on education via a health channel, and it merits future research. Second, 2015 and 2016 were also drought years in Maharashtra, making it difficult to isolate the impact of the 2012 shock in 2016.
Overall, our results highlight the need to shield children in developing countries from drought shocks (Hanna and Oliva, Reference Hanna and Oliva2016). Maharashtra is a drought-prone state and it is likely that the damage from drought will continue in the future years. The process of human capital formation is accumulative, so a drought-induced decline in current learning is likely to erode future learning if left unaddressed (Cunha and Heckman, Reference Cunha and Heckman2007). Drought shocks can also adversely affect expected payoffs from educational investments in the future, specially if they become more frequent.
It is important to target drought relief towards vulnerable households and children. The emphasis should be to keep children in schools, provide food, transport and other required resources. Additionally, drought-prone districts must implement policies aimed at decreasing the vulnerability of rural households to weather shocks. Increasing access to both credit and insurance markets is required so that households affected by income shocks can smooth consumption and are not forced to disinvest in their children.
Supplementary material
The supplementary material for this article can be found at https://doi.org/10.1017/S1355770X19000123.
Acknowledgments
This paper began as a Masters dissertation at the Graduate Institute of International and Development Studies, Geneva. I thank my supervisor Jolle Noailly for her guidance. I also acknowledge IFPRI and CCAFS (CGIAR Research Program on Climate Change, Agriculture and Food Security) for their support. I benefitted from excellent feedback from Lore Vandewalle, Ugo Panizza, Salvatore Di Falco, Avinash Kishore, Anmol Grewal, Safeya Zeitoun, and the anonymous reviewers of this paper. I am grateful to my parents and my brother Chaitanya without whom this first paper would not be possible. Lastly, I thank the ASER Center and Dr. Attri at the Indian Meteorological Department (IMD) for generously providing data for this work.


