


INTRODUCTION
Chlorite minerals are widely distributed and well preserved in the midlatitude deserts of interior Asia. The annual spring dust storm lifts silt-sized and finer-fraction particles/aggregates from these deserts, in particular, chlorite minerals with easily transported physical properties (e.g., a flaky particle shape and light density at 2.6–2.8 g/cm3) (Deer et al., Reference Deer, Howie and Zussman1963) to the high-level atmosphere. Hence, Asian dust has abundant chlorites (Jeong and Achterberg, Reference Jeong and Achterberg2014). Previous studies have shown that chlorite minerals in Asian dust sourced from several deserts (Ferrat et al., Reference Ferrat, Weiss, Strekopytov, Dong, Chen, Najorka, Sun, Gupta, Tada and Sinha2011) can be transported along the pathway, for example, to the Chinese Loess Plateau (CLP) (Eden et al., Reference Eden, Qizhong, Hunt and Whitton1994; Jeong et al., Reference Jeong, Hillier and Kemp2011), the Korean dust falls (Jeong et al., Reference Jeong, Kim, Seo, Kim, Jin and Chun2014), the North Pacific (Leinen et al., Reference Leinen, Prospero, Arnold and Blank1994), or even farther to Greenland (Biscaye et al., Reference Biscaye, Grousset, Revel, VanderGaast, Zielinski, Vaars and Kukla1997). Therefore, chlorite species have great potential as tracers indicative of past atmospheric transport. In addition, chlorite is also an important source of soluble Fe and a bioavailable form of iron for microbial organisms, particularly after the contact of the dust with the atmosphere (Takahashi et al., Reference Takahashi, Higashi, Furukawa and Mitsunobu2011). This suggests that chlorite minerals together with other iron-bearing materials are particularly important for iron fertilization in ocean surfaces, thus causing atmospheric carbon cycles and climatic changes (Martin, Reference Martin1990; Jickells et al., Reference Jickells, An, Andersen, Baker, Bergametti, Brooks and Cao2005). Up to now, few studies have investigated chlorite mineral distributions for the arid source areas of the CLP. Therefore, investigations of the concentration and distribution of chlorite minerals in a stratigraphic sequence in the CLP and its surrounding deserts may advance our understanding of the sources and transport pathways of Asian paleodust associated with climate changes in glacial–interglacial cycles.
Spatial mapping work of grain-size isolines in the CLP shows a north–south gradient for loess deposits (Ding et al., Reference Ding, Derbyshire, Yang, Sun and Liu2005; Yang and Ding, Reference Yang and Ding2008). Further study using a geochemical parameter of Zr/Rb ratios has also suggested a general southward wind transport (Chen et al., Reference Chen, Chen, Liu, Ji, Balsam, Sun and Lu2006). This transport pattern implies that the Mu Us Desert and the Mongolian Gobi Desert farther north were dominant dust sources for the loess deposits. However, other studies suggested that an additional transport pathway to the CLP may be in a west–east direction from western deserts (e.g., the Badain Jaran, Tengger, and Qaidam Deserts, as the main sources Chen et al., Reference Chen, Li, Yang, Rao, Lu, Balsam, Sun and Ji2007). Recently, detrital zircon U-Pb age patterns revealed that materials from the northeastern Tibetan Plateau might be dominant in supplying dust to the CLP, secondarily from Mt. Altay, and thirdly from the North China Craton (Zhang et al., Reference Zhang, Lu, Xu, Liu, Yang, Stevens and Bird2016). In this context, both the westerly and northerly winds contributed to the loess deposits.
Mineralogical studies provided another clue to the transport pathway of Asian dust from potential dust sources to the loess deposits (Nie et al., Reference Nie, Peng, Pfaff, Möller, Garzanti, Andò and Stevens2013; Nie and Peng, Reference Nie and Peng2014; He et al., Reference He, Liu, Chen, Sheng and Ji2016, Reference He, Liu, Chen, Sheng and Ji2017). On the basis of a large data set of mineralogical assemblages, Nie and Peng (Reference Nie and Peng2014) have suggested that the dust provenance remained unchanged between glacial loess and interglacial paleosol at least for the past 400–500 ka. Further temporal-spatial dust studies using single-species plagioclase (He et al., Reference He, Liu, Chen, Sheng and Ji2016) and hornblende (He et al., Reference He, Liu, Chen, Sheng and Ji2017) have suggested that the deserts on the northeastern Tibetan Plateau dominated the dust material contribution to the CLP in the late Pleistocene. This highlights the significance of the dust route along the northeastern Tibetan Plateau.
Here, we present precisely measured chlorite minerals at the Lingtai section in the central CLP, along with those from seven deserts as follows: the Gurbantunggut Desert and Taklamakan Desert in the inland basins of northwestern China; the Badain Jaran Desert and Tengger Desert along the north flank of Mt. Qilian; the Qaidam Desert to the south flank of Mt. Qilian; the Mu Us Desert north of the CLP; and the Mongolian Gobi Desert farther north. We focus on (1) differences in the chlorite mineral concentrations between the glacial loess and interglacial paleosol layers and (2) the spatial distribution of chlorite minerals in potential sources from the seven deserts, and (3) on the basis of these investigations, we discuss the wind transport of chlorite minerals and assess the potential role of past glacial–interglacial cycles in modulating atmospheric circulation over the past 1.2 Ma.
MATERIALS AND METHODS
The CLP is situated in North China from 103°E to 114°E and 34°N to 40°N. The modern mean annual precipitation increases from less than 200 mm to approximately 700 mm along the CLP. The studied Lingtai section (35°04′N, 107°39′E) is located in the central CLP. The present local rainfall is 650 mm/yr. The upper part of this section, developed during the late Pleistocene, has a thickness of 40 m and consists of five alternating layers of loess and paleosol. The underlying middle Pleistocene section has a thickness of 50 m. Alternating layers of loess and paleosol can also be observed. The loess units exhibit a yellowish color and massive structure, whereas the paleosol units exhibit a brownish color and accumulations of organic matter and iron oxide. This profile has been detailed in previous studies (Ding et al., Reference Ding, Xiong, Sun, Yang, Gu and Liu1999). The magnetic susceptibility has also previously been measured (Chen et al., Reference Chen, Chen, Liu, Ji, Balsam, Sun and Lu2006). Therefore, a chronology is established by correlating the studied section with the benthic δ18O stack LR04 (Lisiecki and Raymo, Reference Lisiecki and Raymo2005).
Thirty-three samples from the Lingtai section were selected for chlorite mineral analysis. Fourteen samples are from five loess units (L1, L2, L3, L4, and L5) and five paleosol units (S0, S1, S2, S3, and S4) in the late Pleistocene. We selected at least one sample from each of the paleosol layers. As indicated by the maximum or minimum magnetic susceptibility values, the selected samples were deposited either during the glacial maximum or minimum. This sample selection strategy allows us to obtain chlorite mineral data of full-scale glacial–interglacial variations. The other 19 samples from loess and paleosol layers in the middle Pleistocene cover the stratigraphy from 1.2 to 0.5 Ma. Most of the paleosol and loess layers were analyzed, but samples in the L8, L10, and S12 layers were not measured in this study, considering that the stratigraphy has a relative low sampling resolution.
The following seven deserts were investigated here as potential source areas for chlorite minerals: the Taklamakan Desert, Gurbantunggut Desert, Badain Jaran Desert, Tengger Desert, Mu Us Desert, Qaidam Desert, and Mongolian Gobi Desert (Fig. 1). These desert basins are located either on flat tableland or low topographic areas and cover an area of 1.5×10⁶ km2 in China (Sun et al., Reference Sun, Ding and Liu1998) and 22×104 km2 in Mongolia (Yang et al., Reference Yang, Rost, Lehmkuhl, Zhenda and Dodson2004). We selected a total of 30 surface sand samples to represent a spatial distribution of chlorite minerals. Surface sand samples of up to 1 kg were collected from each individual location in the six Chinese deserts and the Mongolian Gobi Desert (Supplementary Table 1A in the Supplementary Appendix).
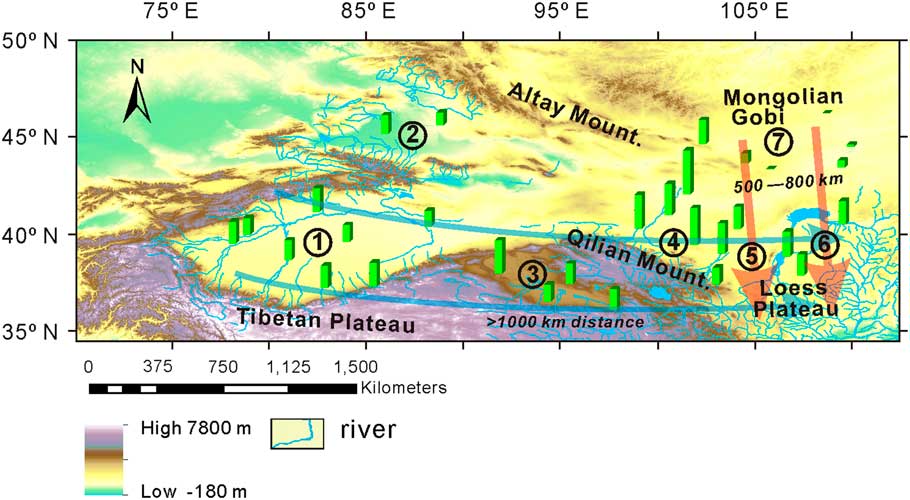
Figure 1 Map depicting the potential dust source deserts. The mountain foreland desert basins include the Taklamakan (1), Gurbantunggut (2), Qaidam (3), Badain Jaran (4), Tengger (5), Mu Us (6), and Mongolian Gobi (7). The sampling locations in the deserts are marked by green bars. The blue and red lines denote the westerly wind and winter monsoon. (For interpretation of the references to color in this figure legend, the reader is referred to the web version of this article.)
A total of 40,000 grains, including up to 1000 particles of chlorite minerals, were imaged for each sample. A grayscale histogram analysis of each particle allowed the mineral liberation analysis (MLA) system to discriminate between the mineral phases within each particle. The total area of each particle was calculated and reported in area percentages for each individual mineral species. The mineral mapping result could then be converted into weight percentage by multiplying the mineral density for each mineral species. Given such a large and multivariate data set, the chlorite mineral contents of these desert and loess deposit samples have a high precision with an uncertainty as low as 0.1%.
Mineral species of iron oxides were also identified and classified as a separate group. The quantification procedure for the iron oxides was the same as that for the chlorite. The iron oxides here refer to a total of lithogenic and secondary species (e.g., magnetite, goethite, and hematite). The energy-dispersive spectrum revealed that minor amounts of Si and Al were mixed with goethite and hematite species, strongly suggesting a secondary origin under a chemical weathering regime. The iron oxide data were obtained for a total of 30 desert sediments and 34 samples from the loess deposits. We further constructed an iron oxide index (IO index), which is designed as the secondary iron oxide versus a total of iron-bearing oxides including ilmenite and magnetite (see the Supplementary Appendix for descriptions). This ratio represents the postdepositional changes in the intensity of chemical weathering.
An automatic mineralogical analysis can be used to conduct a mineral phase-specific particle-size analysis (Sutherland, Reference Sutherland2007). The MLA technique provides chlorite mineral maps and thus the length and breadth of each particle. Using the size of the grain as indicated by scanning electron microscopy, the chlorite particles in each sample were grouped into bin sizes from 5 to 100 μm, with increments of 10 μm for each bin. The major grain sizes for both the samples of glacial loess and interglacial paleosol range from 10 to 30 μm and peak at 20 μm (Fig. 2). A total of chlorite grains includes approximately one-fourth of the total single grains in the fine fraction (5–20 μm) and three-fourths of the total grains in the coarse fraction (20–100 μm). Grains larger than 20 μm may quickly settle back to the ground, but smaller particles are hypothesized to be in suspension and are therefore commonly observed in the long-distance dust transport (Pye, Reference Pye1987).
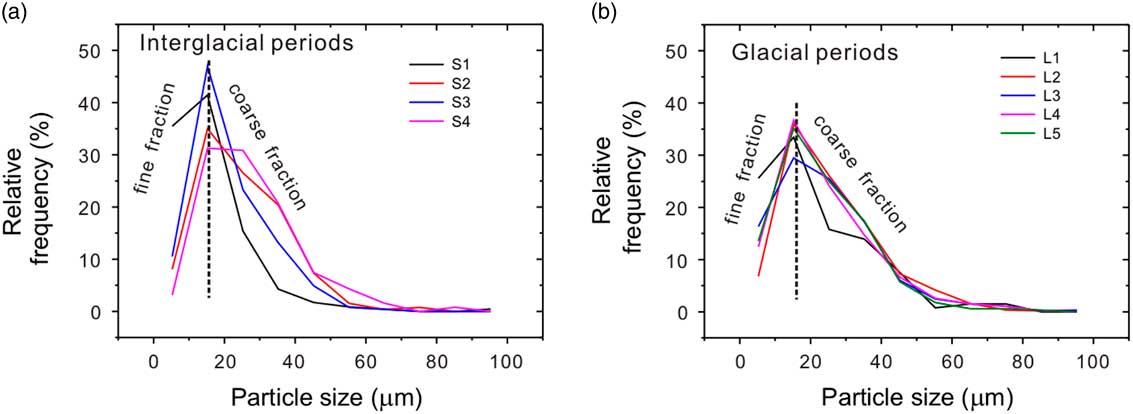
Figure 2 (color online) Particle-size distribution of chlorite in the interglacial paleosol layers (a) and glacial loess layers (b). The particle-size distribution suggests mixed contributions from both finer (5–20 μm) and coarser (20–100 μm) particles.
RESULTS
Mineralogical analyses in loess deposits were conducted for nine types of minerals identified from the MLA analysis. The main group of minerals consists of 50–60% quartz, 20–25% plagioclase, and 6–10% K-feldspar (Dataset 1D in the Supplementary Appendix), consistent with previous results using an X-ray diffraction (XRD) technique (Jeong et al., Reference Jeong, Hillier and Kemp2011). The amounts of chlorite minerals in this study vary from 1% to 5%, among the second largest group of minerals.
Figure 2 shows typical chlorite grain-size frequency distribution patterns for paleosol and loess samples without significant differences between the two kinds of samples. There are minor differences in detail between the loess and paleosol samples. The paleosol samples display a leptokurtic pattern (Fig. 2a), whereas the loess samples have a platykurtic pattern (Fig. 2b)—that is, concentrations of chlorite minerals are higher around a peak of 20 μm in the interglacial than the glacial periods. This difference in the chlorite frequency distribution pattern between the paleosol and loess samples is in contrast to the previous result analyzed from the bulk samples (Yang and Ding, Reference Yang and Ding2004).
Compared with the semiquantitative XRD techniques in measuring chlorite concentration in loess deposits (Zhao et al., Reference Zhao, Ji, Chen, Liu, Chen and Balsam2005), our results have a much higher precision based on a large number of identified particles in the data set (40,000). This high precision makes it possible to identify differences between the paleosol and loess units (Dataset 1D in the Supplementary Appendix) and to precisely estimate spatial differences in the desert sediments. In general, variations in bulk chlorite concentration along the loess deposits show a typical glacial–interglacial pattern, in pace with the benthic oxygen isotope record since 0.5 Ma (Lisiecki and Raymo, Reference Lisiecki and Raymo2005; see Fig. 3). In contrast, the older stratigraphy (from 0.5 to 1.2 Ma) does not show the glacial–interglacial pattern as clearly as the younger stratigraphy. This is probably because of the following several lines of reasoning. First, strong postdepositional rainwater leaching may lead to lowered chlorite concentration in a thin layer of loess units—for example, a low value in L6. Second, the paleosol units in general appear to be complex structures usually interbedded with a thin layer of loess deposit. The S14 unit shows an unexpectedly high concentration of chlorite, which may be attributable to the measured samples having been collected in the sublayer of the loess deposit. Third, the relatively low sampling resolution—in particular, the lack of layers L8, L10, and S12—may interrupt the climate cycles. Nevertheless, two features stand out in our chlorite records: (1) the glacial–interglacial changes in chlorite concentrations appear to be stronger after approximately 0.5 Ma, with chlorite concentrations in the glacial periods reaching 4%; and (2) chlorite concentrations in the interglacial periods remain at a constant value (~1%) throughout the records.

Figure 3 (color online) Comparisons between the chlorite concentration (a) and benthic δ18O record (b) (Lisiecki and Raymo, Reference Lisiecki and Raymo2005). An increase in the amplitude of glacial–interglacial chlorite is observed at approximately 0.5 Ma.
As shown in Figure 4a, chlorite minerals in the 5–20 μm size fraction also have a pattern of glacial–interglacial cycles over the past 0.5 Ma, in agreement with magnetic susceptibility (Fig. 4d). The chlorite content is typically low, 1–2% on average in the fine-size fraction (5–20 μm) during each interglacial period, indicated by the magnetic susceptibility curve. In contrast, the glacial loess units (Marine Oxygen Isotope Stage [MIS] 2, MIS 6, MIS 8, MIS 10, and MIS 12) have an evident higher amount of chlorite minerals in the fine-size fraction (5–20 μm), ranging from 4% to 6%, threefold that in the interglacial periods.

Figure 4 (a) Comparison of the chlorite concentration in fine-size (red) versus coarse-size (gray) fractions with other geochemical parameters from loess deposits in the Lingtai section. Chlorite concentration in the fine versus coarse grain-size fractions in the Lingtai section, which is a proxy indicator for atmospheric circulation. Muscovite (this study) (b) and hornblende (c) (He et al., Reference He, Liu, Chen, Sheng and Ji2017) concentrations along the same section. (d) Magnetic susceptibility values (Chen et al., Reference Chen, Chen, Liu, Ji, Balsam, Sun and Lu2006). The values are generally low in glacial loess layers, but they increase abruptly in the interglacial paleosol layers. (e) Iron oxide index (IO index; this study), shown as red solid circles. (f) Goethite concentrations measured from the Lingtai section (Balsam et al., Reference Balsam, Ji and Chen2004), shown in purple. (For interpretation of the references to color in this figure legend, the reader is referred to the web version of this article.)
Figure 5 shows a spatial distribution of chlorite concentrations in samples from the seven deserts. Relatively high concentrations of chlorite minerals tend to occur toward desert basins near Mt. Qilian, including the Qaidam Desert (1.54–3.12%, average=2.13%, n=4), Badain Jaran Desert (3.22–4.67%, average=3.67%, n=4), and Tengger Desert (1.62–2.96%, average=2.22%, n=3). The Mu Us Desert (1.95–2.35%, average=2.15%, n=3) is proximal to the east bank of the Yellow River that transported a large amount of materials eroded from the northern Tibetan Plateau (Nie et al., Reference Nie, Stevens, Rittner, Stockli, Garzanti, Limonta and Bird2015). In contrast, a relatively low concentration is recorded toward the Taklamakan Desert (1.42–2.29%, average=1.89%, n=8) and Gurbantunggut Desert (1.13–1.69%, average=1.41%, n=2). The lowest value (0.01–2.45%, average=0.70%, n=6) is found in the Mongolian Gobi Desert. The CLP is situated downwind of these foreland desert basins and receives eolian dust from closer sources in the Mongolian Gobi and Mu Us Deserts along the north–south direction and more distant deserts on the northeastern Tibetan Plateau along a roughly west–east direction (Fig. 1). The desert-loess transitional area is thought to be the margin of monsoon rainfall. The CLP is located roughly parallel to the southern margin of the deserts, indicating a close relationship between the desert dust source and loess deposition (Ding et al., Reference Ding, Derbyshire, Yang, Sun and Liu2005). The deserts retreated northward during interglacial periods and expanded during glacial periods. In this context, the desert dust source area migration is causally connected with loess deposition. The amounts of chlorite in all the loess samples fall between deserts from the Mongolian Gobi Desert (0.01–2.45%) near Mt. Altay and the Badain Jaran Desert (3.22–4.67%) along Mt. Qilian.
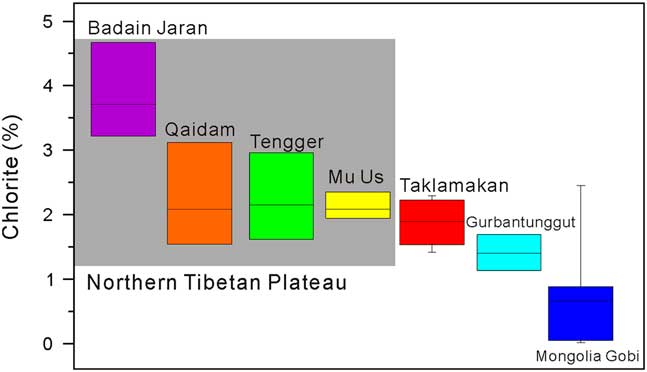
Figure 5 (color online) Spatial distribution of chlorite concentrations in the seven deserts studied here. Chlorite concentrations are shown for each individual desert. The box represents the two inner quartiles of data, and the whisker extends to the maximum and minimum data points. The horizontal line inside each box indicates the data average.
DISCUSSION
Possible effects on the chlorite record
A study on chlorite micromorphology indicated that ultrafine ferromagnetic inclusions were included in the chlorite grains, suggesting potential pedogenic alterations in part of these chlorite grains in the S8 paleosol (interglacial) layers (Yang et al., Reference Yang, Hyodo, Zhang, Maeda, Yang, Wu and Li2013) dated at approximately 0.85 Ma (Zhou et al., Reference Zhou, Beck, Kong, An, Qiang, Wu, Xian and Ao2014). Because the potential chlorite weathering products are ordinarily kaolinite and smectite and secondary iron oxides (Murakami, Reference Murakami1996; Carnicelli et al., Reference Carnicelli, Mirabella, Cecchini and Sanesi1997), a negative correlation in the concentrations between chlorite and the two groups of minerals would be expected. The amounts of chlorite minerals we measured here reached 3–4% (Fig. 3a) in most of the loess samples, double that in the paleosol samples (1–2%). As shown in Figure 4f, the concentrations of goethite (Balsam et al., Reference Balsam, Ji and Chen2004) are indeed negatively correlated with chlorite percentage—that is, lower levels of chlorite are associated with higher amounts of the secondary iron oxide minerals, particularly for the paleosol layers. However, the goethite concentrations display scaled variations (~0.4%) between the paleosol and loess samples for the last four glacial–interglacial cycles (Balsam et al., Reference Balsam, Ji and Chen2004) (Fig. 4f). Given that goethite is the most abundant secondary species of iron oxides and weathering products of chlorite minerals, postdepositional chemical weathering cannot account for the large chlorite concentration.
Variations in hornblende and muscovite minerals in the same profile provide further evidence that chemical weathering during diagenesis played a minor role in shaping the glacial–interglacial chlorite pattern. Our previous studies have shown that hornblende concentrations are between 0 and 2.5% over the past 1.2 Ma in the Lingtai section (He et al., Reference He, Liu, Chen, Sheng and Ji2017), a range equivalent to that of the chlorite concentration. However, the hornblende concentrations do not display glacial–interglacial changes (Fig. 4c). Given that hornblende minerals are more easily weathered than chlorite (Locke, Reference Locke1979; Michalski et al., Reference Michalski, Reynolds, Sharp and Christensen2004), our observation suggests that the chemical weathering was too weak to cause the large amplitude of chlorite concentrations in the glacial–interglacial cycles. On the other hand, muscovite is chemically stable, and our data show that a change in muscovite concentration bears a close resemblance to the chlorite record in glacial–interglacial cycles (Fig. 4b). As the physical properties of chlorite are similar to those of muscovite, it can be inferred that source changes and wind transportation were dominant factors in controlling the variations in chlorite concentration over time.
Modern and paleodust components may suggest that chlorite minerals likely resulted from long-distance atmospheric transport from the desert and Gobi dust sources in the interior of Asia. As revealed by a previous study, chlorite occurrence has an identical regional-scale feature in Asian dust (Blank et al., Reference Blank, Leinen and Prospero1985). Chlorite occurs in the clay-sized (<2 μm) and fine-silt (2–20 μm) fractions in the eolian dust, reaching the North Pacific along the coastal area of the western Pacific Ocean (Leinen et al., Reference Leinen, Prospero, Arnold and Blank1994). Therefore, this chlorite occurrence is an important signature of dust from the sources in the interior of Asia. Mineralogical studies of modern Greenland snow further revealed that this concentration of chlorite in Asian dust is characterized by extremely low kaolinite/chlorite (K/C) ratios (Bory et al., Reference Bory, Biscaye, Svensson and Grousset2002) similar to those obtained in the modern dust samples from the CLP (K/C: 0.35–0.65) (Biscaye et al., Reference Biscaye, Grousset, Revel, VanderGaast, Zielinski, Vaars and Kukla1997). The data range shows lower K/C ratios (0.34–0.81) for the cold, dustier stadial periods versus the warm, less dusty interstadial periods (0.70–1.21) (Biscaye et al., Reference Biscaye, Grousset, Revel, VanderGaast, Zielinski, Vaars and Kukla1997). Furthermore, the dust of the last glacial maximum has a much lower K/C ratio (0.38) than the Eemian dust (K/C ratio, 15.8) (Maggi, Reference Maggi1997). These lines of evidence suggest that changes in chlorite concentration in the loess profile essentially stem from shifts in atmospheric circulation patterns across the wind-deflatable source areas.
Control of changing atmospheric circulation
Our data show a significant abundance of chlorite minerals in the Badain Jaran, Qaidam, Tengger, and Mu Us Deserts, usually greater than 1.5% and less than 4.5% in mass (Fig. 5). The Badain Jaran, Tengger, and Qaidam Deserts are all located along the northern and southern flanks of Mt. Qilian. The chlorite minerals in these adjacent deserts may have originated from the topographic surface ready for erosion. The many Paleozoic rocks from a low-temperature metamorphic belt (Ji et al., Reference Ji, Chen and Lu1999) can serve as important sources (e.g., metamorphic greenschist and/or blueschist rocks along the northern Tibetan Plateau). The sediments in the Mu Us Desert are not all derived from Mt. Qilian; materials deposited in the west of this desert are from the upper reaches of the Yellow River, which flows through uplifted mountainous regions in the northern Tibetan Plateau (Stevens et al., Reference Stevens, Carter, Watson, Vermeesch, Andò, Bird, Lu, Garzanti, Cottam and Sevastjanova2013; Nie et al., Reference Nie, Stevens, Rittner, Stockli, Garzanti, Limonta and Bird2015). The sediments in the Taklamakan Desert are from more complicated and mixed lithological sources, as the desert materials are deposited from both the Kunlun Mountains and the Pamirs (Rittner et al., Reference Rittner, Vermeesch, Carter, Bird, Stevens, Garzanti and Andò2016). The Gurbantunggut Desert is located on the Central Asian Orogenic Belt (CAOB), with a huge amount of paleooceanic crust and eruptive basalts (Buchan et al., Reference Buchan, Pfänder, Kröner, Brewer, Tomurtogoo, Tomurhuu, Cunningham and Windley2002). The Mongolian Gobi is situated adjacent to Mt. Altay, belonging to the CAOB and resulting in a clearly different regional lithology from the northern Tibetan Plateau. Therefore, these desert basins, in contrast to those along Mt. Qilian, lack the ordinary chlorite parent rocks (e.g., greenschist and other petrologies).
Detrital zircon U-Pb age patterns suggested that the glacial loess materials consist of 65–100% from the northeastern Tibetan Plateau and 0–40% from Mt. Altay, as well as 0–35% material from the North China Craton (Zhang et al., Reference Zhang, Lu, Xu, Liu, Yang, Stevens and Bird2016). The intense erosion may produce the massive amount of silt particles along Mt. Qilian and Mt. Altay, which is available for eolian transport. The Mongolian Gobi Desert adjacent to Mt. Altay also makes a second contribution to chlorite minerals in the loess deposits. The North China Craton may not be a significant source for materials, considering that it is mainly composed of crystalline basement and has a relatively smaller erosion rate compared with the mountains. In this regard, chlorite minerals in loess deposits could be interpreted as the strong addition of materials eroded from the northern Tibetan Plateau, which is supported by Nd isotope studies (Li et al., Reference Li, Pettke and Chen2011). We hypothesized that the higher concentration of chlorite minerals in glacial dust material was caused by the enhanced strength and southward movement of westerly winds along the west–east path. This southward shift of atmospheric circulation caused dust provenance oscillations, including a large amount of materials from the northern Tibetan Plateau onto the loess deposits. Enhanced wind strength along the nearly west–east direction during the late Pleistocene is supported by the anisotropy of the magnetic susceptibility record of the Caotan loess–paleosol deposits from the northwestern CLP (Peng et al., Reference Peng, Ge, Li, Liu, Qi, Tan, Cheng, Deng and Qiao2015). In addition, an increased strength in atmospheric circulation during the cold glacial periods enabled the deflation and uplift of chlorite minerals to high topographic levels and a more distant transport along the west–east circulation pathway on a global scale seen even in Greenland ice records (Biscaye et al., Reference Biscaye, Grousset, Revel, VanderGaast, Zielinski, Vaars and Kukla1997). Here, we use “westerly” wind in the literal sense, which means a west–east wind, rather than the upper atmospheric winds associated with the jet stream. The latter are the westerlies circulation, which is different from what we refer to here.
The fine-grain fraction of chlorite minerals shows a more pronounced glacial–interglacial variation. At a stronger circulation strength (glacial periods), the chlorite concentration in the fine fraction (5–20 μm) further increases to 4–6%, which is higher than the 3–4% in the coarse fraction (20–100 μm). The higher concentration in the finer fraction could be interpreted as resulting from three possibilities. First, the fine chlorite particles adhering to the coarse particles in the proximal and remote deserts may be released because of stronger saltation. Changes in wind velocity may result in variable amounts of chlorite during saltation and transportation, which is supported by the muscovite record (Fig. 4b). Second, stronger wind strength during windier and colder climates may facilitate the dissembling of the chlorite aggregates into a flaky particle shape. This mechanism adds a significant concentration of chlorite minerals to the fine fractions. Third, enhanced atmospheric circulation via the nearly west–east direction and near-surface winds transported a larger volume of materials from the Badain Jaran, Tengger, Qaidam, and Mu Us Deserts along the northeastern Tibetan Plateau in which higher chlorite concentrations were found (Fig. 5).
The winter monsoon was associated with the westerly wind (Ding et al., Reference Ding, Liu, Rutter, Yu, Guo and Zhu1995, Reference Ding, Derbyshire, Yang, Sun and Liu2005; Porter and An, Reference Porter and An1995; Vandenberghe et al., Reference Vandenberghe, Renssen, van Huissteden, Nugteren, Konert, Lu, Dodonov and Buylaert2006; An et al., Reference An, Colman, Zhou, Li, Brown, Jull and Cai2012) via waxing and waning of the Northern Hemisphere ice sheets (Porter and An, Reference Porter and An1995; Sun et al., Reference Sun, Clemens, Morrill, Lin, Wang and An2012). Thus, using the proxies of both iron oxides and chlorite minerals, we can address the impact of the high-latitude climate on the East Asian monsoons. The chlorite record does not show a decreasing trend as revealed by the IO index obtained in this study (Fig. 4e), which is in good agreement with the previously reported goethite record (Fig. 4f). The secondary weathering-product record indicates that the Asian summer monsoon precipitation has decreased since the late Pleistocene (approximately 0.5 Ma). In contrast, the chlorite record suggests that the winter monsoons associated with a stronger atmospheric circulation have undergone a different evolution from the summer monsoons. By a simple model of the ice-sheet dynamics, we can explain the evolutionary East Asian summer and winter monsoons after 0.5 Ma compared with the overlapping path of the two monsoon regimes before this time. As shown in Figure 3, changes in the global ice volume show larger amplitudes in the late Pleistocene than in the preceding period. In modern monsoon dynamics, a colder climatic condition in the high-northern latitudes would enhance the winter Asian monsoons via dry/cold air downwind on the Eurasian continent (Gong et al., Reference Gong, Wang and Zhu2001), thus weakening the summer monsoon’s strength (Wen et al., Reference Wen, Graf and Ronghui2000). The enhanced winter monsoon (Ding et al., Reference Ding, Liu, Rutter, Yu, Guo and Zhu1995) associated with more penetrating westerly winds (Vandenberghe et al., Reference Vandenberghe, Renssen, van Huissteden, Nugteren, Konert, Lu, Dodonov and Buylaert2006) may have had a great impact on the transportation of chlorite minerals in the Badain Jaran, Tengger, Qaidam, and Mu Us Deserts along the west–east pathway. Our hypothesized reorganization of the atmospheric circulation can be further supported by a decoupled change in the magnetic susceptibility and grain-size record approximately 410 ka in the S4 paleosol layer in the central CLP (Hao et al., Reference Hao, Wang, Oldfield, Peng, Qin, Song, Xu, Qiao, Bloemendal and Guo2012). The fundamental change in glacial conditions had a profound impact on East Asian monsoon climates (Jansen et al., Reference Jansen, Kuijpers and Troelstra1986; Farrell and Prell, Reference Farrell and Prell1989), leading to the different evolution of summer and winter monsoons we observed here.
CONCLUSIONS
Our data show a significant difference in the chlorite concentration between the glacial loess (3–4%) and interglacial paleosols (1–2%) along the Lingtai profile in the central CLP. Furthermore, we observed more pronounced variations in the fine-size fraction (5–20 μm) than in the large-size fraction (20–100 μm) in terms of the chlorite concentration along the same stratigraphic profile. Based on changes in the secondary weathering products of chlorite observed here (the IO index) and those previously studied (Balsam et al., Reference Balsam, Ji and Chen2004), together with a comparison of the two mineral records of the easily weathered hornblende and chemically stable muscovite we measured, we suggest that the glacial–interglacial oscillations of chlorite concentrations were likely controlled by changes in atmospheric circulation patterns and in dust provenance shifts instead of chemical weathering during loess diagenesis. Further investigations of the spatial distribution of chlorite concentration in the potential desert basins in North China and the Mongolian Gobi would increase our understanding of the reorganization of atmospheric circulation during alternations of glacial and interglacial climate conditions. A higher chlorite content in several deserts near Mt. Qilian than in the other desert basins might imply that atmospheric circulation along the west–east transport pathway played a crucial role in shaping the glacial/interglacial chlorite patterns. Several wind strength factors (saltation and transportation) associated with changing atmospheric circulation have been invoked to explain the pronounced change in the fine-size fraction along the same profile in the glacial/interglacial cycles. Using the proxies of both the IO index and our chlorite record, we further discuss possible forcing mechanisms for the evolution of different summer and winter monsoon patterns in the past 0.5 Ma. That is, the great impact of the high northern ice sheets may be a dominant control of the long-term trend of the East Asian monsoon climates.
ACKNOWLEDGMENTS
Constructive comments from the associate editor and two anonymous reviewers have greatly improved the manuscript. This work is supported by the National Science Foundation of China (grant nos. 41230526, 41303071, and 41730101).
SUPPLEMENTARY MATERIALS
To view supplementary material for this article, please visit https://doi.org/10.1017/qua.2018.1


