


Introduction
Soil development and primary succession on deglaciated terrain have been extensively studied following the worldwide tendency of glaciers to retreat after the “Little Ice Age” (LIA) episode of glacial expansion (Matthews Reference Matthews1999). The rapid colonization of ground exposed by snow and ice recession is also associated with recent climate amelioration and the rapid decreases in glacial extent in the Maritime Antarctic (Convey & Smith Reference Convey and Smith2006). Such rapid colonization by pioneer mosses and lichens, which constitute most Antarctic vegetation, has been reported from several localities, including Livingston and Robert islands in the South Shetland Islands (Sancho & Valladares Reference Sancho and Valladares1993, Sancho & Pintado Reference Sancho and Pintado2004), Signy Island in the South Orkney Islands (Smith Reference Smith1995), Galindez and Corner islands in the Argentine Islands (Corner & Smith Reference Corner and Smith1973) and Anvers Island (Smith Reference Smith1982), the latter two locations off the Antarctic Peninsula. The early stage of the colonization process has been correlated with duration of snow cover, rock size, nature of terrain and nitrogen supply as principal regulating factors (Corner & Smith Reference Corner and Smith1973, Smith Reference Smith1995, Valladares & Sancho Reference Valladares and Sancho1995). However, the investigation of vegetation along longer (centuries to millennia) chronosequences on glacier forelands may clarify more advanced stages of the succession (Matthews Reference Matthews1999) and could highlight possible future scenarios following more dramatic climate evolution. Such studies are more common in the Northern Hemisphere where many have also focused on the lichen and bryophyte components (e.g. Fahselt et al. Reference Fahselt, Maycock and Svoboda1988, Okitsu et al. Reference Okitsu, Minami and Kanda1998, Jones & Henry Reference Jones and Henry2003), but few studies have examined the ecology of glacier forelands in the Southern Hemisphere. Although primary succession has been quantitatively examined in several sub-Antarctic islands (Frenot et al. Reference Frenot, Gloaguen, Cannavacciuolo and Bellido1998, Lewis Smith Reference Lewis Smith2000 and references therein) and, qualitatively, on the Antarctic Peninsula (Smith Reference Smith1982, Reference Smith1996, Cannone & Guglielmin Reference Cannone and Guglielmin2003), to our knowledge primary succession of lichens and mosses has not been quantitatively characterized in deglaciated areas of the Maritime Antarctic in the context of recent glacial history.
Signy Island (South Orkney Islands) is one of the most intensively studied areas of the Maritime Antarctic in relation to its bryophyte and lichen vegetation. It hosts the most diverse flora of any small site within the Antarctic biome (Smith Reference Smith2007), and its glacial evolution during the middle and upper Holocene has been established by proxy data (Smith Reference Smith1990, Jones et al. Reference Jones, Hodgson and Chepstow-Lusty2000, Guglielmin et al. Reference Guglielmin, Boschi, D'Agata, Ellis-Evans and Worland2008). The present paper aims to quantitatively characterize primary succession on Signy Island by analysing lichen and bryophyte diversity and abundance in different zones of a glacial valley corresponding to different ages of deglaciation. Colonization dynamics and the environmental factors controlling them are also discussed and compared with chronosequence analyses of deglaciated terrains of other (sub-) polar areas and with vegetation changes in Antarctica.
Methods
Study site
Signy Island (60°43′S, 45°38′W) is characterized by a cold oceanic climate, with a mean annual air temperature of around -3.5°C, mean monthly air temperatures above 0°C for up to three to four months each summer, and annual precipitation of c. 400 mm, primarily in the form of summer rain (Guglielmin et al. Reference Guglielmin, Boschi, D'Agata, Ellis-Evans and Worland2008). The bedrock is mainly quartz-mica-schist, although marbles and amphibolites locally outcrop (Smith Reference Smith2007). The soils are mainly gelisols, and continuous permafrost occurs with an active layer ranging between 40 cm and 2 m in depth (Guglielmin et al. Reference Guglielmin, Boschi, D'Agata, Ellis-Evans and Worland2008). Ice-free areas are extensively colonized by lichens and bryophytes with sparse but increasing occurrence of the two native Antarctic vascular plants, Deschampsia antarctica Desv. and Colobanthus quitensis (Kunth) Bartl. (Smith Reference Smith1972, Reference Smith1994, Cannone et al. unpublished).
On the basis of the radiocarbon ages of re-exposed moss peat (Fenton Reference Fenton1982), Smith (Reference Smith1990) postulated a series of reconstructions of the ice cover on Signy Island over the past 7000 years, while a partially different Holocene glacial evolution is supported by more recent palaeolimnological and geomorphological studies (Jones et al. Reference Jones, Hodgson and Chepstow-Lusty2000, Guglielmin et al. Reference Guglielmin, Boschi, D'Agata, Ellis-Evans and Worland2008). However, it is generally accepted that there were several glacial fluctuations over the last 1500 years, with the last most important glacial expansion (LIA) taking place between 1720 and 1750 ad according to the palaeolimnological profiles reported by Jones et al. (Reference Jones, Hodgson and Chepstow-Lusty2000). Previous reconstructions suggested an earlier LIA age, commencing around 1600 ad, with other minor episodes possibly over the last 300 years (Smith Reference Smith1990). Evidence for several minor glacial fluctuations can be seen, especially in Moraine Valley and along the eastern coast of the island, during the second half of the 20th century (Smith Reference Smith1990, Reference Smith2007). These are most probably related to the recorded progressive increase in air temperature in this region of 2 ± 1°C over the last 100 years (Convey & Smith Reference Convey and Smith2006).
Sampling procedure and identification of taxa
Three main zones, named X, Y, Z, each including different subzones, were defined in the north facing Moraine Valley between 20 m and 100 m a.s.l., according to geomorphological features and the different limits of the glacial ice cover postulated by Smith (Reference Smith1990) and Guglielmin et al. (Reference Guglielmin, Boschi, D'Agata, Ellis-Evans and Worland2008) (Figs 1 & 2a). Two recent frontal moraines and the lateral moraine of McLeod Glacier are included in zone X. The upper frontal moraine began to appear around 1990 and was fully exposed by 2000 (X1). The lower one was already well formed in 1964, as depicted by British Antarctic Survey archive photographs, but it was only partially exposed until the late 1970s, becoming prominent by around 1980 (X2) (Fig. 2b–j). The ridge and external side of the lateral moraine (X3) was most affected by glacial episodes after the LIA (Guglielmin et al. Reference Guglielmin, Boschi, D'Agata, Ellis-Evans and Worland2008), becoming very prominent from mid-1980s onwards, while the internal side (X4) is characterized by persistent snow cover which usually melts out only by late summer (Fig. 2i).. Zone Y includes the upper (Y1) and middle (Y2) parts of Moraine Valley, completely located below a prominent trim line on the eastern slopes marking the maximum height that the glacier reached during the LIA (Smith Reference Smith1990, Guglielmin et al. Reference Guglielmin, Boschi, D'Agata, Ellis-Evans and Worland2008). The lower coastal part of the glacial valley and of its lateral moraine, where pioneer communities were surveyed in the early phytosociological examination of Signy vegetation (Smith Reference Smith1972), was not studied here as it is now intensively invaded by fur seals (Arctocephalus gazella Peters, 1875), which significantly affect lichen and moss vegetation (Smith Reference Smith1988, Favero-Longo et al. Reference Favero-Longo, Cannone, Worland, Convey, Piervittori and Guglielmin2011). Zone Z, completely located above the LIA trim line, includes the area glaciated during the Last Glacial Maximum or one of the late glacial episodes during the Pleistocene (Guglielmin et al. Reference Guglielmin, Boschi, D'Agata, Ellis-Evans and Worland2008). Two subzones differ from each other in their geomorphological characteristics: one (Z1) is characterized by active stone-banked lobes developed along a gentle northern exposed slope, while the other (Z2) is a knob surface mantled by till with large blocks. Within each subzone, eight 1 m2 plots were defined by randomly drawing geographical co-ordinates determined by a GPS (Garmin 12), and surveyed in the period January–February 2009 for their lichen and bryophyte vegetation by visually estimating species abundance as percentage cover (Will-Wolf et al. Reference Will-Wolf, Scheidegger and McCune2002). Samples of lichens collected from the plots were identified in the laboratory following Øvstedal & Lewis Smith (Reference Øvstedal and Lewis Smith2001) and monographic descriptions. Samples of bryophytes were identified in the laboratory following Bednarek-Ochyra et al. (Reference Bednarek-Ochyra, Váňa, Ochyra and Lewis Smith2000) and Ochyra et al. (Reference Ochyra, Lewis Smith and Bednarek-Ochyra2008). Specimens of all lichens and bryophytes referred to here are held in the herbarium of the University of Torino (TO). Aspect (AS), slope (SL) and degree of surface stoniness (% occurrence of fragments larger than coarse gravel, SS) were determined for each plot (Table I). Terrain age (TA) and duration of snow cover (SD) were categorized for each subzone according to the above described reconstruction of the glacial history and on the basis of available photographic material (no direct measurements were available) (Table I).

Fig. 1 Map of Moraine Valley, Signy Island. Extent of McLeod and Orwell Glaciers in 2004 ad (dark grey), areas exposed by glacier retreat after c. 1850–1930 (middle grey, including subzones X1-4), c. 1600–1750 (light grey, including subzones Y1-2), c. 3000 bc or before (white, including subzones Z1-2). Glacier boundaries as suggested by Smith (Reference Smith1990).
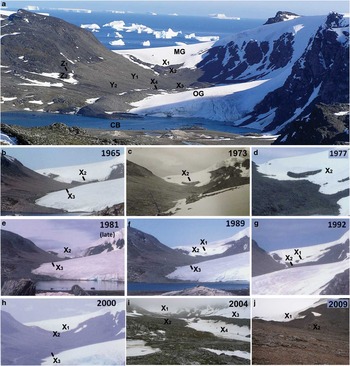
Fig. 2 Moraine Valley, Signy Island. a. View of Moraine Valley looking south (MG = McLeod Glacier, OG = Orwell Glacier, CB = Cemetery Bay) (December 2004). b–j. Emergence of the two frontal moraines of McLeod Glacier in the upper Moraine Valley in the period 1965–2009. Note that the amount of moraine(s) visible is dependent on the time in summer when the photos were taken and that in some years snow lie persisted later relating to the previous winter's snow accumulation, date of spring thaw and summer temperature. i. Persistent snow cover on the inner side of McLeod lateral moraine (subzone X4).
Table I Classification into categories of the environmental variables (sz. = subzone, c.p. = cardinal points). a, 1 = terrain deglaciated after 1990; 2 = terrain affected by glacial episodes after the Little Ice Age (LIA), but almost certainly deglaciated before 1980; 3 = terrain deglaciated after the glacier retreat following the LIA; 4 = terrain deglaciated since Late Glacial Maximum. b, 1 = terrains in relief or closer to the sea, subjected to the shortest snow cover duration, 2 = terrain not in relief and not exposed to snow accumulation, subjected to an average snow cover duration, 3 = north-facing, depressed terrains subjected to snow accumulation and, consequently, to a long snow cover duration, 4 = south-west-facing terrain, subjected to snow accumulation and, consequently, to a very long snow cover persistence.

Vegetation data processing
Relevé data were used for each subzone to compute: a) species-richness (alpha diversity), providing the intra-plot diversity, b) richness of species with distinct world distribution patterns (following Øvstedal & Lewis Smith Reference Øvstedal and Lewis Smith2001 for lichens, Bednarek-Ochyra et al. Reference Bednarek-Ochyra, Váňa, Ochyra and Lewis Smith2000 and Ochyra et al. Reference Ochyra, Lewis Smith and Bednarek-Ochyra2008 for bryophytes, although further taxonomic changes may well still be made in this field as more material, and particularly molecular analyses, become available), c) richness of species with different reproduction patterns or reproductive conditions (following Øvstedal & Lewis Smith Reference Øvstedal and Lewis Smith2001 for lichens, Bednarek-Ochyra et al. Reference Bednarek-Ochyra, Váňa, Ochyra and Lewis Smith2000 and Ochyra et al. Reference Ochyra, Lewis Smith and Bednarek-Ochyra2008 for bryophytes), d) species density (mean species-richness per plot), and e) beta diversity (sensu Harrison et al. Reference Harrison, Ross and Lawton1992), to quantify species diversity partitioning within and among plots. In particular, beta-1 and beta-2 diversity were computed on the basis of plot results as follows:
A matrix of presence/absence at the plot level of species occurring in at least 10% of plots was used to perform: a) the classification of plots and species (UPGMA, Anderberg2 as dissimilarity coefficient, arbitrary resolution of ties) (Podani Reference Podani2001), and b) ordination of plots on the basis of species data using principal co-ordinate analysis (PCA: scaling on inter-species correlations, centring species by species) (Ter Braak & Šmilauer Reference Ter Braak and Šmilauer2002).
All species were discriminated on the basis of their appearance/disappearance in the different zones as pioneer (occurring in zone X only or in zones X and Y), early successional (occurring in zone Y only), early–late successional (occurring in zone Y and Z), late successional species (occurring in zone Z only), ubiquitous (occurring in all the zones).
The matrices of species presence/absence and environmental variables were used to analyse the species environmental relationships at the plot level through a canonical correspondence analysis (CCA), which partitions variation explained by each variable and constructs a model of significant variables (CCA using biplot scaling for inter-species distances, Hill's scaling for inter-sample distances; choosing forward selection of variables option; performing Monte Carlo permutation test on the first and all ordination axes) (Ter Braak & Verdonschot Reference Ter Braak and Verdonschot1995).
Classification analyses were performed using SYN-TAX 2000 - Hierarchical Classification (Podani Reference Podani2001), while ordinations were performed using CANOCO 4.5 (Ter Braak & Šmilauer Reference Ter Braak and Šmilauer2002).
Results
Variability and abundance of lichens and bryophytes
Zones X, Y and Z significantly differed in lichen and bryophyte colonization both in terms of cover values and species diversity, as might be expected considering their different glacial history and environmental features. A tenfold lower total cover value characterized zone X (mean 3.4%) with respect to zone Y (mean 36.7%), which showed about half the value of zone Z (mean 75.9%). The analysis of the different subzones, however, highlighted a more gradual change from the traces of plant life recorded on the most recently originated and reworked moraine (X1, mean 0.2%) and the almost continuous cover of the stable knob external to the glacial valley (Z2, mean 83.6%) (Fig. 3). Total alpha diversity as well as the total number of species per plot also increased from the more recent to the older deglaciated terrains (Fig. 4). This trend was mainly explained by saxicolous and terricolous lichens, and was not apparent for bryophytes.

Fig. 3 Lichen and moss cover (%) in the different subzones of Moraine Valley. Data are expressed as average cover values of saxicolous and terricolous lichens and bryophytes in the eight plots examined in each subzone (X1-4, Y1-2, Z1-2). According to Tukey's test, columns (considered separately for each biological component and in total) are statistically different where they do not share any letter (P < 0.05).

Fig. 4 Alpha diversity and species density in the different subzones of Moraine Valley. a. Total number of saxicolous and terricolous-muscicolous lichen species and of bryophyte species detected in each subzone (X1-4, Y1-2, Z1-2). b. Species density per plot of saxicolous and terricolous-muscicolous lichens and of bryophytes in each subzone (X1-4, Y1-2, Z1-2). According to Tukey's test, columns (considered separately for each biological component and in total) are statistically different where they do not share any letter (P < 0.05).
Mosses were the first pioneers in subzone X1 (five species), while saxicolous lichens displayed higher alpha diversity and species density and a greater contribution to the total cover in the other subzones of zone X. The external side of the lateral moraine (X3), including the ridge, displayed richer colonization than the internal side (X4) and more closely approximated the alpha diversity pattern of the glacial valley (zone Y). Saxicolous lichens showed higher alpha diversity and species density than the other two biological groups in zone Y, mainly contributing with terricolous lichens to the cover of the upper glacial valley (Y1). In the lower part of the valley (Y2), total cover was mainly contributed by mosses >> terricolous lichens > saxicolous lichens. A dominant moss cover particularly characterized zone Z, with a minor presence of muscicolous-terricolous lichens, mainly in the stable zone Z2, and of saxicolous lichens, despite their having the highest alpha diversity. Saxicolous lichens showed the highest alpha diversity throughout the survey (52 species), mostly displaying a higher number of species of southern Southern Hemisphere distribution (mainly Antarctic endemics) in zones X and Y and a higher number of more widely distributed species (i.e. bipolar and cosmopolitan) in zone Z (Table II). Terricolous-muscicolous lichens (19 species) mostly included widely distributed species. In the case of bryophytes (21 species), widely distributed species strongly prevailed in subzones X1-2, while species having a Southern Hemisphere distribution were abundant in the other subzones.
Table II Abundance and variability of lichen and bryophyte vegetation in the different subzones of Moraine Valley.

*reported in Antarctic with fertile sporophytes.
Lichens having prevalent sexual reproduction (i.e. with ascocarps) prevailed in terms of specific diversity with respect to lichens displaying predominantly asexual reproduction (i.e. with vegetative propagules such as soredia and isidia, or propagating through thallus fragmentation) (Table II). However, considering specific contributions to the total coverage, a different pattern can be recognized in two out of four subzones of the youngest zone (X), lichens possessing prevalent asexual reproduction being significantly more abundant. A slightly higher diversity of bryophytes known for sporophyte production in the (Maritime) Antarctic characterized zone X and subzone Y1, while species not known to produce sporophytes prevailed in zone Z and subzone Y2.
The values of beta-1 and beta-2 diversity calculated in the overall survey across all vegetation components were 11.9 and 3.1 (beta-1/beta-2 = 3.8), with terricolous lichens exhibiting lower values of beta-1 (10.3) and beta-2 (1.2) diversity (i.e. a lower compositional heterogeneity) with respect to saxicolous lichens (beta-1 = 13.3, beta-2 = 3.9) and bryophytes (beta-1 = 10.7, beta-2 = 3.2). Higher values of beta-1 diversity and beta-1/beta-2 ratios, indicating a higher compositional heterogeneity, characterized zone X with respect to zones Y and Z, both when beta diversity values were calculated for the total vegetation (including saxicolous, terricolous-muscicolous lichens and bryophytes) or separately for the three different vegetation components (Table II).
Synecology
The classification of plots on the basis of the specific presence/absence data allowed the separation of two main groups: group M, including plots in zone X, and group N, including those in zones Y and Z (Fig. 5a). Within group N, all relevés of subzone Z2 clustered in a subgroup (N2) distinguished at the 46% dissimilarity level, while those of subzones Z1, Y1 and Y2 were mixed together in another subgroup (N1).

Fig. 5 Classifications of a. plots, and b. species on the basis of specific presence/absence data through the overall survey. Species are differently marked according to their discrimination as pioneer (yellow), early–late successional (light-blue), late successional (green) and ubiquitous (orange) species (see Table III). Species abbreviations are listed in Table III. Cophenetic correlation: a = 0.7844, b = 0.8219.
Based on the dendrogram results, within the succession it is possible to discriminate between pioneer, early successional and late successional species, and species able to persist from the initial to the oldest stages (ubiquitous), both for mosses and lichens (Table III). The succession starts with the arrival of some pioneer species, colonizing the youngest surfaces (X1–X4) and disappearing in the more mature stages (Y and/or Z), with dominance by the mosses Bryum archangelicum, B. pseudotriquetum, Syntrichia saxicola and the nitrophilous lichens Acarospora macrocylos, Buellia isabellina and Caloplaca sublobulata. Some species appear very early in the succession (X1) and remain throughout, such as Sanionia georgicouncinata, Usnea antarctica and Cephaloziella varians. Lecanora polytropa, Porpidia austroshetlandica and Fuscidea sp. B show a similar behaviour, appearing on some of the youngest surfaces (X2 and/or X3), where they show their highest cover contribution, and persisting in all stages with relatively high coverage.
Table III Specific abundance in the different subzones of Moraine Valley. Species are listed according to their frequency and cover throughout the plots surveyed. Legend: abb. = species abbreviation (species occurring in at least 10% of plots are marked in colour); component (r = saxicolous lichen, t-m = terricolous-muscicolous lichen, br = bryophyte); w.d. = world distribution (E = Antarctic endemic or Antarctic-sub-Antarctic endemic, Cos = cosmopolitan, Bip = bipolar, SSH = southern Southern Hemisphere distributed, including Magellanic); rep. = prevailing lichen reproduction (fr = thalline fragmentation, isi = isidia, pc = phyllocladia, s = spores, sor = soredia, ts = thallospores) and documented bryophyte reproductive state (pr = with vegetative propagules, sex = sexually fertile, st = sterile). na = number of subplots including the species; %b = specific contribution to the total cover (%); %c = specific cover with respect to the total surveyed surface (%). *covers by Andreaea gainii and A. depressinervis, occasionally occurring in zones Y and Z, were combined with those of the extremely common A. regularis.

Many other ubiquitous species showed their highest cover contribution on the intermediate aged terrains of zone Y (Pannaria hookeri very often intermixed with Coelopogon epiphorellum and Lecanora aff. orosthea in both Y1 and Y2, Sanionia georgicouncinata and Frutidella caesioatra in Y1, Ochrolechia frigida, Ditrichum hyalinum and Buellia perlata in Y2), where they are the dominant colonizers together with the early and late successional species Andreaea regularis, Carbonea assentiens and Bellemerea sp. A (occurring only in zones Y and Z).
Andreaea regularis (± A. depressinervis and A. gainii) dominates zone Z, with the early and late successional Polytrichum strictum, Himantormia lugubris, Chorisodontium aciphyllum, Bellemerea sp. A and, again, the ubiquitous Sanionia georgicouncinata and Buellia perlata, as the main codominants, and some late successional species (exclusive to zone Z), mainly muscicolous lichens (Cladonia sp. pl., Sphaerophorus globosus, Cetraria aculeata) as companions.
The classification of species on the basis of presence/absence data similarly separated pioneer species (A) and the remainder (B) (Fig. 5b). Within cluster B, cluster B1 included early–late successional and ubiquitous species which were dominant in zone Y, while cluster B2 included early–late successional and ubiquitous species which mainly occurred in zone Z together with the late successional species (exclusive of zone Z). Similar classifications of plots and species were obtained by processing the full presence/absence dataset, including low frequency species (occurring in < 10% of plots, see Supplemental material).
The PCA extracted four components, which explained 56.6% of the total variance and ordinated the clusters of plots already identified in the specific presence/absence data (Fig. 6). Pioneer species were negatively correlated with the first axis (30.8% of the total variance), while the other species vectors were continuously distributed on the right side of the diagram: early and late successional species, with three exceptions (Himantormia lugubris, Polytrichum strictum and Catillaria contristans), were negatively correlated with axis 2 (13.1%), while late successional species, exclusive of zone Z, showed positive correlations. Accordingly, the first axis separated the plots in zone X (cluster M) and the plots in zones Y and Z (cluster N), while the second axis separated the plots in subzones Y1, Y2 and Z1 (clusters N1 and N3) from those in subzone Z2 (cluster N2). The positive or negative correlations of the ubiquitous species with axis 2 highlighted their relative dominance in the different zones and subzones. A similar pattern was also obtained by ordinating the plots on the basis of specific cover data, particularly stressing Pannaria hookeri and Andreaea regularis as dominant species of zones Y and Z, respectively (PCAcover, see Supplemental material).

Fig. 6 Ordination of plots on the basis of the specific presence/absence data (PCA). Species are differently marked according to their discrimination as pioneer (yellow), early–late successional (light-blue), late successional (green) and ubiquitous (orange) species (see Table III). Species abbreviations are listed in Table III. Plot symbols (see Fig. 4a): white (X1), light grey (X2), dark grey (X3), black (X4) triangles; light blue (Y1) and dark blue (Y2) circles; light green (Z1) and dark green (Z2) squares.
The CCA extracted four axes which accounted for only 22.7% of species data, but for 94.7% of species-environmental relationships (Fig. 7). All canonical axes were significant (Monte Carlo test, P-value = 0.002). The first axis (64.4% of species-environmental correlation) was characterized by the terrain age (weighted correlation -0.87), which was the environmental factor exhibiting the higher conditional effect according to forward selection (F-value 8.50, P-value = 0.002). Surface stoniness (F-value 2.06, P-value = 0.006) and snow duration (F-value 1.85, P-value = 0.020) also showed significant conditional effects. Pioneer, early–late successional and late successional species scattered separately along the first axis following the different ages of the colonized terrains. Pioneer species showed a strong positive correlation with surface stoniness, while early–late successional species showed a negative correlation. Late successional species were negatively correlated with the snow duration. Ubiquitous species sparsely scattered according to their different frequency on differently aged terrains: ubiquitous species abundant in zone X (Porpidia austroshetlandica, Lecanora polytropa and Cephaloziella varians) showed a high positive correlation with surface stoniness, while those which dominated zone Y (Pannaria hookeri and Sanionia georgicouncinata) were positively correlated with snow duration and negatively with surface stoniness. Mosses (Bucklandiella sudetica, Ditrichum hyalinocuspidatum) and muscicolous lichens (Ochrolechia frigida, Frutidella caesioatra and Stereocaulon alpinum) which are frequent in both zone Y and Z were negatively correlated with both surface stoniness and snow duration.

Fig. 7 Factorial maps in the canonical correspondence analysis (CCA) showing the position of lichen species and contributions of environmental features (TA = terrain age, SD = snow duration, SS = surface stoniness, SL = slope, AS = aspect on axes 1 and 2). Species are differently marked according to their discrimination as pioneer (yellow), early–late successional (light-blue), late successional (green) and ubiquitous (orange) species (see Table II). Species abbreviations are listed in Table III. Plot symbols (see Fig. 4a): white (X1), light grey (X2), dark grey (X3), black (X4) triangles; light blue (Y1) and dark blue (Y2) circles; light green (Z1) and dark green (Z2) squares.
Discussion
Studies on primary cryptogamic succession in extreme cold environments have to date dealt mainly with high Arctic systems, and have shown that directional succession without species replacement and non-directional succession prevail in polar-desert environments, although directional-replacement succession is possible under favourable local conditions (Jones & Henry Reference Jones and Henry2003). The current analyses of lichen and bryophyte diversity and abundance in Moraine Valley characterize different stages in the vegetation community succession on Signy Island (Maritime Antarctic) in zones which have been deglaciated at different times. The directional succession mode on Signy is characterized by a general trend towards increased species diversity and plant cover over time, with moderate changes in species composition.
Principal co-ordinate analysis and CCA show that clusters of pioneer, early and late successional species separate the surveyed plots along the gradient of terrain age, which is the factor exhibiting the higher conditional effect in forward selection. However, only pioneer mosses and nitrophilous lichens completely disappear in early and late successional stages, while other species, once established, are able to persist to the oldest successional stages, as displayed by the continuous distribution of species vectors in the right side of the PCA diagram. The poor species replacement is also suggested by the low beta-1 values calculated in the overall survey for the different vegetation components (both together or separately) and the decreasing beta-1 diversity values and beta-1/beta-2 ratios with diversity increasing in oldest successional stages (see Harrison et al. Reference Harrison, Ross and Lawton1992).
The clustering of plots of subzone Z1 with those of the more recently deglaciated zone Y, and not with those of subzone Z, which is thought to have been ice-free for the same length of time (Smith Reference Smith1990), indicates that other factors, rather than the glacial history alone, control the species composition. Accordingly, CCA indicates surface stoniness and snow accumulation as other environmental factors exhibiting significant conditional effects. A similar influence on primary succession of very local-scale environmental conditions is also repeatedly highlighted in studies of colonization by both cryptogamic and phanerogamic vegetation in high Arctic sites (Tishkov Reference Tishkov1986, Fahselt et al. Reference Fahselt, Maycock and Svoboda1988, Okitsu et al. Reference Okitsu, Minami and Kanda1988, Jones & Henry Reference Jones and Henry2003), and microclimate shifts are thought to underlie moderate recent changes in vegetation patterns reported for a site in the continental Antarctic (Melick & Seppelt Reference Melick and Seppelt1997). Surface stoniness has been shown to condition vegetation patterns in arctic-alpine environments (Cannone & Gerdol Reference Cannone and Gerdol2003, Sedel'nikova & Sedel'nikov Reference Sedel'nikova and Sedel'nikov2009). Lichen diversity typically increases with distance away from snow patches, fast growing species being less resistant to snow-kill (Golledge et al. Reference Golledge, Everest, Bradwell and Johnson2010). Different substratum stability on the knob surface of Z2 subzone and on the gentle slope of Z1, displaying gelifluction features, is probably another local environmental factor determining divergence in vegetation composition (Cannone et al. Reference Cannone, Guglielmin and Gerdol2004).
Mosses (mainly Bryum spp.) and nitrophilous lichens (e.g. Acarospora macrocylos, Caloplaca sublobulata) are both reported as first pioneer colonizers in Polar Regions of recently exposed surfaces a few years or decades after deglaciation (Corner & Smith Reference Corner and Smith1973, Smith Reference Smith1982, Fahselt et al. Reference Fahselt, Maycock and Svoboda1988, Sancho & Valladares Reference Sancho and Valladares1993, Lewis Smith Reference Lewis Smith2000). Approximately two hundred years are suggested to be required between early colonization and the climax of Andreaea-Usnea communities on the dry and exposed rocky habitats of Signy Island (Lindsay Reference Lindsay1978), while the final stages of primary succession in the high Arctic are suggested to exceed 1000 years (Tishkov Reference Tishkov1986). In the current study, mosses (mainly Bryum archangelicum) first develop very sparse cover (< 0.2%) on moist detritus in pockets between boulders in subzone X1 where the terrain became deglaciated after 1990 and has been partially and more recently reworked.
The occurrence of nitrophilous (ornithocoprophilous) saxicolous lichens characterizes the other subzones of zone X, which are known to have been deglaciated for more than 30 years and less than 80–160 years. It is also noteworthy that nitrophilous lichens were exclusive colonizers of recent moraines (34 years old) in the South Shetland Islands (Sancho & Valladares Reference Sancho and Valladares1993), but they took at least 80 years to establish after glacial recession on Arctic Ellesmere Island (Fahselt et al. Reference Fahselt, Maycock and Svoboda1988). Their contribution to the total vegetation cover in zone X was subordinate to that of sorediate lichen species, mainly the Antarctic endemic Porpidia austroshetlandica. This finding supports the importance of vegetative reproduction in the colonization of new sites by lichens (Smith Reference Smith1995 and references therein) and is consistent with the dominance of soredia over ascospores in the airspora over Signy Island (Marshall Reference Marshall1996).
Sporadic high cover values in subzones X2 (up to 19%) and X3 (up to 39%) indicate that locally rapid lichen colonization is possible in the Antarctic (see Sancho & Pintado Reference Sancho and Pintado2004), while high variability in cover values between the different subzones (X2-X3 vs X4) suggests that contingent factors, such as the duration of the snow cover (Valladares & Sancho Reference Valladares and Sancho1995, Sancho & Valladares Reference Sancho and Valladares1993), significantly affect the dynamic processes of local colonization after the glacial retreat. On the other hand, high cover variability within the same subzone (e.g. from 0–39% in subzone X3) and high values of beta diversity, indicating high heterogeneity in species composition among plots, are suggestive of a high stochasticity in species establishment in the early successional stages.
The main valley area, where deglaciation followed the LIA, suggested to be around 1600 or 1750 ad depending on different reconstructions (Smith Reference Smith1990, Jones et al. Reference Jones, Hodgson and Chepstow-Lusty2000), is characterized by extensive communities of Pannaria hookeri, a species which usually colonizes stones and gravelly soils of unstable, moist solifluction areas (Øvstedal & Lewis Smith Reference Øvstedal and Lewis Smith2001). High covers by some of the most common saxicolous lichens on the island (e.g. Lecanora polytropa, Carbonea assentiens) and by the mosses Andreaea regularis and Sanionia uncinata mainly mark the upper (Y1) and the lower (Y2) subzones, respectively. This type of vegetation also characterizes higher altitude areas on the island, which were analogously glaciated during the LIA (Smith Reference Smith1990, Reference Smith2007), and also the subzone Z1, which is thought to have been ice-free since the Last Glacial Maximum, but experiences unfavourable environmental conditions (see above). A more mature vegetation stage characterizes other areas of Signy Island with the same altitude, distance from the sea, lithic substrate and orientation as the main valley area here (zone Y), but which are thought to have been ice-free since Last Glacial Maximum (e.g. North Point, Smith Reference Smith1990, Reference Smith2007). This mature vegetation stage was only found in Moraine Valley on the Z2 knob, where muscicolous, fruticose lichens (Cladonia sp. pl., Cetraria aculeata, Sphaerophorus globosus, Stereocaulon alpinum) grow on extensive bryophyte cushions on and between rocks, including A. depressinervis, Polytrichum strictum and Chorisodontium aciphyllum. Smith (Reference Smith1972) suggested that the possible origin of these Polytrichum strictum-Chorisodontium aciphyllum communities was through the invasion of stands of Andreaea (mainly A. depressinervis) and/or Sanionia uncinata s.l. by C. aciphyllum followed by P. strictum and finally by an assortment of fruticose lichens. Such a sequence of events may have occurred on the long exposed and stable Z2 knob, while it is likely to have been prevented by local environmental factors in the Z1 subzone, and has still not occurred 250–400 years after deglaciation in zone Y.
Population sizes of the two native vascular plants (Deschampsia antarctica and Colobanthus quitensis) are increasing around the coast of Signy Island (Smith Reference Smith1994, Cannone et al. unpublished data), as has been documented farther south in the Argentine Islands (Fowbert & Smith Reference Fowbert and Smith1994). However, while D. antarctica has been reported as a pioneer species on moraines and recently deglaciated terrains of the Antarctic Peninsula (Anvers Island, Smith Reference Smith1982), South Shetland Islands (Kozeretska et al. Reference Kozeretska, Parnikoza, Mustafa, Tyschenko, Korsun and Convey2010) and sub-Antarctic (South Georgia, Lewis Smith Reference Lewis Smith2000), only one isolated plant of D. antarctica was observed in the upper and middle parts of Moraine Valley (in subzone Y1, outside of the surveyed plots).
In conclusion, the early successional stages observed only a few decades after glacial recession (zone X), which corresponds to the rapid colonization of ground recently exposed by snow and ice recession (Convey & Smith Reference Convey and Smith2006), requires several more centuries to evolve to a more mature, high cover community (zone Y). Further progress to higher ground cover and biomass-producing moss-turf communities (subzone Z2) depends not only on the age of the surface, but also on other favourable environmental factors such as snow cover duration or surface stoniness and stability. Although the vegetation of the Maritime Antarctic can be extremely dynamic, with community changes occurring over a few decades due to strong environmental factors such as the invasion of fur seals (Smith Reference Smith1988, Favero-Longo et al. Reference Favero-Longo, Cannone, Worland, Convey, Piervittori and Guglielmin2011), our analyses suggest that the direct effects of climate change, illustrated by glacial retreat, may result in less drastic vegetation changes on Signy Island. The effect of local-scale environmental resistance on the biological driving force (sensu Svoboda & Henry Reference Svoboda and Henry1987), as seen in Arctic and continental Antarctic polar deserts (Melick & Seppelt Reference Melick and Seppelt1997, Jones & Henry Reference Jones and Henry2003), may decrease the pace of vegetation succession, minimizing species replacement and the accumulation of biomass, and thus buffering the strongest effects of climate change.
Acknowledgements
The authors wish to thank PNRA (Progetto Nazionale di Ricerca in Antartide) for providing funding and BAS (British Antarctic Survey) for logistical support to make this research possible. We thank the editor and anonymous reviewers for helpful and constructive comments. The study also contributes to the BAS ‘Polar Science for Planet Earth’ and SCAR ‘Evolution and Biodiversity in Antarctica’ research programmes.
Supplemental material
Supplemental material will be found at http://dx.doi.org/10.1017/S0954102012000120.


