


1. Introduction
Equivalisation is fundamental to any meaningful measure of household income distribution or of income poverty. Knowing that one household has twice as much income as another tells us little if we take no account of who lives in each household, and the effect this has on living standards. Equivalisation therefore adjusts household incomes by factor weightings determined by numbers of adults and children, before comparing ‘equivalised’ income levels.
Yet the question of what weightings to use has been anything but straightforward. Empirically-informed economic analysis seeking to determine differences in the income required by different households to reach a given living standard has produced far from conclusive results, and at best a highly abstract basis for approximating equivalence scales (Chiappori, Reference Chiappori2016; van de Ven et al., Reference Van de Ven, Herault and Azpitarte2017; Banks and Johnson, Reference Banks and Johnson1993). As a consequence, the standardised scales adopted internationally have been determined in a largely arbitrary manner (Citro and Michael, Reference Citro and Michael1995), based on what seems plausible as much as on what is empirically demonstrable.
These imperfections matter. Which equivalence scale is used can sometimes influence reported overall poverty levels (Banks and Johnson, Reference Banks and Johnson1994), and has a major effect on how they are distributed across groups (de Vos and Zaidi, Reference De Vos and Zaidi1997). Since poverty data can help governments set priorities, by identifying the most at-risk groups, the equivalence scale used is arguably at least as important to policy as the poverty threshold selected.
While acknowledging that there is no perfect way of calculating an accurate equivalence scale, this article draws on a new seam of evidence to assess whether the prevailing scales used by national and international statistical agencies can be broadly justified as a means of measuring income poverty, or whether they under- or over- estimate certain households’ relative income needs in some systematic way. This evidence comes from budget standard (or ‘reference budget’) studies, which set out what goods and services different types of household need to buy in order to reach a minimum living standard. This provides a more direct and tangible means of comparing costs faced by different households than inferring the living standards achieved by different households based on their spending patterns – the main approach used in economic modelling. They also focus specifically on relativities at a minimum living standard.
The evidence in this article comes from a common approach recently adopted in several countries, the Minimum Income Standard (MIS): a ‘consensual’ method in which members of the public in each country specify what is required for a minimum standard of living (Davis et al., Reference Davis, Hirsch and Padley2018a; Reference Davis, Hirsch, Padley and Shepherd2018b). Conceptually, this method follows the principle set out by Townsend (Reference Townsend1979) and Walker (Reference Walker1987) that a minimum should be enough to participate in society, not merely meet basic material needs, and uses public consensus as the criterion for setting the level of this minimum.
Section 2 of the article considers how equivalence scales have been derived and adapted from economic studies; Section 3 discusses how budget standards can inform equivalence, and presents the Minimum Income Standard studies whose results are analysed in Section 4. The data analysis focuses on two key aspects of the relative minimum income needs of different household types – the weighting given to singles compared to couples and the weighting given to children compared to adults; it also considers which areas of household budgets influence the results. The article concludes that while the results do not suggest a new international equivalence scale, they contribute greatly to policy-relevant evidence in each country.
2. Economic derivation of equivalence scales – methods and limitations
Studies using economic modelling to estimate equivalence most commonly seek to observe households of different types that reach the same living standards with different incomes. But estimating living standards is not easy. The dominant approach infers them from the proportion of income spent on food and other ‘essentials’, on which higher-income households spend proportionately less (Engel, Reference Engel1895) – i.e. income elasticity of consumption is low. Among those spending a given amount on these essentials, larger households tend to have higher incomes than smaller ones, and the difference is assumed to represent the additional cost of extra household members. McClements (Reference McClements1977) pioneered equivalence studies, looking across all expenditure categories based on elasticities, but a range of critiques of his and subsequent studies argue that they have not been able to show conclusively that their comparisons are independent of the assumptions that they start with (Banks and Johnson, Reference Banks and Johnson1993; Chiappori, Reference Chiappori2016; Van de Ven et al., Reference Van de Ven, Herault and Azpitarte2017).
This article does not seek to review the many technical critiques of equivalence studies. However, for the purposes of considering alternative approaches to equivalence, it is worth noting some underlying difficulties of this approach.
Most fundamentally, the method begs the question of how valid it is to compare the overall utility of income across different household types based on spending behaviours. Engel’s relationship is most useful as an ordinal indicator of the welfare of different households with common characteristics other than income (Browning et al., Reference Browning, Chiappori and Lewbel2013; Chiappori, Reference Chiappori2016). But knowing, say, that a single person spending 20% on food is better off than one spending 30% on food, and that the same is true of couples, this does not necessarily mean that a single and a couple spending 30% on food have the same living standard. Various factors could prevent this from being true. One is that the importance of food and clothing is likely to be proportionately greater for the well-being of some types of person (e.g. babies) than for others (Nicholson, Reference Nicholson1976; Citro and Michael, Reference Citro and Michael1995). Another is that economies of scale will differ across expenditure categories, and spending across these categories varies by household type, so spending a certain proportion on a category such as food has different significance across differently-sized households. Rothbarth (Reference Rothbarth and Madge1943) therefore proposed comparing only expenditure on adults, across different family types. However, even the same type of person in a different family type may have different needs – for example, a parent may structure leisure activities differently from a single person without children (Citro and Michael, Reference Citro and Michael1995; Davis et al., Reference Davis, Hirsch and Padley2018a).
Studies of ‘subjective poverty’ have sought to ground estimates more in lived experiences by asking people from different household types what is the minimum they require to reach a minimum or a given standard. They have produced highly variable results, and are limited by the fact that they ask about a counterfactual based on an individual’s spot judgement, rather than on actual well-being (van de Ven et al., Reference Van de Ven, Herault and Azpitarte2017). However, Bishop et al. ( Reference Bishop, Grodner, Liu and Ahamdanech-Zarco2014) used a large European pooled dataset drawing on such surveys of subjective poverty, to suggest that children’s minimum costs relative to those of adults were being underestimated by the dominant equivalence scales.
These differences between subjective and consumption-based calculations have influenced the development of equivalence scales deemed to be plausible rather than relying on any one piece of empirical evidence. In the 1980s, the ‘Oxford’ scale used by the OECD assigned a value of 1 to the first household member, of 0.7 to each additional adult and of 0.5 to each child, informed by economic evidence then available (Citro and Michael, Reference Citro and Michael1995). However, when studies of subjective poverty suggested that the second adult weighting should be around 0.3 rather than 0.7, the OECD ‘modified’ scale was introduced with a compromise of 0.5 (Hagenaars et al., Reference Hagenaars, De Vos and Zaidi1994; Citro and Michael, Reference Citro and Michael1995). This scale, which also gives a weighting of 0.3 to children under 14, was adopted by the European Union, and has remained the predominant scale used by European national statistical agencies. (Another scale suggested by the OECD (2008), and used in the Luxembourg Income Study, the square root scale, is based on a single a priori principle, that additional household costs rise by a lower multiple each time an additional member is added: the square root of the multiple by which family size increases.) In proposing an adapted relative-poverty measure, the UK’s Social Metrics Commission (2018) noted that the OECD modified scale does not correspond with evidence of relative costs, but continues ‘reluctantly’ to use it. That scale is therefore the main reference point used in this article.
A final, important point is that equivalence scales apply a single set of relativities across the income distribution, with the economic models considering average elasticities among people at all income levels. This is problematic for poverty measurement, because both conceptually and empirically the assumption of a common set of relativities across the distribution is flawed. If, for example, people on low incomes mainly use buses and those on high incomes mainly drive cars, the relative amounts that singles and couples need to spend on transport to maintain the same living standards may differ considerably according to income level. Analysis from both the UK (Banks and Johnson, Reference Banks and Johnson1993) and France (Glaude and Moutardier, Reference Glaude and Moutardier1991; Martin and Périvier, Reference Martin and Périvier2015) has shown that elasticities change across the income distribution, for example, implying a declining relative cost of children as income rises, causing child poverty as a share of overall poverty to be underestimated by equivalence measured across the distribution.
3. Budget standards: approaches and uses in relation to equivalence
Budget standard studies have become increasingly prominent, especially in Europe as a means of specifying how much different household types need in order to reach a minimum living standard, by producing costed lists of goods and services required by citizens of a particular country. Broadly, two approaches have been taken to generating these lists – ‘expert’ methods drawing on evidence on consumption patterns and specialist assessments of minimum material needs, and ‘consensual’ methods in which groups of members of the public make judgements on what should be included (Deeming, Reference Deeming2017; Davis et al., Reference Davis, Hirsch and Padley2018a; Goedeme et al., Reference Goedeme, Storms, Stockman, Penne and Van den Bosch2015; Saunders and Bedford, Reference Saunders and Bedford2017). These studies have not been conducted with the specific purpose of producing equivalence scales. However, since each of them uses a common metric to assess the income requirements of various household types, they enable the accuracy of equivalence scales to be tested.
This kind of test of equivalence scales has both conceptual and practical advantages. Conceptually, the use of agreed minimum household budgets estimates relative needs of different household types on a more clear-cut basis than expenditure analysis. Practically, itemised budgets make the basis for these relative needs more tangible and transparent, grounded in an account of variations in minimum budgets for different expenditure categories.
Reports on individual budget standards studies have already commented on contrasts between their results and equivalence scales (e.g. Goedeme et al., Reference Goedeme, Storms, Stockman, Penne and Van den Bosch2015:21; Saunders and Bedford, Reference Saunders and Bedford2017: 97; Bradshaw et al., Reference Bradshaw, Middleton, Davis, Oldfield, Smith, Cusworth and Williams2008:41; Concialdi, Reference Concialdi2014: 118-131). These results have most commonly noted an apparent under-estimate of certain economies of scale, and under-estimate of the cost of children relative to adults, in the equivalence scales compared to budget standards. However, they have done so by making different forms of comparison between different pairs of budgets that are hard to draw together across countries. An important potential limitation in this regard is that each study chooses different examples of household types. However, the present article draws on four studies using the same overall method and using combinations of household types that allow calculations to be made on a common basis.
In interpreting this analysis, it is important to bear in mind several differences from the study of equivalence via the economic modelling described earlier. First of all, starting with specific household combinations varying by multiple factors such as age, couple status, and number and birth order of children, no single equivalence scale will ever match all cases. For example, the additional cost of an adult can differ according to how many other adults are already in the household, and whether or not children are present, while the cost of a child can differ with birth order and age. No single formula of weightings for adults and children can fully capture such complex variation.
Furthermore, we should not expect the relative levels of budgets for different household types to be the same across place and time. The relative prices of various goods and services, the relative importance put on different items, and the levels of public subsidy that influence how much people need to pay for services such as transport, education and health care, are all variable, and influence relative costs for different household types. According to one estimate, the value to households of non-monetary benefits varies within the EU from 10% of disposable income in Greece to more than 40% in Denmark (Concialdi, Reference Concialdi2014). This issue is particularly important when comparing the cost of children to the cost of adults, since large in-kind transfers are made for child-specific services such as education and childcare. Math (Reference Math2014) showed that, in France, total consumption expenditure for children under 20 is equally shared between household expenditure and government expenditure. Thus, even insofar as the overall relative needs of, say, a child compared to an adult are broadly the same across countries, the private cost to households of meeting these needs may vary greatly.
For these reasons, a single ‘correct’ equivalence scale is a chimera. Yet that should not stop one from considering the extent to which actual budgets match the pattern predicted by equivalence scales or what parts of budgets help explain any discrepancies. Across different countries, such comparisons may produce both commonalities and differences.
The comparisons that follow are made more complex by the issue of housing costs. In general it is more straightforward to standardise calculations of non-housing items than housing: a standardised minimum basket of goods can be priced at widely used chain stores, but the cost of meeting minimum housing needs varies widely according to location and whether homes are being rented publicly or privately, or owned privately. Consequently, those comparisons below that include assumptions about housing costs need to be treated with caution. We therefore also report budgets excluding housing costs, and compare them to ‘after housing costs’ income (i.e. income after deducting such costs), using a separate equivalence scale, as explained below. (For these purposes, ‘housing costs’ are defined as rent/mortgage, associated costs such as ground rent, service charges and buildings insurance and water bills.)
The comparisons also exclude other aspects of household spending that are important but vary widely across individuals. For example, the costs of disability are not included. The cost of childcare, while estimated for budget standards studies, are excluded from the comparisons shown, as they would cause problematic anomalies. In the UK, the very high cost to a lone parent of full-time childcare for a child under 2 adds 40% to the minimum budget (Davis et al., Reference Davis, Hirsch, Padley and Shepherd2018b), yet, precisely because of this high cost, very few such families actually do use paid childcare to this extent. This is in contrast to, say, Portugal, where the majority of children under three use childcare services (38 weekly hours in average), paying far more modest fees, which vary with income. While we have therefore excluded childcare from our standardised cross-national comparisons, it is important to note that in many cases they do add to the relative cost of a child.
Method and sources
The calculations below derive from four studies applying the MIS approach (Davis et al., Reference Davis, Hirsch and Padley2018a) in different European countries: France, Ireland, Portugal and the UK. This approach was first developed in the UK (Bradshaw et al., Reference Bradshaw, Middleton, Davis, Oldfield, Smith, Cusworth and Williams2008) and replicated in the other three countries. The MIS studies use a ‘consensual’ method to address what is required for a minimum socially acceptable living standard, according to what members of that society judge to be essential. (However, they are not ‘subjective’ studies in the sense of the previously described surveys asking individuals what they could live on, since they involve group deliberation on what is required by anyone in contemporary society, not the participants’ own personal requirements.)
The methods used in each country are not identical, but share the following key features. (1) Budgets are derived principally from a succession of deliberative focus groups, in which citizens from the household types under discussion, from a range of socio-economic backgrounds, list what items are needed to reach a minimum standard. (2) Some expert knowledge is incorporated into this process, such as whether diets are nutritionally adequate, but final decisions about what is included rest with the citizen groups. (3) An ‘iterative’ methodology is employed: social consensus is developed over a series of groups, with subsequent groups ratifying or amending decisions made by earlier ones and resolving any aspects that the initial groups cannot agree on.
In the UK and Ireland, budgets are regularly calculated for a range of household types representing singles and couples of working and pension age and most nuclear families with children. The figures used here for both countries are for 2018, based on research carried out in that year and in 2016 in the UK (Davis et al., Reference Davis, Hirsch, Padley and Shepherd2018b), and 2012 research updated to 2018 for Ireland (MacMahon et al., Reference MacMahon, Thornton, McEvoy and Hennessy2018; Collins et al., Reference Collins, MacMahon, Weld and Thornton2012; MacMahon et al., Reference MacMahon, Weld and Thornton2012).
In France, MIS budgets have been calculated for a range of household types representing singles and couples of working and pension age, as well as for couples and lone parents with two children. Results relating to the end of 2013, covering medium sized cities, were first published in 2014 (Concialdi, Reference Concialdi2014) and the related Government report released in 2015 (ONPES, 2015)Footnote 1 .
In Portugal, budgets were calculated for household types representing singles and couples of working and pension age and most nuclear families with children, in a project carried out between 2012 and 2014. The figures used here are for 2014, the date of price collection (Pereirinha et al., Reference Pereirinha, Pereira, Branco, Amaro, Costa and Nunes2017; Reference Pereirinha, Pereira, Branco, Amaro and Costa2019).
4. Results
Equivalence scales make the comparison of household incomes sensitive to the number of people in the household, but diverge from a simple comparison of income per person in two main respects. First, they incorporate economies of scale, in the case of the OECD’s (‘modified’) scale by applying a higher weighting to the first member of a household than to additional members. Second, they generally give higher weighting to adults than to children. These two simple overall rules can be compared to results from budget standards studies: those determining the relative weights of different adults in the household and those determining the weights of additional adults compared to additional children.
Relative weights of adults: comparing singles to couples
The modified OECD scale assigns a weighting of 1.0 to the first adult and 0.5 to each additional adult or child aged 14+Footnote 2 . Here, we express this as a couple to single weighting being based on a ratio of 1.5. Expressing it in this way when exploring actual relative costs avoids thinking in terms of what the second compared to the first adult consumes, referring rather to what a couple consumes collectively compared to singles. For example, the fact that food bills may not double when the second person joins a household do not arise from them consuming less than the first, but because there is an economy of scale. A ratio of 1.5 implies a 25% economy of scale, since combined spending is a quarter less than the combined weighting of two singles living separately (2.0).
As well as exploring these ratios for the entire household budget, we consider their level when excluding housing costs from budgets: not only are these hard to standardise, but their level greatly influences the economy of scale (see below). These produce benchmarks that could be used to equivalise ‘After housing costs’ incomes, which we relate to a ‘companion’ scale to the OECD modified scale, used in the UK for this purpose. This uses a higher couple-to-single weighting (1.72 rather than 1.5) than the main OECD scale, implying a lower economy of scale (14% rather than 25%). This difference has some empirical basis. It was created when the UK government switched from the scales derived from the McClements study (see above) to the OECD modified scale. The companion scale is designed to have the same broad relationship to the main OECD scale as that between the McClements scales after and before housing cost (Department for Work and Pensions, 2005).
The MIS research allows the cost of a couple relative to a single to be compared across countries in several different household situations. Tables 1 and 2, and Figures 1 and 2 in the Appendix, show these across four countries, alongside the assumptions made in the OECD modified scale and its after housing cost ‘companion’ scale. (Note that Table 2 makes calculations net of housing on both the cost and the income sides of the equation: the MIS cost calculations exclude the cost of housing, while equivalised income “after housing costs” subtracts actual housing costs from gross income. The same is true for Table 4.) The calculations for working age and for pensioners respectively are derived by comparing single and couple budgets for each of those age groups, while budgets for singles and couples with children are compared by considering the difference between family budgets in these two cases, relative to the budget for a working age single.
TABLE 1. Cost of couple as ratio of single – budget estimates, including housing costs, versus “before housing costs” equivalence scale

TABLE 2. Cost of couple as ratio of single – budget estimates excluding housing costs versus “after housing costs” equivalence scale

Sources: MIS data for each country.
The results show that in three of the countries the second adult costs less, relative to the first, than is assumed by the OECD equivalence scales. In Portugal, the results are mixed: including housing costs, the second adult costs more, relative to the first; excluding housing costs, in some cases the couple costs more and in others the single costs more than the equivalence scale assumes.
An advantage of budget standards is that they allow one to observe what drives such results: in this case, in which areas of household expenditure large economies of scale are evident. The research in different countries does not produce any single pattern, but rather identifies various areas where high economies of scale may occur. The following observations apply to working age couples compared to singles, without children.
Some costs, related in particular to household bills and the purchase of household goods, give very high economies of scale across countries. In all four countries, household goods cost at most around 1.2 times as much for a couple as for a single, giving at least a 40% saving compared to having to buy them twice. A similar result applies to spending on domestic fuel (the highest ratio here is 1.32 – in France).
For other expenditure areas, economies of scale are particularly high in some countries but not others. These differences can relate to the contents of budgets. For example, in France, where a car is considered necessary for working age adults without children, there are high economies of scale for transport associated with a couple sharing a car, while elsewhere, where the minimum is based on public transport, there are no such economies.
Some countries report economies of scale in buying food, which can, for example, arise from bulk purchases or reductions in food waste, but is also affected by how much singles and couples respectively are expected to eat out. This latter effect is not an economy of scale but a difference in the contents of consumption. To the extent that singles need to go out to eat more in order to facilitate social participation, living as a couple and being able to socialise when eating at home can bring savings: this factor helps produce high savings for couples on food expenditure in Ireland. In Portugal, on the other hand, eating out is culturally considered relatively important for couples as an aspect of their social life, and overall food costs no less for two people living together than living separately.
As illustrated by the different results in Tables 1 and 2, housing plays an important but variable role in determining overall economies of scale. In each country, a judgement has been made about what best represents a lowest-cost version of adequate housing for each household type. In all the cases shown here, the same accommodation has been considered appropriate as a minimum for singles and a couple, producing a scale economy at or close to the maximum of 50% (i.e. a couple budget that is half the level of two single budgets). However, the contribution of this to the overall economy of scale varies greatly according to the proportion of rent in the total budget. For each country, an informed view has been made about what would be an example of a modest private rent level, outside the capital cityFootnote 3 . This produced figures of roughly a quarter of the total budget in the UK, France and Ireland, but only a ninth in Portugal – helping to explain Portugal’s relatively low economy of scale, including housing costs, overall. But since actual housing costs vary so much for individuals within countries, the costs excluding housing more consistently describe those that households actually face. Thus it is significant that in 11 out of 12 of the cases shown in Figure 2, the economies of scale are greater than assumed in the ‘companion’ scale excluding housing costs.
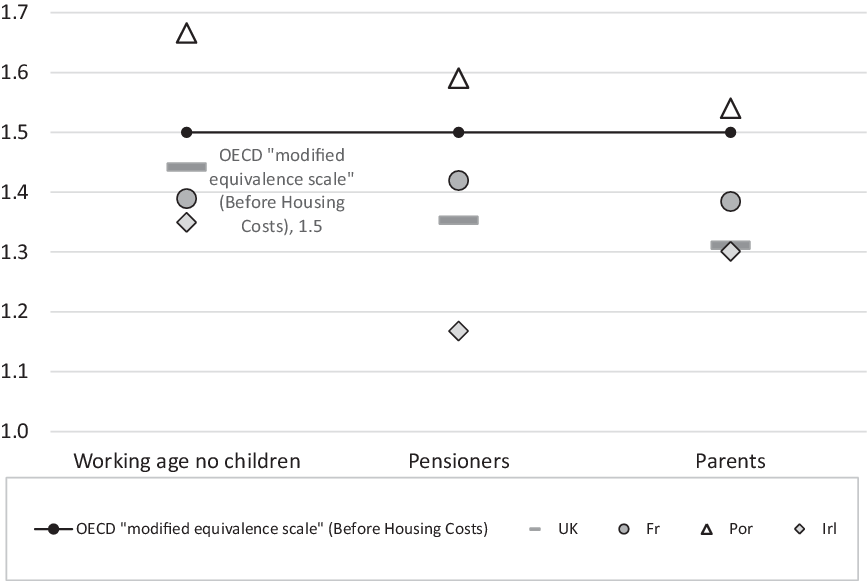
FIGURE 1. Ratio of couple to single, including housing costs

FIGURE 2. Ratio of couple to single, excluding/after housing costs
Overall, then, this evidence shows that economies of scale can come from different sources in different circumstances, and are variable in size overall, but generally higher than suggested in the OECD scales currently in use. Moreover, this tendency can be observed not just when using a ‘consensual’ method such as MIS but through ‘expert’ derived methods. For example, the UK’s Family Budget Unit reported budgets for families with children in which the additional cost of a second parent was 55% as great, after housing costs, as that of a single adult – much lower than the 72% assumed in the UK’s companion scale (author calculation based on Family Budget Unit, 2005). Using a similar method in Australia, Saunders and Bedford (Reference Saunders and Bedford2017: 97) calculated a 56% addition for the second member of a couple without children, also after housing costs.
Weighting for children compared to adults
Turning to the additional cost attributed to a child relative to that of an adult, this can be measured in various ways. ONPES (2015, p37) compared the additional cost of the first child in their study, relative to the cost of the adults in the family, to what would be predicted by equivalence scales, and found that these are far higher than the scales predict. Another comparison would be to repeat this for additional children. However, to focus on the different weightings given to additional adults and children in equivalence scales, the calculations below compare the additional cost of a second adult (in a household without children, as referred to in the previous section) with the average additional cost of each of the first two children. The latter cost is calculated both for lone parents (by subtracting a single person’s budget from that of a lone parent with two children, and dividing by two) and for couples with children (by subtracting a couple’s budget from that of a couple with two children, and dividing by two). Since costs vary with age, the calculations use cases with children around the middle of the 0-14 age range to which the children’s weightings in equivalence scales apply. While the design of the studies does not allow for precisely the same age comparison in every case, the average age of the children covered is between 7 and 9 in all four countries.
The results are presented in Tables 3 and 4, as well as in Figures 3 and 4. They show that, in almost every case, the cost of a child relative to an adult is substantially above that assumed by the OECD modified equivalence scale; the only exception is for Ireland in couple parent families, after housing costs, where the cost is the same as in the equivalence scale. Another very clear-cut result is that in most countries this additional cost of a child is greater in lone parent than in couple families. One explanation is that there are various adult economies that offset the cost of children – such as not having to spend as much on adult public transport if having children means you require a car, or not allocating as high a budget to social activities by adults outside the home – and these economies are greater when applied to two adults rather than one.
TABLE 3. Cost of additional child as % of cost of additional adult* – MIS budgets including housing costs versus “before housing costs” equivalence scale

Sources: MIS data for each country.
* “Cost of additional child” = cost of two-child family minus cost of the adults in that family, divided by two; “Cost of additional adult” = cost of working age couple minus cost of working age single.
TABLE 4. Cost of additional child as % of cost of additional adult* – MIS budgets excluding housing costs versus OECD “after housing costs” equivalence scale
When looking more closely at detailed budgets in individual countries, it is hard to find any one factor that drives this result. However, the single most important category producing higher costs for children relative to adults than suggested by OECD equivalence scales is social participation. Not surprisingly, parents place a lot of emphasis on their children being included in customary forms of social participation (cf. Townsend, Reference Townsend1979), including taking part in recreational activities, giving presents, going on school trips and going on family outings. Some such items may cost no less for children than for adults. One way of quantifying this is to compare the cost of social participation for a single parent with one child and the cost of a couple. Both of these households include two individuals; but in one, the second person is an adult, in the other a child. In the United Kingdom, the social participation budgets are almost identical for these two households, and in France and Portugal they are significantly higher for the lone parent with one child – showing that in this case an additional child adds more rather than less required expenditure than an additional adult. (In Ireland, however, the lone parent’s social participation budget is somewhat less than the couple’s, but still higher than the equivalence scale percentages.) While each country’s MIS study defines social participation somewhat differently, reflecting cultural differences, this common result reflects how children’s social interactions are prioritised by parents participating in consensual studies, producing results that would be hard to derive from ‘expert’ evidence alone.
It is also important to note that Tables 3 and 4 significantly understate the full cost of children because they exclude childcare costs. It is particularly difficult to standardise these costs in ways that would be meaningful in equivalence scales, for reasons given above. For the children of primary school age that are the focus of this analysis, childcare costs are much lower than for pre-school children; nevertheless, the effects of these extra costs on young families is highly relevant to living standards, and could be the subject of future cross-national study.
As with greater economies of scale, the higher cost of children, compared with equivalence scales, is reflected in results of other methodologies – including ‘subjective poverty’ studies (Bishop et al., Reference Bishop, Grodner, Liu and Ahamdanech-Zarco2014, as referred to above) and expert-derived budget studies. An initial assessment of a cross-national budget study by Goedeme et al. ( Reference Goedeme, Storms, Stockman, Penne and Van den Bosch2015) showed the cost of children to ‘be clearly higher than what is implicitly assumed in the modified OECD equivalence scale, especially in the case of outright owners’.
Other comparisons, and effect on relative number on low income
The above comparisons have investigated two main aspects of equivalisation to which MIS budgets can most readily be compared. As more data become available, they can shed light on other aspects. For example, where MIS studies allow comparisons of the cost of children at different ages, they are showing non-childcare costs clearly rising by age: in the UK, they are less than half as much for a child under two as for a teenager (Hirsch, Reference Hirsch2018); in Ireland, they are below two-fifths as much for a 3 year old as a teenager (MacMahon et al., Reference MacMahon, Thornton, McEvoy and Hennessy2018). A more complex feature is economies of scale in families with different numbers of children. While a recent ‘expert’-based study (Saunders and Bedford, Reference Saunders and Bedford2017) appears to confirm the assumption in the OECD’s alternative ‘square root’ scale that each successive household member costs less, MIS evidence in the UK and Ireland suggests this may not always be so after the second child. They identify ‘tipping points’ whereby an additional child brings new costs, by triggering additional needs such as a tumble drier or a larger car (Hirsch, Reference Hirsch2018, MacMahon et al., Reference MacMahon, Weld and Thornton2012). A further comparison is between adults above and below pension age – not distinguished in equivalence scales. In three of the MIS country studies, pensioners have lower budgets (although in France, because pensioners unlike working age adults say they need a spare room, this triggers higher spending on both housing and household goods). Some pensioner economies can be attributed to lower costs due to public subsidies, such as concessionary fares on public transport, while others may be attributable to differences in their attitude to what is an essential minimum.
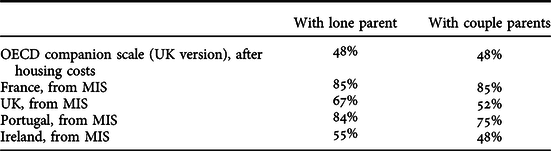
The differences in the relative cost of different household members, both those shown in Tables 1 to 4 above and the other variations mentioned here, do have important implications for the distribution of people considered to be on low income, with a bearing on public policy priorities. In the UK and France, distributions of households below MIS across demographic groups have been estimated and compared to the relative numbers on low income using standard equivalisation scales. Examples of these comparisons are shown in Table 5, in each case comparing demographic distributions below broadly similar income thresholds.
TABLE 5. Selected examples of relative numbers below MIS and below relative-income thresholds, UK and France

In the UK, the biggest discrepancies in the distribution are for lone parents and single pensioners: twice as many of the latter than the former are below 70% median, but four times as many are below MIS. In France, which has the highest discrepancy in the relative cost of children (Figure 3), there is a more generalised difference between the relative number of children shown on low income by the two methods. The difference is particularly marked for families with at least two children on very low incomes: they comprise a minority (42%) of very low income households according to the OECD scale but a majority (56%) according to MIS.
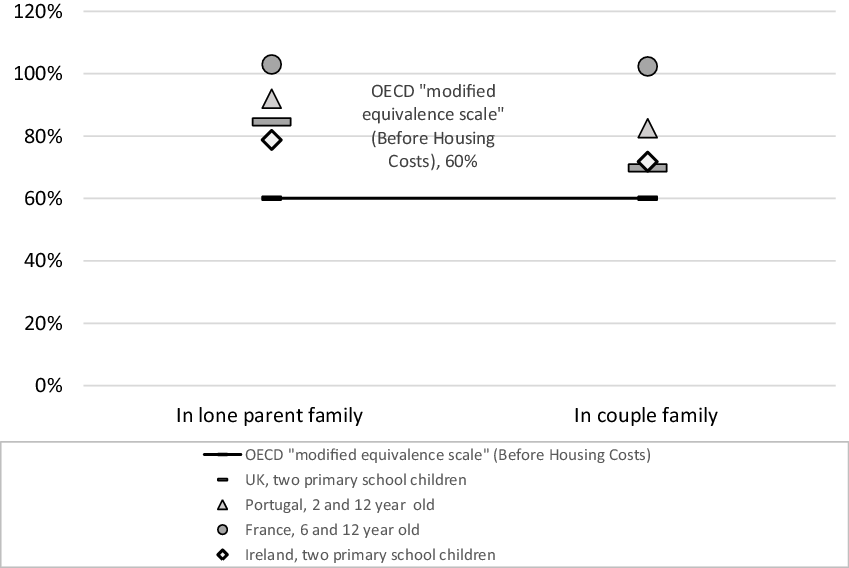
FIGURE 3. Cost of additional child as % of additional adult, including housing
5. Conclusion and policy significance
This article uses consensual research on budgets standards to produce new insights into the relative cost of different household types in different countries, in a way that matters for the monitoring of the distribution of poverty and low income.
The evidence presented shows that, across countries, the prevailing equivalence scale is underestimating the cost to households of an additional child compared to an additional adult. In most countries examined here, the OECD modified scale also underestimates costs for single adults relative to couples. Both findings corroborate previous, dispersed evidence.
The finding on the relative cost of children is particularly clear-cut: in every case it is at least as high as (and in 15 of the 16 cases shown in Figs 3 and 4 is higher than) the equivalence scale assumes, even before childcare is taken into account. The size of these effects varies across countries: the relatively high cost of a child appears greatest in France and Portugal, while the high cost of a single relative to a couple is most pronounced in the UK and Ireland.

Importantly, lone parent families are affected by both underestimates simultaneously, because they combine children and single adults, and therefore equivalence scales can seriously understate their risk of low income relative to that of other groups. This has strong significance for policy making. For example, in the United Kingdom, the setting of benefit levels has been influenced by arguments about whether the generosity of benefits for lone parents incentives lone parenthood (Hirsch, Reference Hirsch2012; Rabindrakumar, Reference Rabindrakumar2017); in Ireland, policy changes affecting lone parents’ benefits have caused significant deterioration in their incomes (Regan et al., Reference Regan, Keane and Walsh2018).
The most important finding of this research, the under-estimation of the relative cost of children by the OECD modified scale, is important because this scale is the basis used by European governments to report and monitor child poverty. (Similar results could be expected from other scales such as the McClements and OECD square-root scale, which also give children low weighting compared to adults, but quantifying this would be more complex, since child weightings vary by age and birth order respectively for those two scales, and would require further analysis.)
Insofar as equivalence scales are used to measure poverty in European countries, these findings would support the use of scales (including scales for income net of housing costs) giving relatively more weight to single adults and to children. Further cross-national analysis re-weighting data from the EU Statistics on Income and Living Conditions (EU-SILC) survey could usefully investigate how this affects child poverty rates; this could be done, for example, using an average of the country results presented here. However it must also be noted that no single equivalence scale can represent the relative needs of different household types with full accuracy, and local circumstances including cultural specificities can create significantly different relativities rather than these being universal. The underlying conclusion is that alongside any data on income distribution relying on a standardised equivalence scale, it is important to consider additional evidence on the actual impact of low income on different households’ ability to afford essentials. Observing the number of households living below the minimum income standard threshold is one way of doing so (e.g. Stone et al., Reference Stone, Padley and Hirsch2019).
Variations in the results across countries also raises the issue of what factors determine relative costs, and whether public policy can influence these. For example, subsidies for essential services can strongly impact the private costs incurred by different groups. In this sense the experience of inadequate income can be affected by changes not just in income itself, but also in the level of minimum costs incurred by households. Budget standard studies can be used to monitor how cost and income interact to determine which households do not have enough to reach a minimum living standard, in ways that are not possible by looking at equivalised household income alone.


