


INTRODUCTION
Phytoliths are particles of hydrated silica (SiO2· nH2O) of phytogenic origin present in the tissues of many vascular plants, and are typically deposited in plant cells or in the intercellular spaces of plants (Piperno, Reference Piperno2006). Many phytoliths possess a diagnostic morphology and are well-preserved in sedimentary deposits (Wang and Lu, Reference Wang and Lu1992); thus, they can be used for paleovegetation reconstruction (Blinnikov et al., Reference Blinnikov, Busacca and Whitlock2002; Delhon et al., Reference Delhon, Alexandre, Berger, Thiébault, Brochier and Meunier2003; Calegari et al., Reference Calegari, Paisani, Cecchet, Ewald, Osterrieth, Paisani and Pontelli2015). Most of the previous studies using phytoliths for paleovegetation reconstruction are based on the percentage representation of phytoliths in paleosols. It is unclear whether these assemblages are accurate representations of the ecosystems that produced them, however, since soil phytolith assemblages are representative of vegetation averaged over several years (Hyland et al., Reference Hyland, Smith and Sheldon2013). In addition, the representation of phytoliths in surface soil is poorly understood, complicating the interpretation of soil phytolith records.
Phytolith representation in soils is skewed by several factors and, in addition, different types of pre- and post-depositional taphonomy can affect phytolith assemblages retrieved from sediments and soils (Cabanes et al., Reference Cabanes, Weiner and Shahack-Gross2011; Madella and Lancelotti, Reference Madella and Lancelottib2012). Phytoliths are silicified in and between the cells of living plants, and differences in biomass production rates and silica uptake between plant types also impact their proclivity in producing phytoliths. For example, in temperate regions, Poaceae are prolific phytolith producers and consequently may over-represent the parent plants (Hodson et al., Reference Hodson, White, Mead and Broadley2005; Ghosh et al., Reference Ghosh, Naskar and Bera2011); however, most broad-leaved trees are low phytolith producers and may be under-represented (Mercader et al., Reference Mercader, Bennett, Esselmont, Simpson and Walde2009). In the case of specific plants, some morphotypes are abundant in phytolith assemblages, while others appear only occasionally. The variability of phytolith production in living plants results in potential representational biases towards certain taxa or morphotypes. Once phytoliths are incorporated into the soil/sediment system, they are subjected to a set of processes comprising pedogenesis, fossil diagenesis, and bioturbation (Madella and Lancelotti, Reference Madella and Lancelottib2012). Because of dissolution and abrasion, some fragile phytoliths, such as hairs and papillae, are not represented in archaeological and geological records. In contrast, phytoliths with a high degree of physical robustness are apparently well preserved in sediments; e.g., cylindric psilates and parallelipipedal elongate regulates (Osterrieth et al., Reference Osterrieth, Madella, Zurro and Alvarez2009; Cabanes and Shahack-Gross, Reference Cabanes and Shahack-Gross2015). Taphonomic biases further reduce the reliability of soil phytoliths for representing the aboveground plants, and Albert et al. (Reference Albert, Bamford and Cabanes2006) reported that soil phytolith assemblages under certain vegetation types are significantly different from the phytolith assemblage of the parent plants.
Few recent studies of modern phytoliths have also compared soil phytolith assemblages with the local standing vegetation. In tropical regions, grass phytolith assemblages were consistent with the grassland biomass in the plot inventory (Bremond et al., Reference Bremond, Alexandre, Peyron and Guiot2005b; Biswas et al., Reference Biswas, Ghosh, Paruya, Mukherjee, Thapa and Bera2016). The Forest Indicators (D/P) are slightly under-represented compared to the Leaf Area Index (LAI), and the corrected D/P index has been shown to be a promising quantitative proxy (Bremond et al., Reference Bremond, Alexandre, Hely and Guiot2005a; Coe et al., Reference Coe, Alexandre, Carvalho, Santos, Silva, Sousa and Lepsch2013). This was not the case in temperate regions, however, where there was an average representational bias of 28.8% between the aboveground vegetation biomass and modern soil phytolith assemblages (Hyland et al., Reference Hyland, Smith and Sheldon2013). Thus, in temperate regions the representational bias in modern soil phytolith assemblages should be assessed and calibrated before they are used as analogues for phytoliths in palaeosols. Since phytolith morphotypes are subject to multiplicity and redundancy, however, a comparison between specific soil phytolith morphotypes and parent plant richness at the same taxonomic level is probably impossible. Consequently, correction for representational bias in temperate regions is only effective in the case of a few diagnostic types, e.g., the bilobate and saddle morphotypes (Hyland et al., Reference Hyland, Smith and Sheldon2013). Notably, plant phytoliths extracted from living tissues can provide a relatively direct record of the standing vegetation. In addition, plant phytoliths are incorporated into the soil as plant residues are decomposed, and the phytoliths from the aboveground plant community are therefore the main source of local soil phytoliths. Thus, the representation of modern soil phytoliths can potentially be assessed from a comparison of the phytoliths from a living plant community with those from the paired surface soil.
In this study, we explore soil phytolith representation, in terms of both the morphotypes present and their quantitative representation, through a comparison of the phytoliths from a living plant community with those from the paired surface soil. The primary goal of the study was to explore the nature and magnitude of representational bias in the phytolith morphotypes recognized, and then to propose a methodology for reducing errors as well as for assessing the representativeness of the assemblages retrieved.
REGIONAL SETTING
Northeast China (39°40ʹ–53°30ʹN, 115°05ʹ–135°02ʹE; Ma et al., Reference Ma, Lin and Wu2007; Fig. 1) can be divided into cold temperate, temperate, and warm temperate zones from north to south; and humid, semi-humid, and semi-arid areas from east to west. The modern climate is influenced by the East Asian monsoon, which has four distinct seasons, with a long winter and a short summer. The annual average temperature ranges from -4°C to 11°C. The average annual precipitation, which is concentrated from July to September and represents 70% of the annual total, ranges from 1000 mm in the east to 350 mm in the west (Zhao et al., Reference Zhao, Wang, Fan and Ying2011). In the cold temperate zone, coniferous forests are widely distributed, with Larix gmelinii being a dominant species. In the temperate zone, there are various vegetation types depending on distance from the sea. In the Changbai Mountains region, the natural vegetation is typically mixed coniferous-broadleaved forest, characterized by Pinus koraiensis, and broad-leaved mixed forest dominated by Quercus mongolica, Juglans mandshurica, Tilia mandshurica, Acer mono, Ulmus laciniata, and Ulmus japonica. On the Songnen plain, the forest changes to forest steppe, alternatively called meadow steppe, dominated for example by Leymus chinensis and Phragmites australis, with occasional trees such as Populus davidiana and Ulmus pumila. In the Hulunbeier region, the zonal vegetation type is typical steppe, dominated by Stipa and Leymus chinensis. In the warm temperate zone, Pinus tabulaeformis is widespread. Correspondingly, the main soil types in Northeast China are brown coniferous forest soils in the cold temperate zone, dark brown forest soil in the warm temperate zone, and forest steppe chernozem and meadow steppe chernozem in the temperate zone (Sun et al., Reference Sun, Ren, Zhao, Gao and Zhou2006).
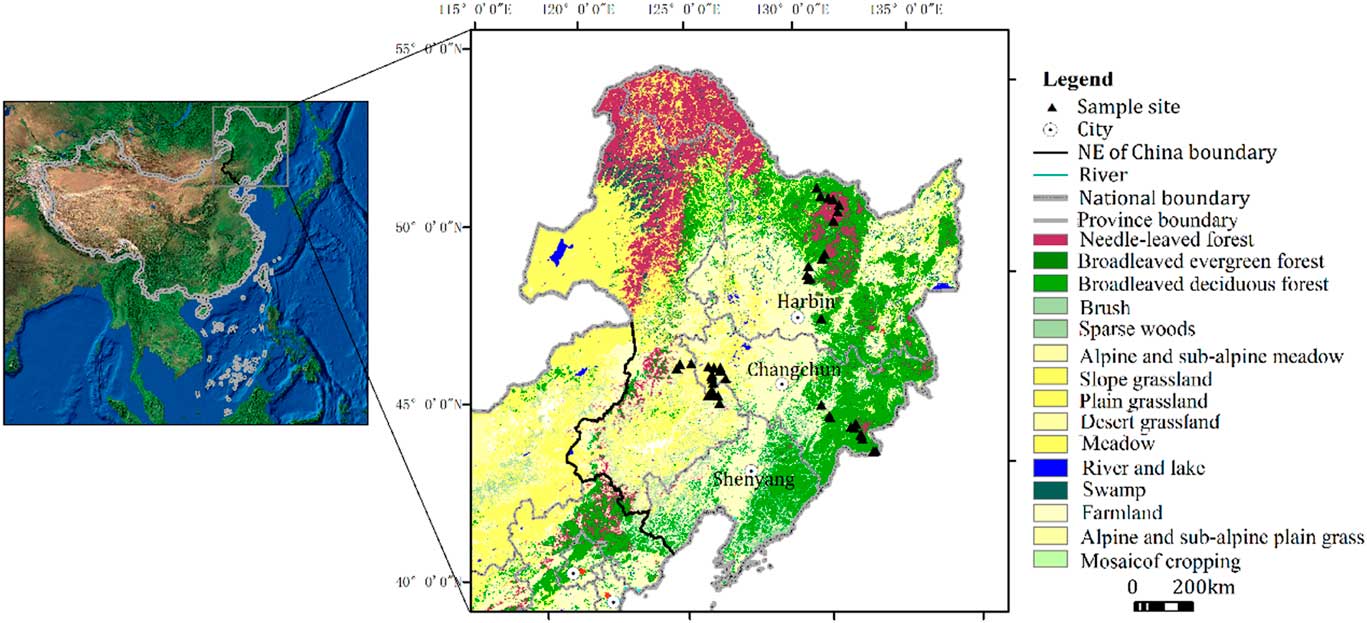
Figure 1 (color online) Major vegetation types in Northeast China and location of sampling sites.
MATERIALS AND METHODS
Materials
Paired plant samples and surface soil samples were collected from a total of 39 plant communities in Changbai Mountains and Songnen grassland (Supplementary Table 1), representing 23 samples in forest communities and 16 samples in grassland communities. An additional 29 soil samples were collected, with 15 samples from grassland areas and 14 samples from forest areas (Supplementary Table 2). The following field sampling procedures were used: For herbaceous communities, all plants from an area of 1×1 m were collected, with each species collected separately. In addition, the upper 2–3 cm of the A horizon of the 1 m2 plot were collected, excluding the litter layer. For forest communities, a 5-point sampling scheme was used. A site of 10×10 m was used, within which four corner plots, and one central plot with an area of 1×1 m, were sampled. In each 1 m2 plot, all the understory herbaceous plants were collected, with each species being collected separately; the woody plant litter covering the surface ground was also collected. In each 1×1 m plot, the upper 2–3 cm of the A horizon, excluding the litter layer, were also collected.
Experimental Methods
In the laboratory, the following procedures were used. For grassland samples, first, each species of herbaceous plant was separately cleaned, dried, and disaggregated. Second, based on the dry weight of each plant species, the herbaceous plant samples were mixed, and the resulting plant community sample was used for phytolith extraction. For woody samples, each species of herbaceous plant was separately cleaned, dried, and disaggregated; the woody plant litter was also cleaned and disaggregated. Second, based on the dry weight of each plant species, the herbaceous plant samples were mixed. Then, based on the dry weight of the herbaceous plant material and woody plant litter, a resulting plant community sample was obtained which was used for phytolith extraction. For soil samples, the sample was composed of equal proportions of material from the five 1×1 m samples.
Phytoliths from plants were processed using the wet ashing method. First, organic matter was removed by oxidation with 65% HNO3 which was heated to 90°C until the reaction ceased. The acid was then removed by washing three times with water in centrifugation at each step. Then, a suspension of Lycopodium spores was added and the sample centrifuged twice at 2000 revolutions/min for 15 min, followed by washing and finally centrifugation with absolute ethyl alcohol. The recovered fraction was mounted on microscope slides using neutral gum for observation and counting. Observations were performed using a MOTIC biomicroscope (DMBA 300, China) under 900× magnification. More than 300 phytoliths were counted from each slide. The new international code for phytolith nomenclature (ICPN Working Group; Madella et al., Reference Madella, Alexandre and Ball2005) was followed wherever possible.
We used a wet oxidation and heavy liquid flotation procedure modified to extract phytoliths from soil samples. The soil samples were air-dried overnight and then 5 g of filtered soil was weighed. Carbonates in the samples were removed with 30 mL of 10% hydrochloric acid; the samples were stirred regularly until the reaction ceased. Following rinsing with distilled water, approximately 30 mL of 65% nitric acid was added to remove organic matter, which was heated to 90°C until the reaction subsided. Then distilled water was added to remove the acid solution, and this procedure was repeated until the solution became pH neutral. Phytoliths were floated from the sediment using zinc bromide prepared to a specific gravity of 2.38 g·cm–3. Next, after centrifugation and discarding the supernatant, absolute ethyl alcohol was added. Finally, the phytoliths were mounted using Canada balsam. Observations and identification were carried out using an Olympus microscope under 600×magnification.
Data Processing
Indices of association, under-representation, and over-representation
The indices are based on a comparison of phytolith morphotypes in plant samples and paired soil samples. These indices were defined as follows (Owen, Reference Owen1984):
 $$\eqalignno{ & A\,{\equals}\,{{B_{0} } \mathord{\left/ {\vphantom {{B_{0} } {\left( {P_{0} {\plus}P_{1} {\plus}B_{0} } \right)}}} \right. \kern-\nulldelimiterspace} {\left( {P_{0} {\plus}P_{1} {\plus}B_{0} } \right)}} \cr & U\,{\equals}\,{{P_{1} } \mathord{\left/ {\vphantom {{P_{1} } {(P_{1} {\plus}B_{0} )}}} \right. \kern-\nulldelimiterspace} {(P_{1} {\plus}B_{0} )}} \cr & O\,{\equals}\,{{P_{0} } \mathord{\left/ {\vphantom {{P_{0} } {(P_{0} {\plus}B_{0} )}}} \right. \kern-\nulldelimiterspace} {(P_{0} {\plus}B_{0} )}} $$
where B0 is number of samples where a certain phytolith type is present in both soil samples and plant samples; P0 is the number of samples where the phytolith type is present in soil samples but is absent in plant samples; and P1 is the number of samples where the morphotype is absent from the soil samples but is present in plant samples. Based on a comparison of phytolith morphotypes from the soil samples and the parent plant community samples, the representation values of A, O, and U values for each morphotype can be calculated.
The Association index (A) is a measure of whether the presence of the phytolith type in the soil sample is an indication of the presence of the phytolith in the associated plant community; it ranges from 0.0 (no/weak presence) to 1.0 (stronger presence). The Over-representation index (O) is a measure of whether the soil phytolith is present when the plant phytolith is absent in the aboveground plant community. Phytoliths with large O values may be commonly found in soil samples, although the same phytolith is not well-represented in the plant community; thus, the soil phytolith content over-represents the richness of the associated living plant. The Under-representation index (U) is a measure of the extent to which a phytolith may be absent or poorly represented in the soil sample in contrast to the representation of the phytolith in the community; thus, the richness of the plant is under-represented by soil phytoliths.
Correlation coefficient (C) and Similarity coefficient (CC)
The Correlation coefficient (C) and Similarity coefficient (CC) are used to describe the degree of linear correlation and the similarity level of phytoliths from soil samples and plant samples, respectively. The larger the C (CC) value, the stronger the degree of linear correlation and the level of similarity between the two variables. The coefficients are calculated as follows.
 $$\eqalignno{ & C \,{\equals}\,{{\sum_{i\,{\equals}\,1}^n (x_{i} {\minus}\bar{x})(y_{i} \,{\minus}\,\bar{y})} \over {\sqrt {\sum_{i\,{\equals}\,1}^n \left( {x_{{i\,}}{\minus}\,}} \bar{x}} \right)^{2} } \sqrt {\sum_{i\,{\equals}\,1}^n \left( {y_{i} \,{\minus}\,\bar{y}} \right)^{2} } }} \cr & CC\,{\equals}\,{{2B_{0} } \over {\left( {B_{0} {\plus}P_{0} } \right)\left( {B_{0} {\plus}P_{1} } \right)}}{\times}100\%\, $$
Where n is the number of samples; x
i
and y
i
are the percentage content of certain morphotype in soil samples and community samples, respectively; and
 $\bar{x}$
and
$\bar{x}$
and
 $\bar{y}$
are the average content of certain morphotype in soil samples and community samples, respectively. B0, P0, and P1 in similarity coefficient are the same as in the representation indices (A, O, U).
$\bar{y}$
are the average content of certain morphotype in soil samples and community samples, respectively. B0, P0, and P1 in similarity coefficient are the same as in the representation indices (A, O, U).
R-values
R-values of the morphotype in sample i can be written as R i , which is the ratio of the soil phytolith content (x i ) to phytolith content from the aboveground site vegetation (y i ; Davis, Reference Davis1963). The R-value of the certain morphotype in n samples was estimated using arithmetic averaging, as follows:
 $$\eqalignno{ & R_{i} \,{\equals}\,{{x_{i} } \mathord{\left/ {\vphantom {{x_{i} } {y_{i} }}} \right. \kern-\nulldelimiterspace} {y_{i} }} \cr & R\,{\equals}\,{1 \over n}\mathop{\sum}\limits_{i{\equals}1}^n {\left( {{{x_{i} } \mathord{\left/ {\vphantom {{x_{i} } {y_{i} }}} \right. \kern-\nulldelimiterspace} {y_{i} }}} \right)} $$
Morphotypes with the same quantities in soil samples and the aboveground vegetation samples (R≈1) accurately represent the aboveground parent plants; morphotypes with R-values greater than 1 may over-represent the abundance of the parent plants to some extent, and morphotypes with R-values less than 1 under-represent the abundance of the parent plants.
Based on a comparison of phytolith morphotypes or percentage contents from the soil and the parent plant community, the representation values of A, O, U, CC, C, and R-values were calculated using the presence of each morphotype for all of the grassland or forested samples, respectively. Then principal components analysis (PCA) was conducted on the representation index data (A, O, U, CC, C, and R-values) to determine the morphotype associations in grassland and forest region respectively.
RESULTS
The representation of different soil phytolith morphotypes in grassland and forest regions in Northeast China
Grassland region
In the grassland region, the 16 paired plant community samples and surface soil samples revealed a diverse range of phytolith morphotypes. They were divided into 34 types: saddle; rondel; bilobate; cylindrical polylobate; cross; trapeziform sinuate; elongate (echinate, attenuate, psilate, tabular, sinuate, crenate, dendritic, and cavate terminal); tabular (irregular, sinuate, rectangle, and square); blocky (cubic, irregular, and faceted); hair (macro, micro, and base); scutiform; lanceolate; lanceolate attenuate; prickle; cuneiform; stomata; tracheid; epidermal phytolith; conical epidermal; and carinate (Fig. 2, Supplementary Table 3). The PCA results, based on the six representation values (A, O, U, CC, C, and R) of each morphotype, showed that first two principal components, Axis 1 and Axis 2, account for 83.7% and 9.7% of the variance in the representation data, respectively. The PCA results indicated that the 34 morphotypes in grassland samples can be separated statistically into four groups (Fig. 3).
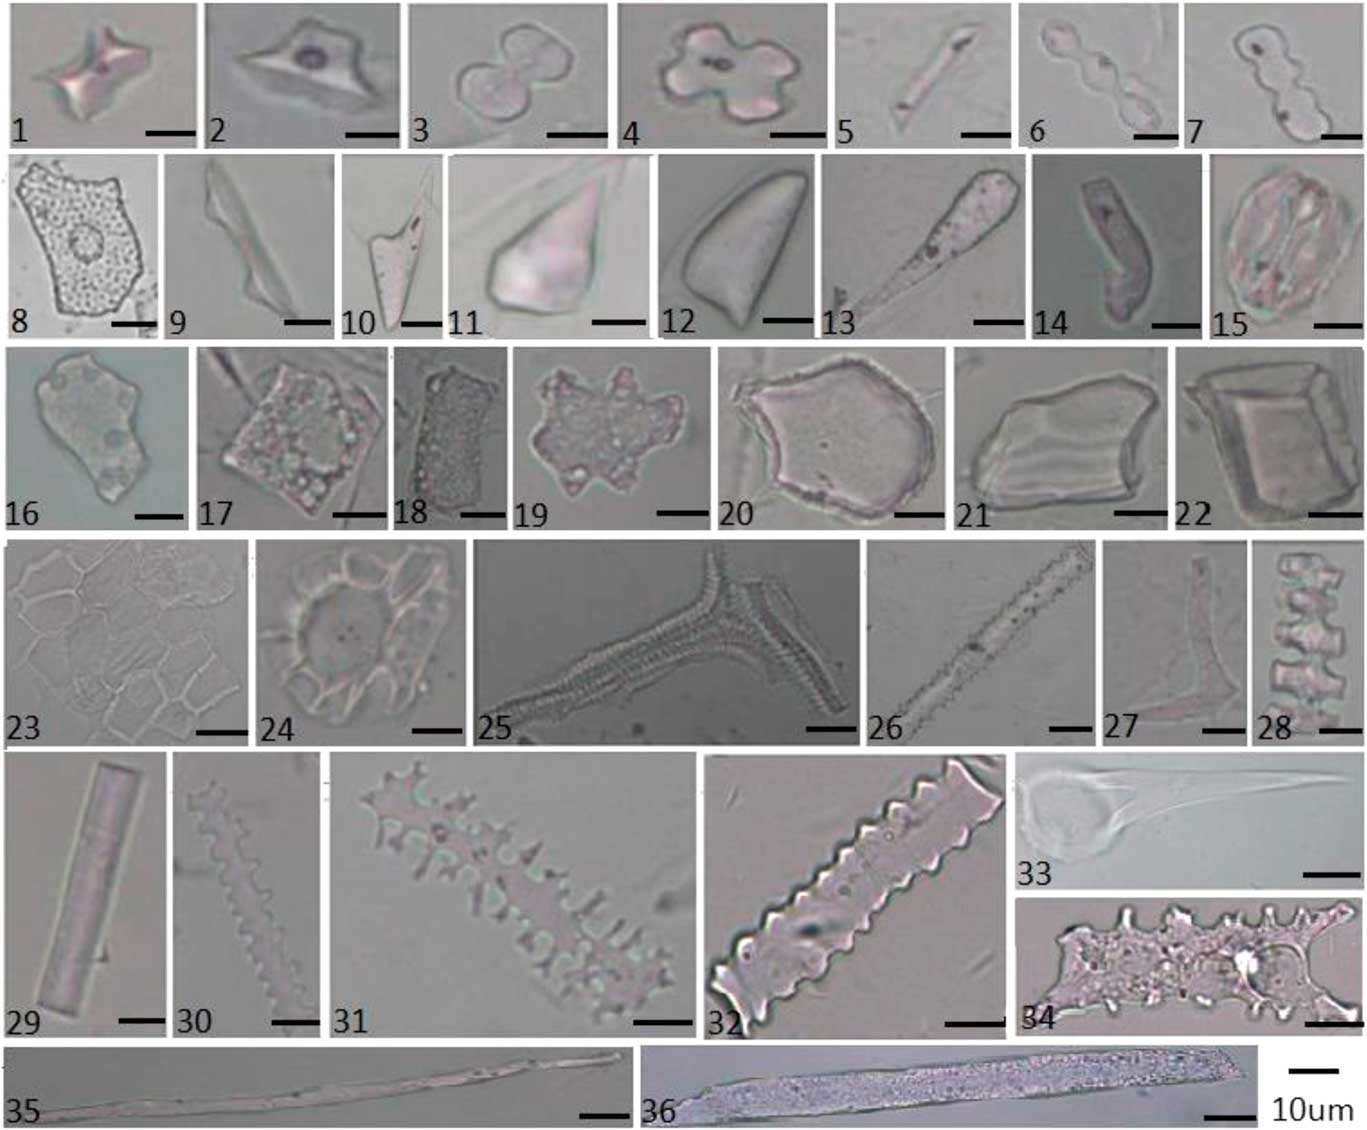
Figure 2 (color online) Phytolith morphotypes from plants in grassland and forest regions in Northeast China: (1) Saddle, (2) Rondel, (3) Bilobate, (4) Cross, (5) Trapeziform sinuate, (6) Cylindrical polylobate, (7) Trapeziform sinuate, (8) Achene phytolith, (9) Conical epidermal, (10) Lanceolate, (11) Prickle, (12) Scutiform, (13) Lanceolate attenuate, (14) Microhair, (15) Stomata, (16) Tabular irregular, (17) Square, (18) Rectangle, (19) Tabular sinuate, (20) Cuneiform, (21) Blocky irregular, (22) Cubic, (23) Epidermal phytolith, (24) Hair base, (25) Tracheid, (26) Elongate echinate, (27) Sclereid, (28) Carinate, (29) Elongate psilate, (30) Elongate crenate, (31) Elongate dendritic, (32) Elongate sinuate, (33) Macrohair, (34) Elongate cavate terminal, (35) Elongate attenuate, and (36) Elongate tabular.
The first group is positively related to the Axis 2 and is distinguished from all the other types. These phytoliths are strongly associated with specific A, CC, and R-values: the A and CC values exceed 0.5; most of the R-values exceed 2.0; and the O and U values are less than 0.3. Thus, the soil phytolith frequencies in this group moderately represent the numbers of parent plants, and the soil phytoliths are associated with the aboveground vegetation. This group is designated “Associated types” and includes the following morphotypes: saddle; rondel; bilobate; cylindrical polylobate; cross; elongate (echinate, attenuate, and psilate); lanceolate; tabular irregular; and trapeziform sinuate. Axis 2 also distinguishes two other groups, one with positive loadings, and the other with negative loadings. The former group is characterized by relatively high values of O (average=0.78), R-values exceeding 5.0, and low values of A, C, CC, and U. In this group, the related morphotypes from surface soil, over-represent the richness of the aboveground plants. This group, designated “Over-represented types,” is composed of the following morphotypes: elongate (crenate, tabular), rectangle, square, cubic, lanceolate attenuate, scutiform, cuneiform, and blocky irregular. Conversely, the latter group, with highest negative loadings on Axis 1, is characterized by U values ranging from 0.5–1.0. However, other representation indexes, i.e., A, O, CC, C, and R-values, are typically lower. These morphotypes have a low abundance in surface soil, although they may be well represented in the aboveground vegetation. Consequently, the frequencies of the morphotypes in this group under-represent the numbers of associated plant taxa. The group is thus designated “Under-represented types” and comprises the following morphotypes: microhair, stomata, conical epidermal, epidermal phytolith, elongate dendritic, hair base, and tracheid. The morphotypes in the final group (elongate [sinuate, cavate terminal], macrohair, prickle, tabular sinuate, carinate, and blocky faceted), exhibit the same values of O and U indices. This is probably due to fact that these types were not observed in soil samples and parent plant samples at the same time, and therefore B0 is equal to zero. Consequently, the corresponding O and U indices are both equal to one. In any case, these morphotypes in soil exhibit significant disparities to the aboveground plant community, and therefore are designated “Special types.”

Figure 3 (color online) Principal components analysis (PCA) biplot of the five representation indexes and 35 phytolith morphotypes for the grassland region.
Forested region
In the forested region, 30 phytolith morphotypes were recognized in the 23 paired soil samples and vegetation samples. The morphotypes were comparable with those from the grassland region, except for six morphotypes (e.g., rectangle, cubic, microhair, hair base, square, and sclereid). Of these, five types were absent in the forest region and one type (sclereid) was only represented in forest region. PCA was conducted on the representation index data (A, O, U, CC, C, and R-values) to determine the morphotype associations. The first two principal components, Axis 1 and Axis 2, account for 88.4% and 6.4% of the variance, respectively. On the biplot of the principal component loadings (Fig. 4, Supplementary Table 4), four groups of morphotypes were identified based on the scores.

Figure 4 (color online) Principal components analysis (PCA) biplot of the five representation indexes and 31 phytolith morphotypes for the forested region.
The first group has high values of A, with A, CC, and R-values greater than 0.5 and positive C and CC. The frequency of these morphotypes in surface soil exhibits a good correlation with the species inventory data, and these types were categorized as “Associated types.” The group, which has the highest loading on the positive end of Axis 2, is composed of the following morphotypes: elongate (psilate, tabular, echinate, and attenuate); lanceolate; blocky irregular; tabular (irregular, sinuate); and cuneiform. The second group has O and R-values above 0.5, and relatively low values of both the A and U. The phytoliths in this group contribute significantly to the soil phytolith assemblages, while the parent plant taxa are less abundant in the vegetation censuses. They are therefore designated “Over-represented types.” They are on the positive end of Axis 1 of the PCA. They consist of the following 9 morphotypes: elongate (sinuate, crenate), trapeziform sinuate, lanceolate attenuate, rondel, bilobate, cylindrical polylobate, saddle, and prickle. The third group has high values of U and low values of the other indices. The members of the group are classified as “Under-represented types,” and exhibit low frequencies in the soil samples in relation to the abundance of the aboveground parent plants. The group has the highest loadings on the negative end of Axis 1 of the PCA. The group comprises the following morphotypes: epidermal phytolith, tracheid, conical epidermal, elongate cavate terminal, stomata, blocky faceted, and macrohair. The other types exhibit high values of the O index and U index, and their representation needs to be further explored. They are designated “Special types” and include cross, carinate, sclereid, elongate dendritic, and scutiform.
In conclusion, for most of the morphotypes, potential biases exist for their use in soil phytolith analysis to reflect the relative abundance of the aboveground parent plants. There is a great diversity among the phytolith morphotypes in terms of their representation of the parent plants. In addition, the same type can exhibit a different degree of representation in grassland samples and forest samples. Consequently, this representational bias must be corrected before soil phytoliths are used as a modern reference for phytoliths in paleosols.
Use of correction factors to calibrate modern soil phytoliths in the grassland and forest regions of Northeast China
As has been stated, most of the representation indexes (i.e., A, O, U, and CC) used to assess phytolith representation have followed the morphological approach. R-values were subsequently introduced to compare the representation quantity of phytoliths from living plant communities with those from paired surface soils. In our dataset, the R-values are positively related with the A, CC, and O values, and have a negative relationship with U values. In addition, the distribution of the magnitude of R-values for samples from forest and those from grassland exhibits a roughly similar trend (Fig. 5). Over-represented types and Associated types have the highest R-values (mainly greater than 5.0), although there are considerable variations. The lowest R-values are observed in the Under-represented types and Special types, with values mainly less than 1.0 (average=0.39). In general, the high R-values are moderately consistent with a high level of representation. Thus, the use of R-values is a promising quantitative approach for calibrating soil phytolith representation, and representational biases of the soil phytolith content can be reduced by dividing the R-value. Notably, the same phytolith types exhibit a highly variable representation between grassland samples and forest samples (Fig. 6). Some of the diagnostic types exhibit a significantly different representation in grassland samples compared to forest samples; examples are the distinctive morphotypes of grasses (e.g., saddle and cylindrical polylobate) and those of woody plants (e.g., blocky irregular and elongate tabular). Consequently, when R-values are used to correct for representational bias, it is advisable that samples from grassland and forested regions are treated separately.
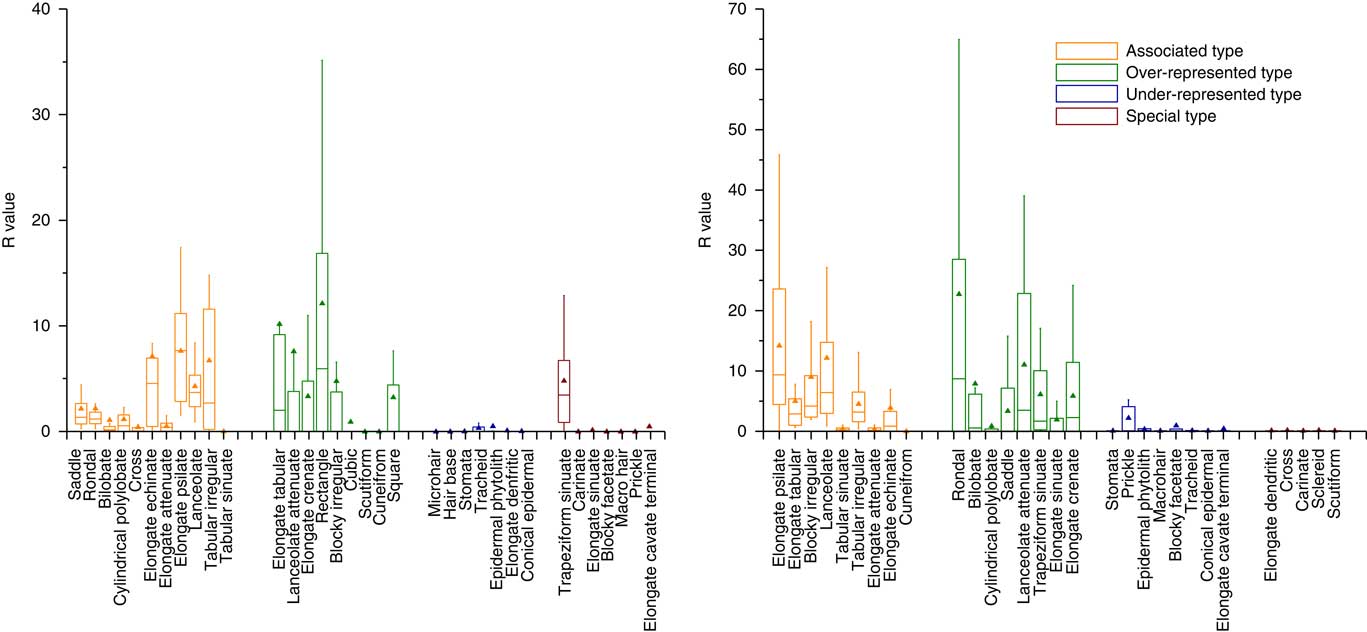
Figure 5 (color online) R-values of different phytolith types in the grassland region (left) and forested region (right) of Northeast China.
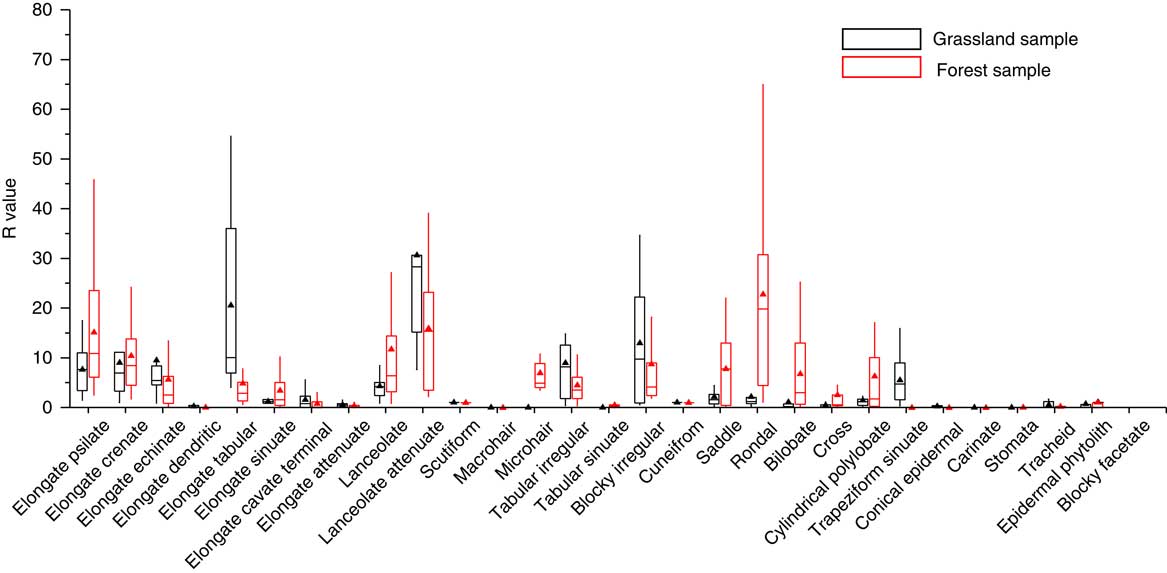
Figure 6 (color online) Comparison of the R-values of phytolith types in the grassland region and forested region in Northeast China.
To assess the reliability of R-values for reducing the representational bias of soil phytoliths, an additional 29 surface soil samples from sites with a known vegetation composition were collected. The raw phytolith percentage contents were calculated, and the relative abundances of each morphotype were corrected by dividing the R-value calculated from the paired soil and plant phytolith comparison. Then the raw and corrected relative total phytolith contents (woody phytolith sum, herbaceous phytolith sum) were calculated, respectively. The phytolith taxonomy for woody and herbaceous phytoliths followed Gao et al. (Reference Gao, Jie, Wang, Liu, Liu, Li, Li, Shi and Leng2017) and was shown in Supplementary Tables 3 and 4. In addition, the tree cover density index (W/G) was equal to the ratio of woody phytoliths to the sum of herbaceous phytoliths contents (Gao et al., Reference Gao, Jie, Wang, Liu, Liu, Li, Li, Shi and Leng2017). Climate index (Ic) is the percentage of short cell phytoliths, mainly produced by Pooideae relative to the sum of short cell phytoliths produced by Pooideae, Chloridoideae, and Panicoideae grasses (Bremond et al., Reference Bremond, Alexandre, Wooller, Hély, Williamson, Schäfer, Majule and Guiot2008). Subsequently, a comparison of the raw and corrected phytolith contents was made (Fig. 7).
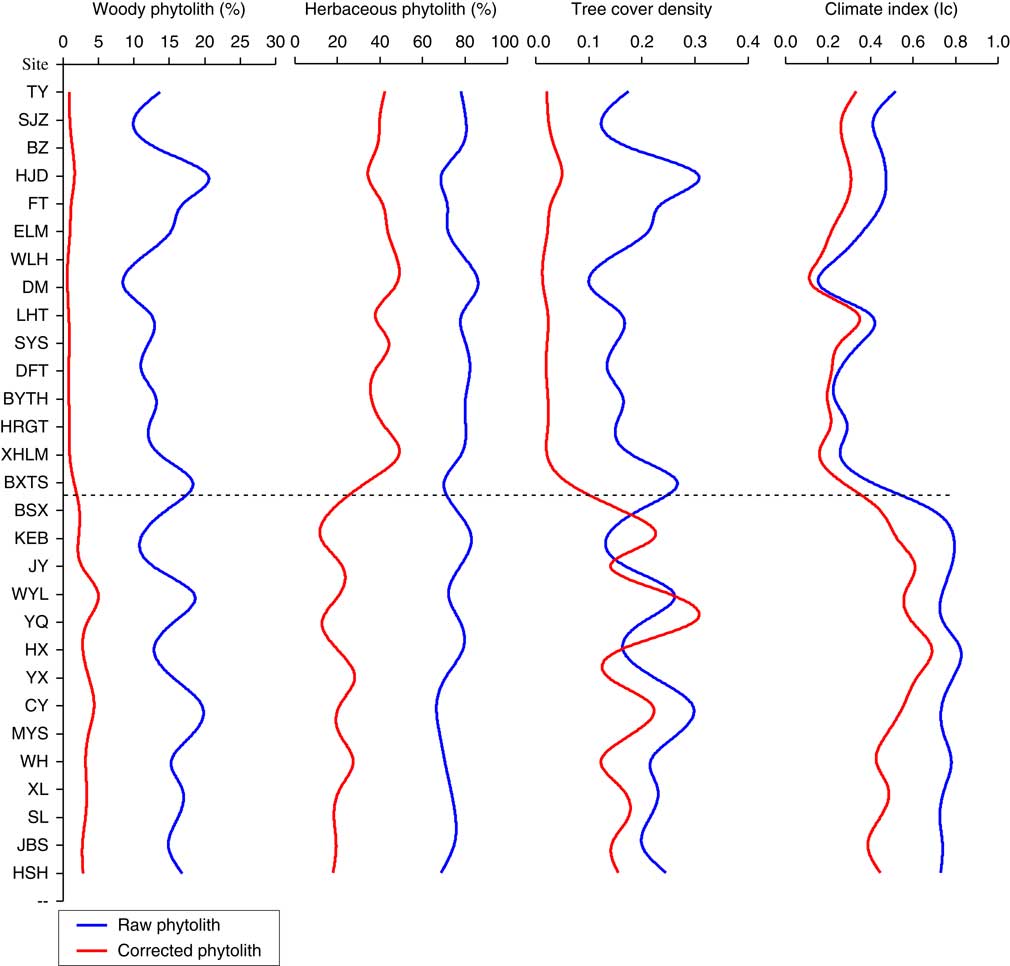
Figure 7 (color online) Soil phytoliths in grassland (upper) and forest (lower) before and after calibration.
In the case of total woody phytoliths, the raw data values ranged from 10–20% in both forest and grassland samples, with the woody phytolith content of grassland samples (average 13.45%) being slightly lower than in forest samples (average 15.50%). In some cases, however, the woody phytolith contents were higher in grassland samples than in forest samples, and the raw value was inconsistent with the actual woody plant richness. After calibration, the woody phytolith content decreased sharply, with values ranging between 0 and 1.5% in the grassland region and greater than 2% in the forest region. The woody phytolith content of grassland plots was consistently different from that in forest plots, and was in accord with the woody plants abundance in both grassland and forest regions. For the herbaceous phytolith content, the uncorrected values varied from 70–80% and showed a roughly similar trend between forest and grassland samples, although the amount in grassland samples (average=77.61%) was slightly higher than in forest samples (average=74.04%). After calibration with R-values, the herbaceous phytolith content decreased to 30–40% in grassland samples and to less than 20% in forest samples. Sites of varying plant composition can be distinguished based on the calibrated herbaceous phytolith content, and the results reduced the variability between the herbaceous phytolith content and the aboveground herbaceous plant data. In the case of the W/G, the values varied from 0.1–0.3 in both grassland and forest samples; these uncorrected tree cover density index may not be a viable proxy for reflecting the actual tree cover density in Northeast China. After calibration, as expected, values of the forest samples (greater than 0.1) far exceeded the values in grassland samples (less than 0.05), and the phytolith index exhibited a positive relationship with the tree inventory data. Unlike the phytolith content and index values considered above, values of Ic exhibit a roughly similar trend before and after calibration. The Ic values were higher in forest samples (greater than 0.4) compared to grassland samples (less than 0.4). In our dataset, there was a good correlation between the Ic index and the species inventory data. Overall, phytolith records calibrated by R-values can reliably detect variations in vegetation of differing composition, and these records exhibited a better relationship with the aboveground plant data. Thus, our results provide improved phytolith analogues for the phytolith assemblages from paleosols, which are potentially useful for paleoenvironmental reconstruction.
DISCUSSION
Representation of different phytoliths morphotypes and the influencing factors
The phytolith morphotypes exhibit a wide range of representation. Most of phytolith representation in our dataset was consistent with the studies of phytolith preservation. For example, the relatively fragile morphotypes (e.g., hairs, conical epidermal, and stomata) showed poor preservation and under-represent the abundance of the parent plants at the same time, while phytolith types that appear to be relatively well-preserved in soil (e.g., elongate psilates and blocky irregular) accurately represent the abundance of the parent plants (Piperno, Reference Piperno2006; Cabanes et al., Reference Cabanes, Weiner and Shahack-Gross2011). However, there are some discrepancies between our own and previous observations in the case of the short cell phytolith and elongate morphotypes. Albert et al. (Reference Albert, Bamford and Cabanes2006) found that short cell phytoliths from a tropical region (Tanzania) exhibited a low abundance, resulting in the parent plants being under-represented, while in contrast in our dataset, most of the short cell phytoliths exhibit an equivalent abundance to the aboveground vegetation. Most of the elongate morphotypes in our dataset were moderately consistent with the parent plant richness in the plot inventory data, while elongate dendritic and elongate cavate terminal forms largely under-represented the parent plants, which may be inconsistent with the previous observations. The discrepancy can potentially be explained by two factors. On the one hand, previous work did not take phytolith production into consideration, and it is uncertain whether the low phytolith abundance in soil under-represented the richness of the parent plants. On the other hands, vegetation type and environmental factors are more variable in tropical regions than in temperate regions, and several factors may greatly complicate phytolith representation in different regions, e.g. soil order type and mean annual temperature (Osterrieth et al., Reference Osterrieth, Madella, Zurro and Alvarez2009; Hyland et al., Reference Hyland, Smith and Sheldon2013).
Remarkably, there are large disparities in the representation of certain phytolith types in grassland regions and forest regions, especially in the case of diagnostic morphotypes, such as saddle, bilobate, and blocky irregular (Carnelli et al. Reference Carnelli, Theurillat and Madella2004; Biswas et al., Reference Biswas, Ghosh, Paruya, Mukherjee, Thapa and Bera2016). Considering that soil phytolith assemblages represent the vegetation averaged over several years and some fragile types may be dissolved by various processes, the soil phytolith content in grassland regions and forest regions is reasonably similar (Bremond et al., Reference Bremond, Alexandre, Hely and Guiot2005a). Thus, disparities in the representation of the same types between grassland and forest regions may be the result of wide variations in phytolith production. In the grassland samples, the quantities of grass phytoliths are higher than in the forest samples, and therefore the representation of certain morphotypes in grassland is consistently lower than in forest areas. Similarly, since the diagnostic phytoliths of woody plants are more abundant in forest samples than in grassland samples, combined with the relatively reasonable diversity of soil phytolith, their representation values in the forest region are therefore lower than in the grassland region. This result further reinforces the necessity of analyzing phytolith representation and correction factors based on a specific vegetation types. In summary, the combined effects of phytolith production and taphonomic factors are a significant source of bias in soil phytolith representation.
Phytolith representation in soils may be skewed by several factors. As Hyland et al. (Reference Hyland, Smith and Sheldon2013) noted, soil type, which integrates a wide range of environmental variables, is significantly correlated with representational bias. Undoubtedly, the factors influencing phytolith production and taphonomy also play an important role in phytolith representation. For phytolith production, two primary mechanisms, genetically and environmentally determined, control the formation of opaline silica in the living plant (Madella et al., Reference Madella, Jones, Echlin, Powers-Jones and Moore2009). Previous work has indicated that phytolith production was influenced more by the phylogenetic position of a plant rather than by environmental factors such as water availability, soil temperature, and Si availability in the soil (Pataki and Oren, Reference Pataki and Oren2003; Madella and Lancelottib, Reference Madella and Lancelottib2012). For example, differences in biomass production rates and silica uptake result in greater phytolith production by grasses compared to broad-leaved trees (Hodson et al., Reference Hodson, White, Mead and Broadley2005; Piperno, Reference Piperno2006); Environmental factors influence phytolith size and phytolith assemblages via their effects on plant transpiration and Si translocation (Madella et al., Reference Madella, Jones, Echlin, Powers-Jones and Moore2009). In the case of phytolith taphonomy, on the one hand, phytolith characteristics such as the presence of Al impurities, phytolith maturity and specific surface area are important factors in phytolith preservation (Fraysse et al., Reference Fraysse, Pokrovsky, Schott and Meunier2006, Reference Fraysse, Pokrovsky, Schott and Meunier2009). Phytoliths with large Al impurities and surface area were generally prone to dissolution. On the other hand, when soil phytoliths are subjected to pedogenesis and diagenesis, they may completely or partially dissolve under different environmental conditions (Madella and Lancelottib, Reference Madella and Lancelottib2012). For example, soil phytoliths are prone to dissolve under alkaline pH conditions (Cabanes et al., Reference Cabanes, Weiner and Shahack-Gross2011) and soil phytoliths are consistently associated with soil organic matter (Alexandre et al., Reference Alexandre, Meunier, Colin and Koud1997). In addition, many other environmental factors (e.g., MAP, MAT, EEMT, elevation) have been suggested as sources of bias in previous work (Hyland et al., Reference Hyland, Smith and Sheldon2013). In brief, the abovementioned factors would be expected to have some degree of impact on soil phytolith representation. However, the mechanisms that determine phytolith representation on archaeological and geological time scales need to be further studied.
Soil phytolith calibration and its implications for palaeovegetation reconstruction
The soil phytolith assemblages presented broadly comparable representational bias. Most grass phytolith in soil samples largely over-represent the living parent plants, and high abundance of grass phytoliths greatly suppresses the representation of woody phytoliths. Grass phytoliths therefore dominate phytolith assemblages in both grassland samples and forest samples (Kirchholtes et al., Reference Kirchholtes, Mourik and Johnson.2014; Biswas et al., Reference Biswas, Ghosh, Paruya, Mukherjee, Thapa and Bera2016), and it reduced the soil phytoliths variability between grassland samples and forest samples. Thus, the frequencies of uncorrected phytolith assemblages do not show any clear trend with vegetation type and therefore the use of soil phytoliths without correction is less reliable than other proxies for tracing vegetation variability and hence for paleovegetation reconstruction in Northeast China. Similar conclusions were reached for other temperate regions (Kerns, Reference Kerns2001).
To date, there are only a few studies of soil phytolith representation and even fewer of the calibration of modern soil surface phytolith assemblages with defined vegetation (Prebble et al., Reference Prebble, Schallenberg, Carter and Shulmeister2002; Delhon et al., Reference Delhon, Alexandre, Berger, Thiébault, Brochier and Meunier2003; Hyland et al., Reference Hyland, Smith and Sheldon2013). Related research is hindered by the complications arising from multiplicity and redundancy within phytolith morphotypes (Piperno, Reference Piperno2006), which has resulted in the existing work usually considering only a few morphotypes or indices with relevant taxonomic significance, such as D/P, grass phytoliths, and conifer phytoliths (Bremond et al., Reference Bremond, Alexandre, Hely and Guiot2005a; Hyland et al., Reference Hyland, Smith and Sheldon2013; Dunn et al., Reference Dunn, Strömberg, Madden, Kohn and Carlini2015). R-values in this study successfully corrected the phytolith morphotypes recognized from these sites. The corrected herbaceous phytoliths content in forest samples and woody phytoliths content in grassland samples decreased significantly. Accordingly, samples from the grassland and forest regions can be clearly differentiated by examining their phytolith spectra and indices. Importantly, we observed no significant differences in the values of C3/C4 indices between the uncorrected and corrected phytolith data. The minor differences are likely to result from similar representational biases observed in all the short cell phytoliths. Thus, the representational biases of short cell phytoliths did not mask the grass plant signal, which further supports the previous recognition that phytolith analyses can be applied to Poaceae dominated communities (Blinnikov et al., Reference Blinnikov, Busacca and Whitlock2002; Strömberg et al., Reference Strömberg, Werdelin, Friis and Saraç2007). Therefore, in our dataset, the application of R-values is an important step forward in reconciling the representational bias between soil phytoliths and the parent plants.
Most of the phytolith- paleovegetation reconstruction are based on relative percentages of phytolith assemblages from paleosols, and are interpreted directly as an index of relative vegetation abundance in the paleoenvironment (Blinnikov et al., Reference Blinnikov, Busacca and Whitlock2002). However, the representational biases greatly complicate the interpretation of vegetation change from phytolith records. It is difficult to infer precisely the dominant species and composition of the historical community types from the phytolith data, due to the high degree of phytolith representational variability. As reported, this is especially problematic in temperate ecosystems. In temperate regions, several common families do not appear to accumulate silica at all (e.g., Fabaceae and Brassicaceae) and are absent from the soil phytolith record (Blinnikov et al., Reference Blinnikov, Bagent and Reyerson2013); Some broadleaved trees exhibit high abundances of fragile, poorly preserved morphotypes, such as hair and epidermal phytoliths, but which only contribute amorphous biogenic silica to the soils (Morris et al., Reference Morris, Baker, Morris and Ryel2009). Therefore, in temperate regions, any quantitative paleovegetation reconstruction using phytoliths from paleosols should begin with assessing and calibrating the representational bias. The paleosol phytolith content corrected with correction factors (R-values) can reliably be used for tracing vegetation change in the geologic record. Our findings provide an improved understanding of the representation of soil phytoliths and offer a potential method for improving the accuracy of paleovegetation reconstructions.
CONCLUSION
Our study of soil phytoliths in Northeast China has revealed 34 and 30 morphotypes from grassland and forest, respectively, together with a high degree of diversity of phytolith representation. The morphotypes were classified into four groups based on their relationship with plant inventory data: “Associated types” were consistent with the inventory data; “Over-represented types” were over-represented compared to the abundance of the related parent plant; and “Under-represented types” were under-represented; the representation of the fourth category, “Special types,”was unclear. In addition, some phytolith types exhibited highly variable representation across grassland samples and forest samples. The diagnostic types exhibited different degrees of representation, while the most common morphotypes were equally represented. Consequently, any study using soil phytoliths as a modern reference for paleosol phytoliths should begin with the calibration of their representational bias.
To assess the reliability of R-values for reducing the representational bias in soil phytolith assemblages, a comparison between the original and corrected soil phytolith indices with known vegetation compositions was conducted. The original soil phytolith content and phytolith indices with a relevant taxonomic significance exhibited a roughly similar trend in forest and grassland samples. After calibration with R-values, the frequencies of corrected soil phytoliths differed between plots with a differing plant composition, and were moderately consistent with actual plant richness in the plot inventory data. In temperate regions, R-values are confirmed to be a promising approach for calibrating the bias in a given ecosystem. Furthermore, the corrected soil phytoliths can reliably be used for tracing vegetation variability and therefore are potentially usefulness in vegetation reconstruction. Overall, our findings provide an improved understanding of the representation of soil phytoliths and offer a potential method for improving the accuracy of paleovegetation reconstructions.
ACKNOWLEDGMENTS
This work was supported by the National Nature Science Foundation of China (grant no. 41471164, 41771214), the National Key R and D Plan (grant no. 2016YFA0602301) and the Public Welfare Project of Ministry of Environmental Protection (grant no. 201109067).
SUPPLEMENTARY MATERIAL
To view supplementary material for this article, please visit https://doi.org/10.1017/qua.2018.5


