1 Introduction
Ventilation occurs when air or other non-condensible gas is entrained in a hydraulic flow, often from a free surface. Many high-lift devices, such as propellers and hydrofoils, that operate near or at a free surface are prone to atmospheric ventilation. Ventilated flows can be leveraged to improve the stability and efficiency of lift-generating devices operating at specific conditions; examples include air injection on supercavitating propellers and parasitic drag reduction in surface-piercing propellers. Conversely, when unwanted ventilation occurs, the transition from low-pressure wetted flow to relatively high-pressure aerated flow can cause dramatic reductions in lift and efficiency. Stepped bottoms and hard chines on planing-craft hulls, the sharp demi-hulls of multi-hulled vessels, and waterjet inlets are other examples of entities subjected to atmospheric ventilation.
In this work, the atmospheric ventilation of a surface-piercing hydrofoil is investigated at low-to-moderate Froude numbers, with a focus on the formation, elimination and stability of ventilated cavities. In performing this work, the authors strive to expand upon the body of existing research, and to elucidate upon some previously disparate concepts in the comprehension of atmospheric ventilation. The work addresses this overarching objective in the following ways. (1) Characteristic steady flow regimes are formally classified, and the stability and hydrodynamic performance of the hydrofoil in each flow regime are quantified. (2) The transition mechanisms of ventilation formation and elimination are formally classified, and the flow conditions permitting ventilation formation and/or elimination are identified. (3) A scaling relationship is developed for the stage of ventilation elimination known as ‘washout’.
Section 1.1 contains a survey of the literature. In § 1.2, a modified lifting-line model is briefly described, which is used to complement the experimental results and provide insight into the physics of ventilated cavity flow. The experimental programme is described in § 2. Steady flow regimes are discussed in § 3, with a discussion of the re-entrant jet in § 3.1, a strengthened set of classification criteria in § 3.2, a discussion of steady hydrodynamic loading in § 3.3 and a parametric representation of flow-regime stability boundaries in § 3.4. In § 4, the unsteady transition processes that move the flow between stable regimes of ventilation are described, with ventilation formation mechanisms in § 4.1 and ventilation elimination mechanisms in § 4.2. To be succinct, most of the results shown are for a partial immersion depth equal to one chord length, although results from other immersion depths are used to validate the scaling approach derived in § 4.2.1. Results for all three depths of immersion may be found in appendix A. Concluding remarks are offered in § 5.
1.1 Previous research
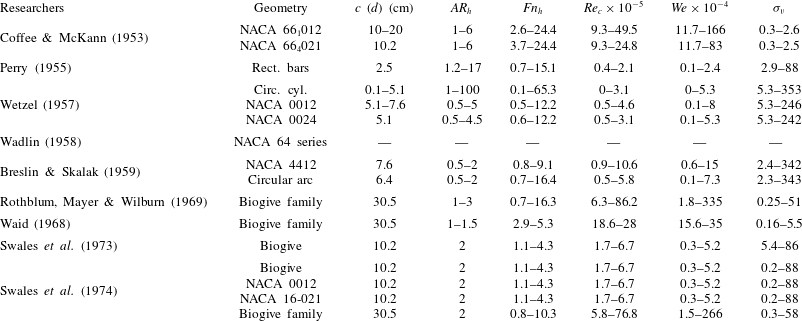
Ventilated flows around surface-piercing bodies were extensively studied in the 1950s, the 1960s and the 1970s, spurred by interest in high-speed hydrofoil-supported vessels. A summary of past experimental studies is tabulated in table 1 as a convenient reference for the parameter ranges examined in each study.
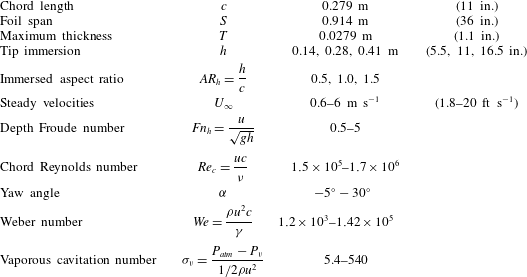
Table 1. Summary of previous studies. Included are the geometric configuration of the model, the chord length
![]() $c$
(but in the cases where the geometry is a circular cylinder, the rod diameter
$c$
(but in the cases where the geometry is a circular cylinder, the rod diameter
![]() $d$
is used), the range of immersed aspect ratios
$d$
is used), the range of immersed aspect ratios
![]() $AR_{h}=h/c$
, the range of depth Froude numbers
$AR_{h}=h/c$
, the range of depth Froude numbers
![]() $Fn_{h}=u/\sqrt{gh}$
, the range of chord-based Reynolds numbers
$Fn_{h}=u/\sqrt{gh}$
, the range of chord-based Reynolds numbers
![]() $\mathit{Re}_{c}=uc/{\it\nu}$
, the range of Weber numbers
$\mathit{Re}_{c}=uc/{\it\nu}$
, the range of Weber numbers
![]() $We={\it\rho}u^{2}c/{\it\gamma}$
and the range of vaporous cavitation numbers at the free-surface plane
$We={\it\rho}u^{2}c/{\it\gamma}$
and the range of vaporous cavitation numbers at the free-surface plane
![]() ${\it\sigma}_{v}=(P_{a}tm-P_{v})/({\it\rho}u^{2}/2)$
. Parameters not given in the original report have been calculated from the bounding values reported for test conditions. Where minimum or maximum parameter values were not stated, they were inferred from the results in the respective reports. Empty cells indicate that insufficient data about the study were provided to make an estimation.
${\it\sigma}_{v}=(P_{a}tm-P_{v})/({\it\rho}u^{2}/2)$
. Parameters not given in the original report have been calculated from the bounding values reported for test conditions. Where minimum or maximum parameter values were not stated, they were inferred from the results in the respective reports. Empty cells indicate that insufficient data about the study were provided to make an estimation.

Perry (Reference Perry1955) found that the separated wake behind bluff bodies piercing the free surface was easily aerated, and that, given a suitable perturbation, a ventilated cavity could extend beyond the low-energy wake to envelop much of the body. Kiceniuk (Reference Kiceniuk1954) showed that ventilation could also occur on streamlined hydrofoils when the yaw angle (
![]() ${\it\alpha}$
, which is also the angle of attack for vertically oriented hydrofoils and struts) exceeded the stall angle. Once a cavity was present, it remained stable across a wide range of angles, including those below the stall angle at which ventilation occurred. In both studies, air was initially entrained into low-pressure regions of separated flow, but with sufficiently large amounts of ventilation, a new stable state was reached, with a cavity extending beyond the original wetted zone of flow separation.
${\it\alpha}$
, which is also the angle of attack for vertically oriented hydrofoils and struts) exceeded the stall angle. Once a cavity was present, it remained stable across a wide range of angles, including those below the stall angle at which ventilation occurred. In both studies, air was initially entrained into low-pressure regions of separated flow, but with sufficiently large amounts of ventilation, a new stable state was reached, with a cavity extending beyond the original wetted zone of flow separation.
Wetzel (Reference Wetzel1957) performed experiments on partially immersed cylindrical rods with diameters between 0.8 mm and 5.1 cm (
![]() $1/32$
–2 in.) and vertical symmetric struts to study the scale effects associated with the transition between wetted and ventilated flows. The Reynolds number and Weber number were varied independently from the Froude number by heating the water and adding detergents respectively. While not directly reported, his data showed that the effect of Weber number was negligible above a critical value of
$1/32$
–2 in.) and vertical symmetric struts to study the scale effects associated with the transition between wetted and ventilated flows. The Reynolds number and Weber number were varied independently from the Froude number by heating the water and adding detergents respectively. While not directly reported, his data showed that the effect of Weber number was negligible above a critical value of
![]() $We={\it\rho}u^{2}l/{\it\gamma}\approx 250$
, where
$We={\it\rho}u^{2}l/{\it\gamma}\approx 250$
, where
![]() $u$
is the forward speed of the hydrofoil,
$u$
is the forward speed of the hydrofoil,
![]() $l$
is the characteristic length (rod diameter
$l$
is the characteristic length (rod diameter
![]() $d$
or strut section chord length
$d$
or strut section chord length
![]() $c$
),
$c$
),
![]() ${\it\rho}$
is the liquid density and
${\it\rho}$
is the liquid density and
![]() ${\it\gamma}$
is the surface tension constant in
${\it\gamma}$
is the surface tension constant in
![]() $\text{Nm}^{-1}$
. In the case of yawed struts, ventilation at yaw angles of
$\text{Nm}^{-1}$
. In the case of yawed struts, ventilation at yaw angles of
![]() ${\it\alpha}\leqslant 21^{\circ }$
was hysteretic and dependent upon the yaw angle, sometimes occurring suddenly in what the author dubbed ‘flash’ ventilation. At angles of attack exceeding the stall angle (
${\it\alpha}\leqslant 21^{\circ }$
was hysteretic and dependent upon the yaw angle, sometimes occurring suddenly in what the author dubbed ‘flash’ ventilation. At angles of attack exceeding the stall angle (
![]() ${\it\alpha}\geqslant 21^{\circ }$
), ventilation occurred gradually through entrainment of air into the stalled wake (dubbed ‘creeping’ ventilation). The latter type of ventilation was found to scale with the depth-based Froude number,
${\it\alpha}\geqslant 21^{\circ }$
), ventilation occurred gradually through entrainment of air into the stalled wake (dubbed ‘creeping’ ventilation). The latter type of ventilation was found to scale with the depth-based Froude number,
where
![]() $h$
is the static immersion depth of a surface-piercing body and
$h$
is the static immersion depth of a surface-piercing body and
![]() $g$
is gravitational acceleration. Large-diameter cylinders for which
$g$
is gravitational acceleration. Large-diameter cylinders for which
![]() $We\geqslant 250$
and hydrofoils at yaw angles of
$We\geqslant 250$
and hydrofoils at yaw angles of
![]() ${\it\alpha}\geqslant 21^{\circ }$
both ventilated via the ‘creeping’ process at a constant
${\it\alpha}\geqslant 21^{\circ }$
both ventilated via the ‘creeping’ process at a constant
![]() $Fn_{h}\approx 1.7$
.
$Fn_{h}\approx 1.7$
.
Wadlin (Reference Wadlin1958) studied an unyawed vertical surface-piercing hydrofoil with a cambered section profile. Oil-smear visualizations on the suction surface indicated a laminar separation bubble near the trailing edge, but the separated flow did not extend to the free surface. When air was artificially injected into the separated flow, it displaced the water to form a cavity of approximately the same size as the preceding separation zone. Wadlin (Reference Wadlin1958) concluded that both low pressures and separated flow are required for ventilation to occur. He referenced the experiment by Coffee & McKann (Reference Coffee and McKann1953), in which vaporous cavitation (when the liquid changes phase to vapour, caused by a reduction of the local pressure to the saturated vapour pressure of the fluid) occurred on the afterbody of an unyawed surface-piercing hydrofoil at speeds in excess of
![]() $23~\text{m}~\text{s}^{-1}$
(
$23~\text{m}~\text{s}^{-1}$
(
![]() $Fn_{h}>16$
). The presence of vaporous cavitation provided visual evidence of the necessary low pressures and flow separation, but ventilation did not automatically occur. In Wadlin’s experiment, ventilation was induced by ‘disturbing the water surface in the vicinity of the leading edge’. The ‘disturbance’ was probably a thin wire inserted into the flow, although the exact method was unspecified. The disturbance served to rupture the barrier of unseparated flow near the free surface, allowing air to enter and occupy the ventilation-ready flow. The ventilated cavity gradually disappeared once the disturbance was removed, leading Wadlin (Reference Wadlin1958) to conclude two things: first, that low-pressure paths (such as shear flows or the cores of shed vortices) must be available to permit the ingress of air into a ventilation-ready flow before ventilation can occur, and, second, that those air paths must remain available for ventilated cavities to persist.
$Fn_{h}>16$
). The presence of vaporous cavitation provided visual evidence of the necessary low pressures and flow separation, but ventilation did not automatically occur. In Wadlin’s experiment, ventilation was induced by ‘disturbing the water surface in the vicinity of the leading edge’. The ‘disturbance’ was probably a thin wire inserted into the flow, although the exact method was unspecified. The disturbance served to rupture the barrier of unseparated flow near the free surface, allowing air to enter and occupy the ventilation-ready flow. The ventilated cavity gradually disappeared once the disturbance was removed, leading Wadlin (Reference Wadlin1958) to conclude two things: first, that low-pressure paths (such as shear flows or the cores of shed vortices) must be available to permit the ingress of air into a ventilation-ready flow before ventilation can occur, and, second, that those air paths must remain available for ventilated cavities to persist.
Breslin & Skalak (Reference Breslin and Skalak1959) performed a series of experiments on yawed surface-piercing hydrofoils with and without cambered sections with chord lengths of
![]() $c=7.6$
cm and
$c=7.6$
cm and
![]() $c=6.4$
cm respectively. They defined ventilation as a flow regime characterized by the entrainment of a ‘smooth-walled’ air-filled cavity along the entire immersed span of a hydrofoil. Ventilation caused a reduction of up to 70 % in the measured lift coefficient
$c=6.4$
cm respectively. They defined ventilation as a flow regime characterized by the entrainment of a ‘smooth-walled’ air-filled cavity along the entire immersed span of a hydrofoil. Ventilation caused a reduction of up to 70 % in the measured lift coefficient
![]() $C_{L}$
relative to fully wetted flows at the same conditions (the expression for
$C_{L}$
relative to fully wetted flows at the same conditions (the expression for
![]() $C_{L}$
is given in § 3.3). The appearance and disappearance of ventilated cavities were respectively termed ventilation ‘inception’ and ‘closure’. It should be noted that, in the present work, the term ‘formation’ is used in place of ‘inception’, which will be given a more specific definition in the following sections. Likewise, ‘closure’ is replaced by ‘elimination’ to avoid confusion with the downstream extent of a gaseous cavity, known as a cavity ‘closure region’. At post-stall angles of attack/yaw angles (
$C_{L}$
is given in § 3.3). The appearance and disappearance of ventilated cavities were respectively termed ventilation ‘inception’ and ‘closure’. It should be noted that, in the present work, the term ‘formation’ is used in place of ‘inception’, which will be given a more specific definition in the following sections. Likewise, ‘closure’ is replaced by ‘elimination’ to avoid confusion with the downstream extent of a gaseous cavity, known as a cavity ‘closure region’. At post-stall angles of attack/yaw angles (
![]() ${\it\alpha}\geqslant 20^{\circ }$
), ventilation formation occurred spontaneously and gradually, with air entrainment occurring through eddies in the separated wake, similar to the base flow behind bluff bodies and highly yawed hydrofoils observed by Wetzel (Reference Wetzel1957). At angles approaching stall (
${\it\alpha}\geqslant 20^{\circ }$
), ventilation formation occurred spontaneously and gradually, with air entrainment occurring through eddies in the separated wake, similar to the base flow behind bluff bodies and highly yawed hydrofoils observed by Wetzel (Reference Wetzel1957). At angles approaching stall (
![]() ${\it\alpha}\approx 15^{\circ }{-}18^{\circ }$
), vortices were shed by the imminently stalled flow. The shed vorticity intersected the free surface, aerating through the vortex cores and drawing air into locations of peak suction pressure on the hydrofoil to cause ventilation. At very small immersion depths and moderate angles of attack (
${\it\alpha}\approx 15^{\circ }{-}18^{\circ }$
), vortices were shed by the imminently stalled flow. The shed vorticity intersected the free surface, aerating through the vortex cores and drawing air into locations of peak suction pressure on the hydrofoil to cause ventilation. At very small immersion depths and moderate angles of attack (
![]() $14^{\circ }\leqslant {\it\alpha}\leqslant 18^{\circ }$
and
$14^{\circ }\leqslant {\it\alpha}\leqslant 18^{\circ }$
and
![]() $AR_{h}=h/c=0.5$
, where
$AR_{h}=h/c=0.5$
, where
![]() $AR_{h}$
is known as the immersed aspect ratio), ventilation formation occurred through the ingestion of air into the tip vortex far downstream of the hydrofoil, at which point the vortex core aerated, transporting air upstream to the suction side of the hydrofoil. Breslin & Skalak (Reference Breslin and Skalak1959) also showed that ventilation could be triggered at sub-stalled angles (
$AR_{h}$
is known as the immersed aspect ratio), ventilation formation occurred through the ingestion of air into the tip vortex far downstream of the hydrofoil, at which point the vortex core aerated, transporting air upstream to the suction side of the hydrofoil. Breslin & Skalak (Reference Breslin and Skalak1959) also showed that ventilation could be triggered at sub-stalled angles (
![]() ${\it\alpha}\leqslant 14^{\circ }$
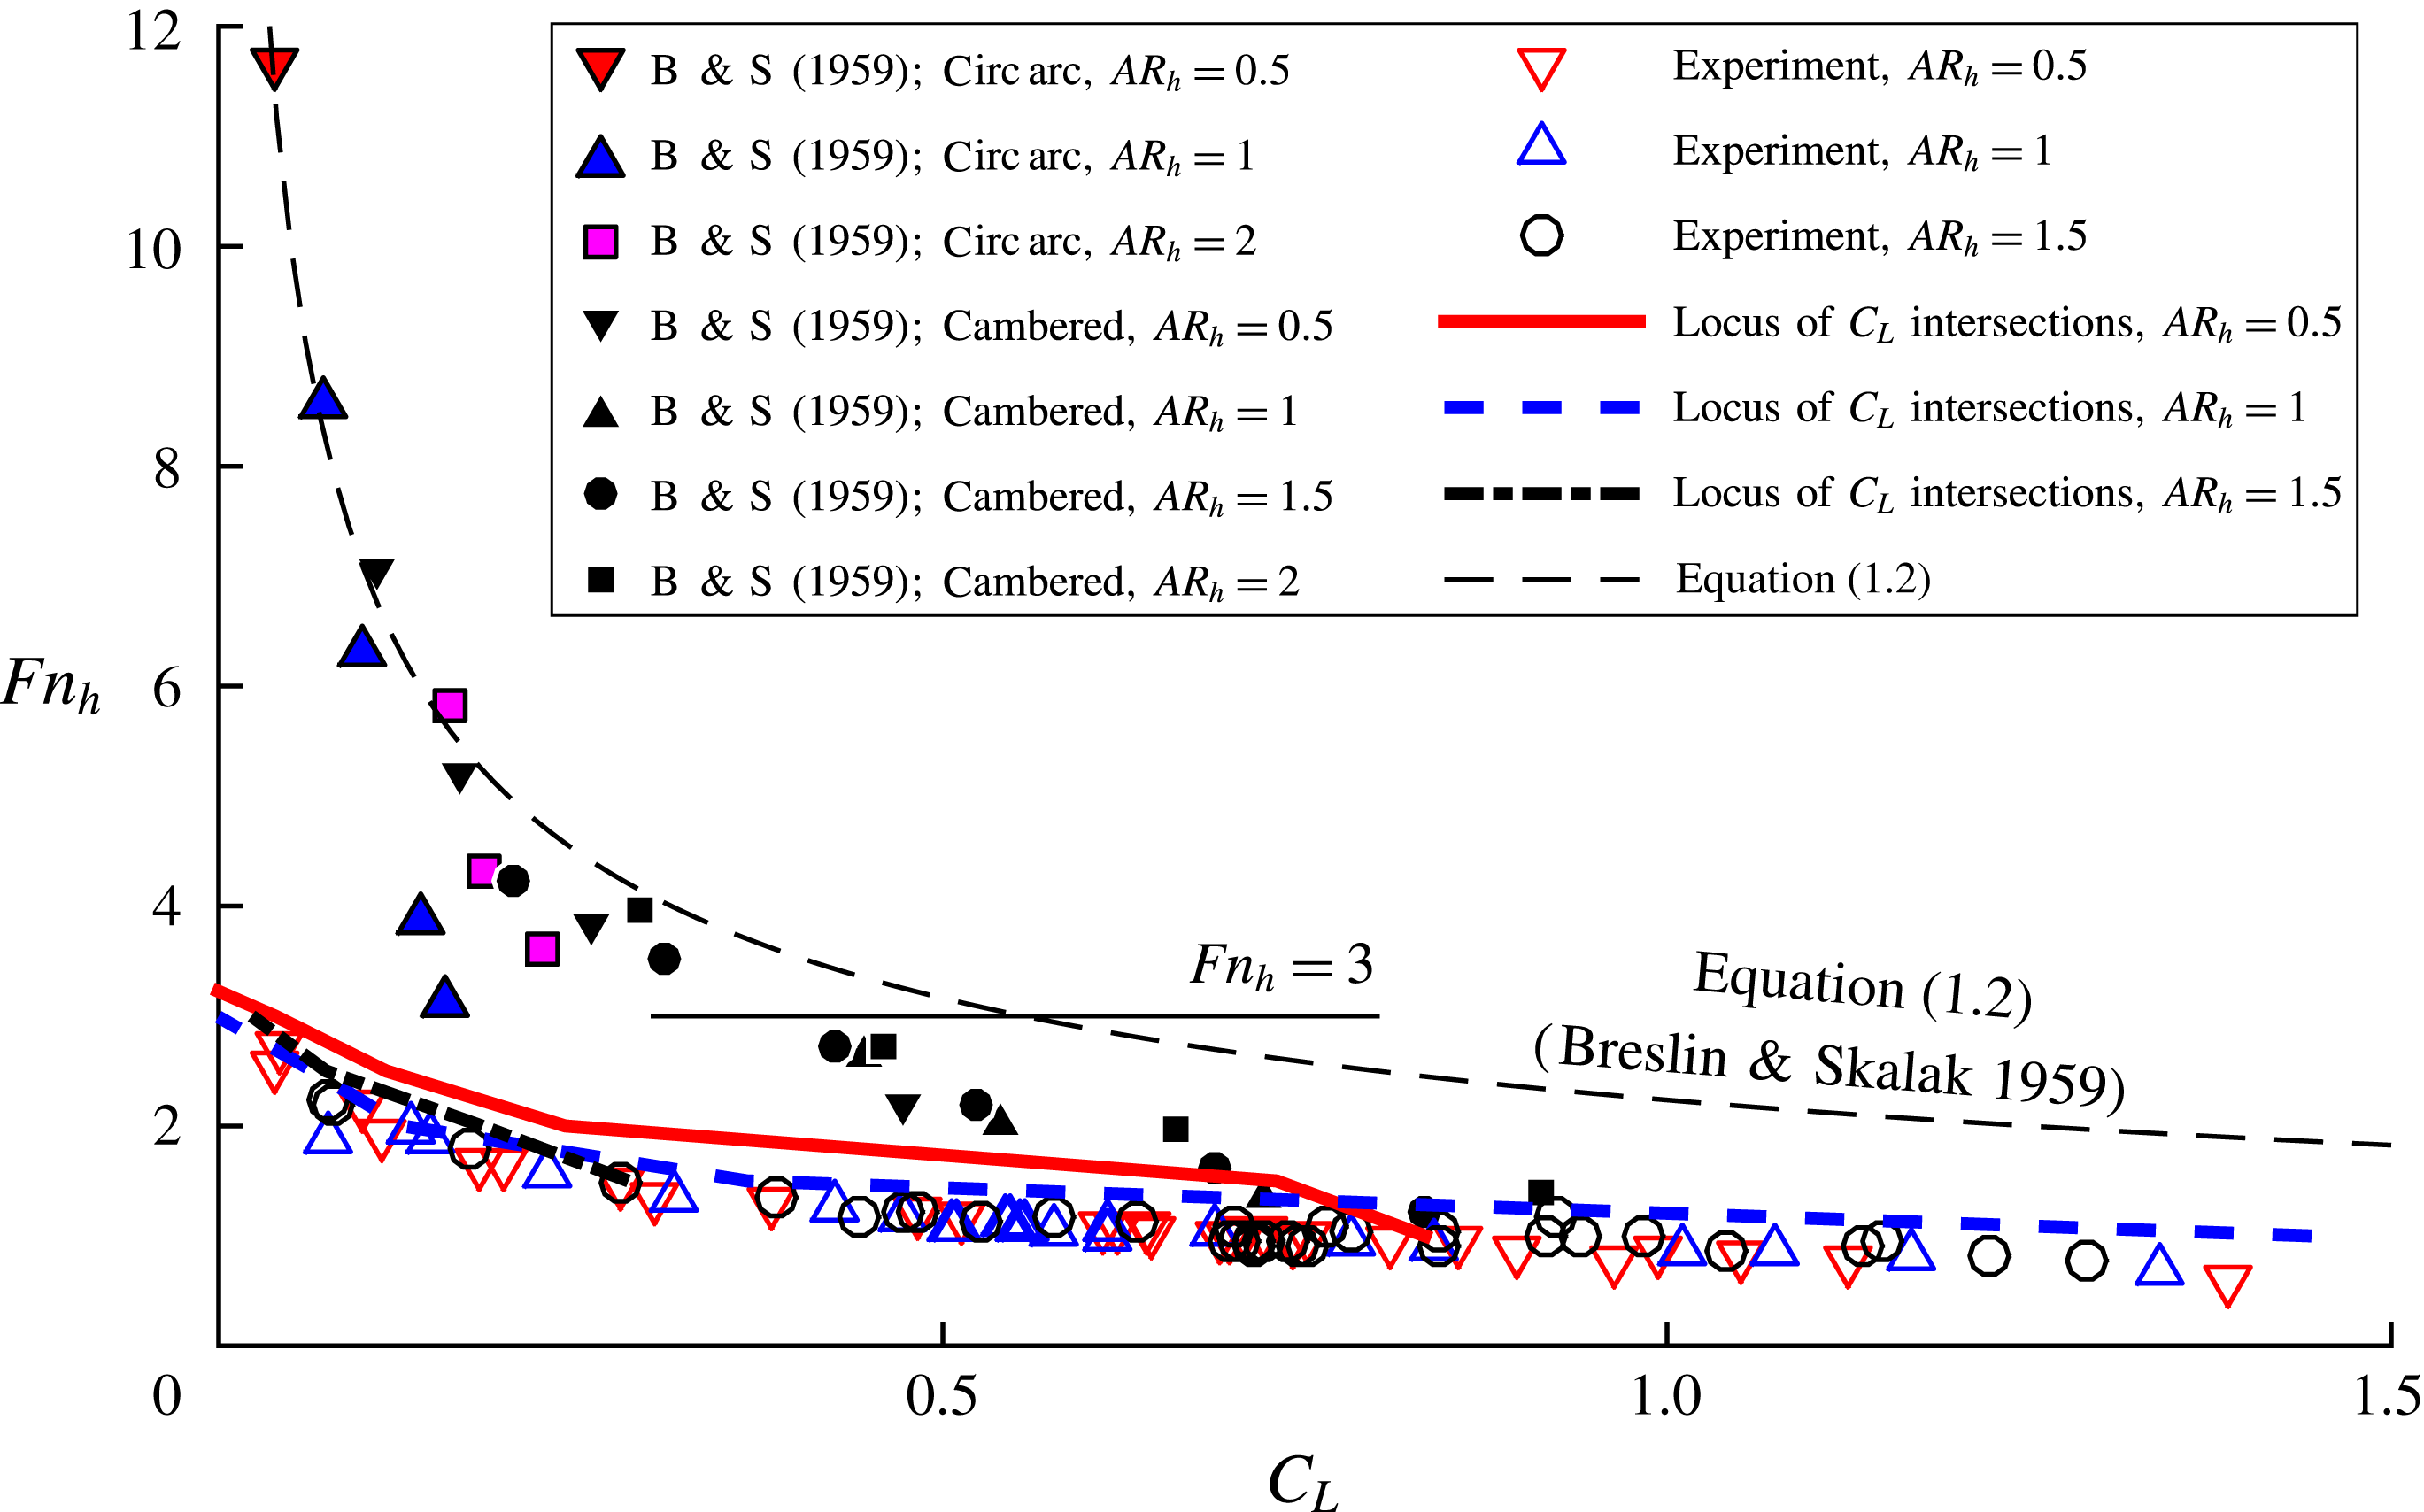
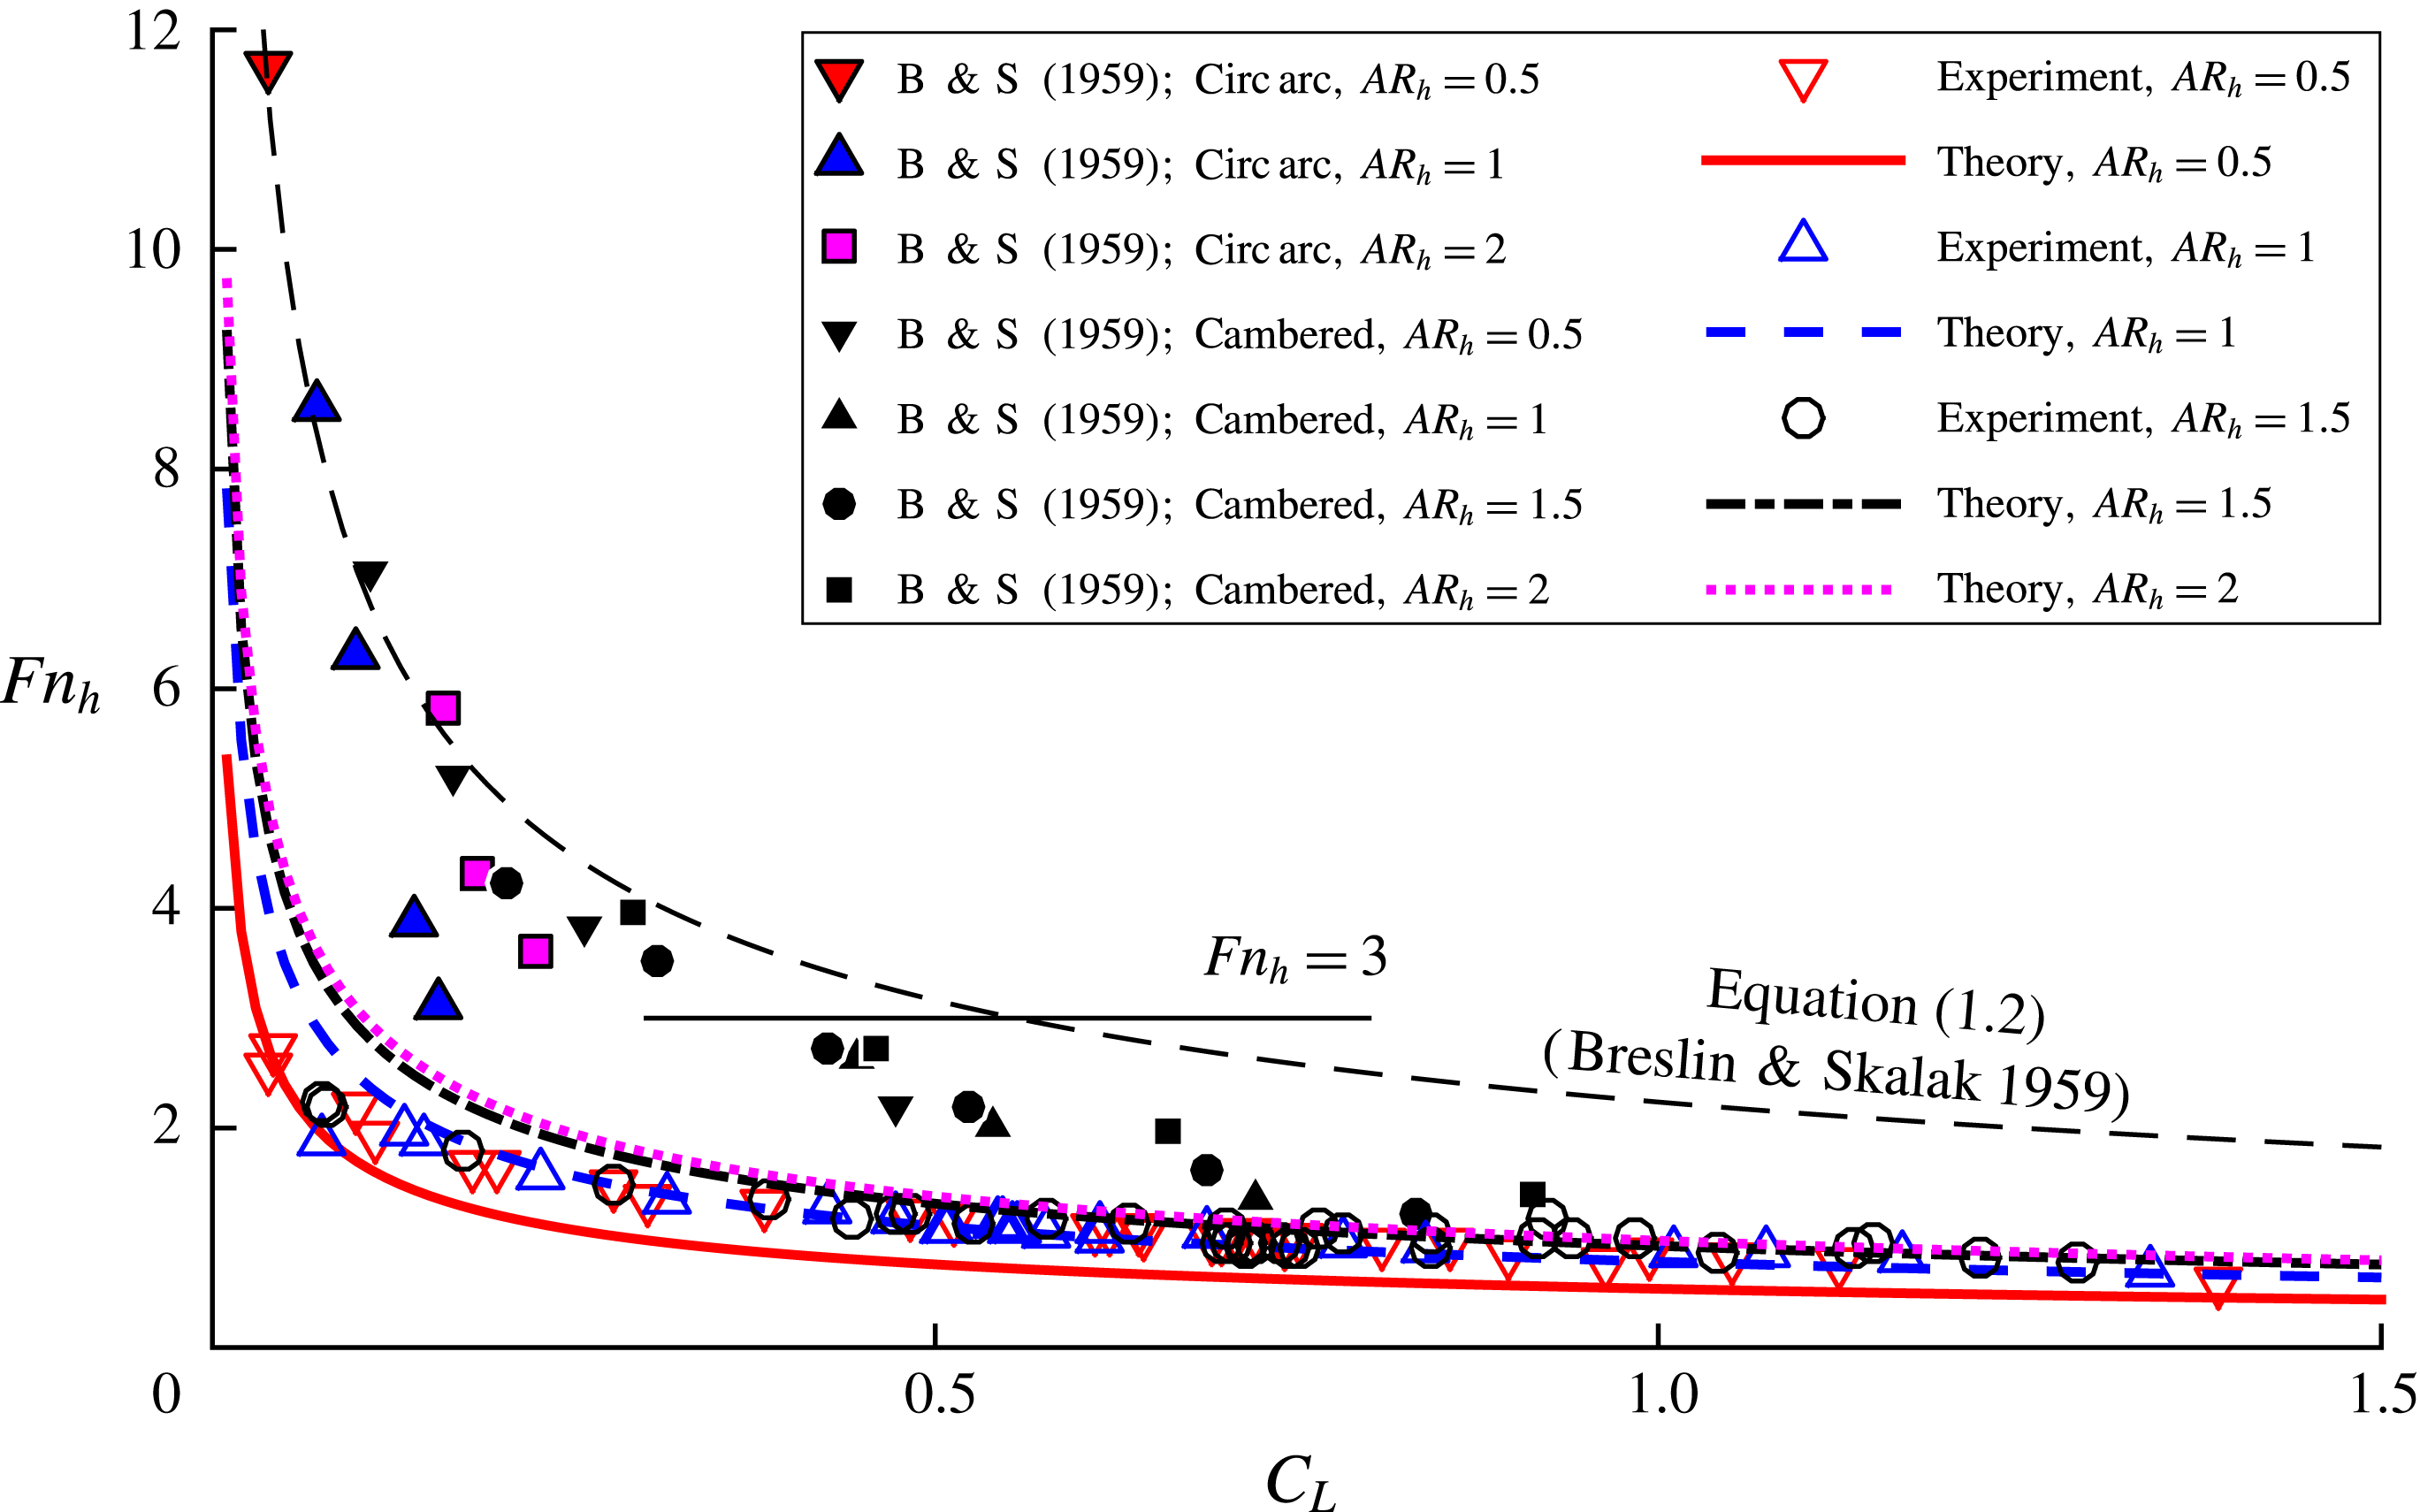
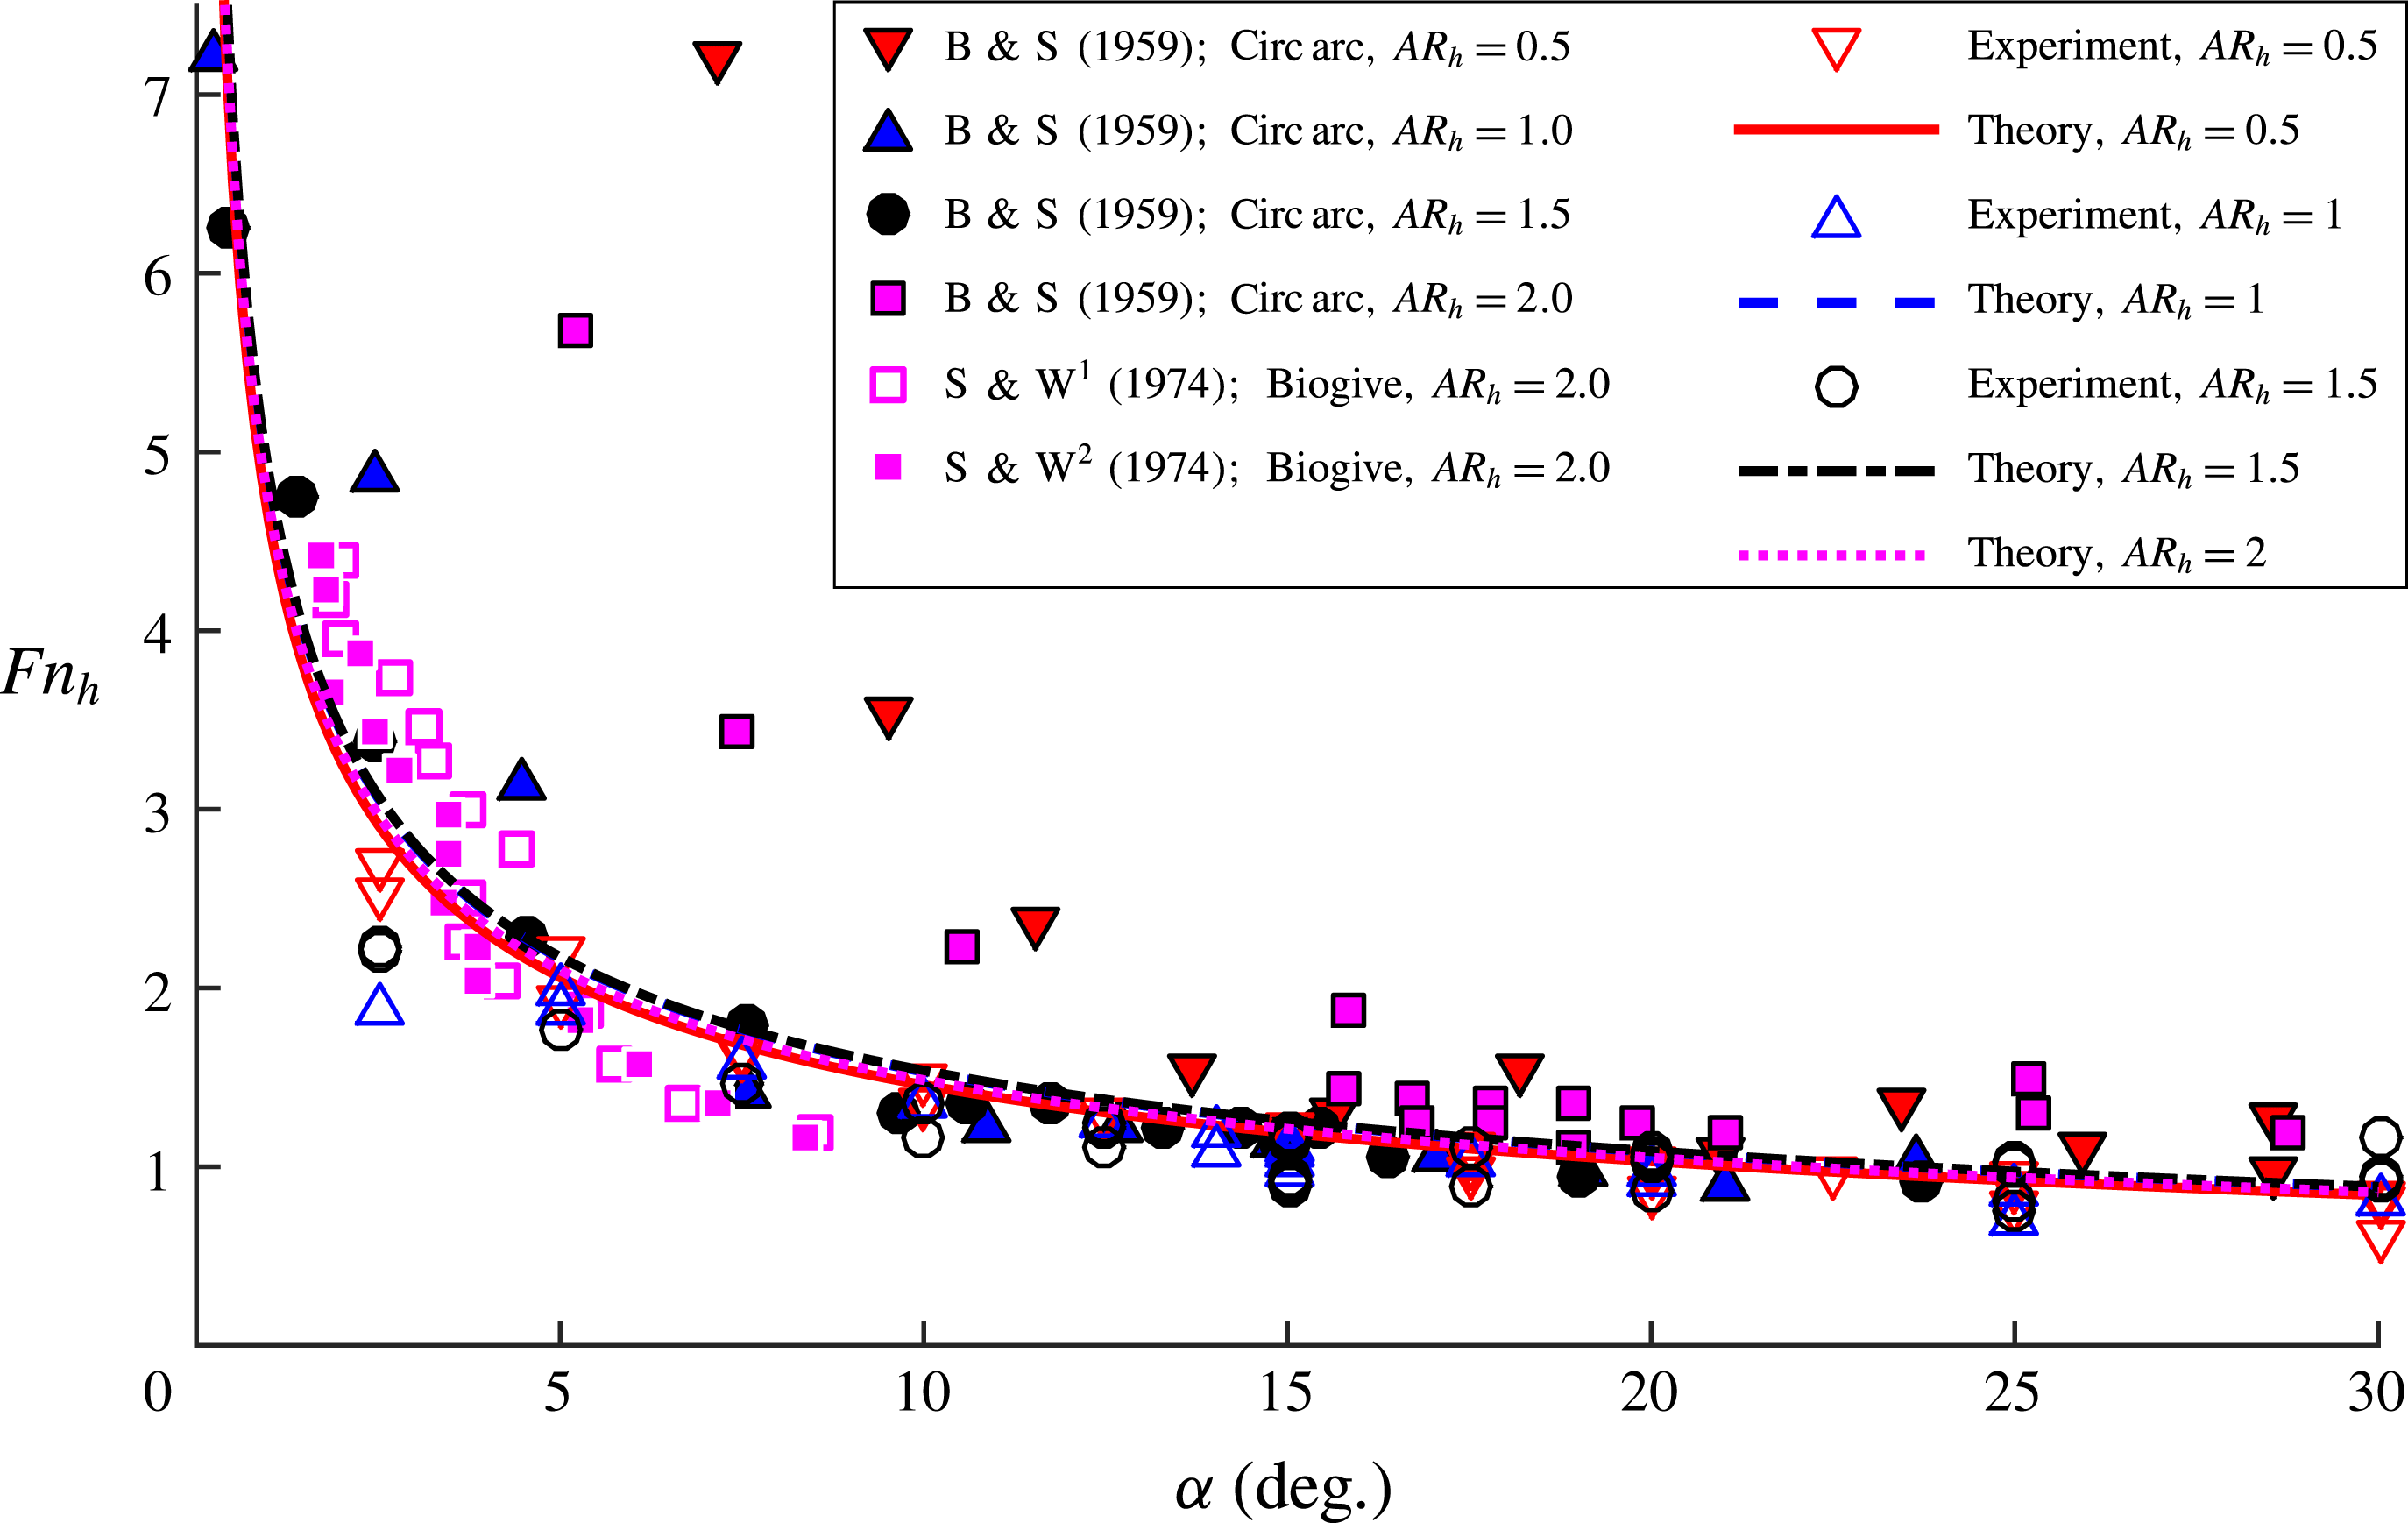
) by breaching the free surface upstream of the leading edge of the hydrofoil with a disturbing body (such as the point of a pencil). Unlike Wadlin (Reference Wadlin1958), who observed ventilated cavities triggered in this manner to disappear after the disturbance was removed, Breslin & Skalak (Reference Breslin and Skalak1959) found that such cavities remained stable, even as the yaw angle was decreased towards zero degrees, corroborating the observations of Kiceniuk (Reference Kiceniuk1954) and Wetzel (Reference Wetzel1957). Breslin & Skalak (Reference Breslin and Skalak1959) also used oil-film visualization to demonstrate that boundary layer separation did not extend to the free surface for yaw angles below stall. Breslin & Skalak (Reference Breslin and Skalak1959) studied the conditions at cavity elimination with varying hydrofoil sections and immersed aspect ratios by decreasing the speed of a fully ventilated hydrofoil and recording
${\it\alpha}\leqslant 14^{\circ }$
) by breaching the free surface upstream of the leading edge of the hydrofoil with a disturbing body (such as the point of a pencil). Unlike Wadlin (Reference Wadlin1958), who observed ventilated cavities triggered in this manner to disappear after the disturbance was removed, Breslin & Skalak (Reference Breslin and Skalak1959) found that such cavities remained stable, even as the yaw angle was decreased towards zero degrees, corroborating the observations of Kiceniuk (Reference Kiceniuk1954) and Wetzel (Reference Wetzel1957). Breslin & Skalak (Reference Breslin and Skalak1959) also used oil-film visualization to demonstrate that boundary layer separation did not extend to the free surface for yaw angles below stall. Breslin & Skalak (Reference Breslin and Skalak1959) studied the conditions at cavity elimination with varying hydrofoil sections and immersed aspect ratios by decreasing the speed of a fully ventilated hydrofoil and recording
![]() $C_{L_{w}}$
and
$C_{L_{w}}$
and
![]() $Fn_{h}$
immediately following the elimination of the fully ventilated cavity, where
$Fn_{h}$
immediately following the elimination of the fully ventilated cavity, where
![]() $C_{L_{w}}$
denotes the 3D lift coefficient of the fully wetted hydrofoil at the conditions under which ventilation ceased to occur (discussed further in § 4.2.1). When
$C_{L_{w}}$
denotes the 3D lift coefficient of the fully wetted hydrofoil at the conditions under which ventilation ceased to occur (discussed further in § 4.2.1). When
![]() $C_{L_{w}}$
was plotted against
$C_{L_{w}}$
was plotted against
![]() $Fn_{h}^{-2}$
, a number of boundaries were revealed for the different foil shapes and configurations. At the limit of small
$Fn_{h}^{-2}$
, a number of boundaries were revealed for the different foil shapes and configurations. At the limit of small
![]() $Fn_{h}^{-2}$
(large
$Fn_{h}^{-2}$
(large
![]() $Fn_{h}$
) and small
$Fn_{h}$
) and small
![]() $C_{L_{w}}$
, the boundaries faired into a line, suggesting that fully ventilated flows were stable only if
$C_{L_{w}}$
, the boundaries faired into a line, suggesting that fully ventilated flows were stable only if
It should be noted that, at smaller
![]() $Fn_{h}$
or larger
$Fn_{h}$
or larger
![]() $C_{L_{w}}$
, the boundaries found by Breslin & Skalak (Reference Breslin and Skalak1959) deviated from the asymptotic fit and from one another, so (1.2) overpredicted the required lift coefficient at a given
$C_{L_{w}}$
, the boundaries found by Breslin & Skalak (Reference Breslin and Skalak1959) deviated from the asymptotic fit and from one another, so (1.2) overpredicted the required lift coefficient at a given
![]() $Fn_{h}$
and overpredicted the
$Fn_{h}$
and overpredicted the
![]() $Fn_{h}$
for a given lift coefficient at which stable ventilation occurred.
$Fn_{h}$
for a given lift coefficient at which stable ventilation occurred.
Rothblum et al. (Reference Rothblum, Mayer and Wilburn1969) performed a series of experiments at high speeds and Reynolds numbers (
![]() $5\times 10^{5}\leqslant \mathit{Re}_{c}\leqslant 1.7\times 10^{7}$
) on a family of symmetric biogive-section hydrofoils with chord lengths of 0.3–0.61 m, varying leading edge radii and zero trailing edge thickness at varying yaw angles. Here, the Reynolds number is based on the chord length, or
$5\times 10^{5}\leqslant \mathit{Re}_{c}\leqslant 1.7\times 10^{7}$
) on a family of symmetric biogive-section hydrofoils with chord lengths of 0.3–0.61 m, varying leading edge radii and zero trailing edge thickness at varying yaw angles. Here, the Reynolds number is based on the chord length, or
![]() $\mathit{Re}_{c}=uc/{\it\nu}$
, where
$\mathit{Re}_{c}=uc/{\it\nu}$
, where
![]() ${\it\nu}$
is the fluid kinematic viscosity. He identified wetted and ventilated flow regimes, and noted the propensity of ventilated flow to remain stable at yaw angles much smaller than the conditions at formation. At speeds high enough to induce vaporous cavitation, ventilation occurred when the layer of liquid separating the vaporous cavity from the free surface was ruptured. The formation of a ventilated cavity occurred very suddenly, reducing or even reversing the action of lift. Rothblum et al. (Reference Rothblum, Mayer and Wilburn1969) suggested that at moderate angles of attack, flow over the suction surface of the hydrofoil induced a downward acceleration of the free surface, creating Taylor instabilities on the free surface (Taylor Reference Taylor1950; Emmons, Chang & Watson Reference Emmons, Chang and Watson1960). Air then entered ventilation-prone zones on the suction surface through low-pressure vortical paths created by the collapse of the Taylor instabilities. The family of biogival struts with a chord length of
${\it\nu}$
is the fluid kinematic viscosity. He identified wetted and ventilated flow regimes, and noted the propensity of ventilated flow to remain stable at yaw angles much smaller than the conditions at formation. At speeds high enough to induce vaporous cavitation, ventilation occurred when the layer of liquid separating the vaporous cavity from the free surface was ruptured. The formation of a ventilated cavity occurred very suddenly, reducing or even reversing the action of lift. Rothblum et al. (Reference Rothblum, Mayer and Wilburn1969) suggested that at moderate angles of attack, flow over the suction surface of the hydrofoil induced a downward acceleration of the free surface, creating Taylor instabilities on the free surface (Taylor Reference Taylor1950; Emmons, Chang & Watson Reference Emmons, Chang and Watson1960). Air then entered ventilation-prone zones on the suction surface through low-pressure vortical paths created by the collapse of the Taylor instabilities. The family of biogival struts with a chord length of
![]() $c=0.3$
m was also tested by Waid (Reference Waid1968) in a depressurized towing tank to study the interactions of ventilated and vaporous cavities. Cavitation numbers as low as
$c=0.3$
m was also tested by Waid (Reference Waid1968) in a depressurized towing tank to study the interactions of ventilated and vaporous cavities. Cavitation numbers as low as
![]() ${\it\sigma}_{v}=0.162$
were tested. Here,
${\it\sigma}_{v}=0.162$
were tested. Here,
![]() ${\it\sigma}_{v}=(P_{atm}-P_{v})/({\it\rho}u^{2}/2)$
is the vaporous cavitation number, where
${\it\sigma}_{v}=(P_{atm}-P_{v})/({\it\rho}u^{2}/2)$
is the vaporous cavitation number, where
![]() $P_{atm}$
is the ambient pressure at the free surface and
$P_{atm}$
is the ambient pressure at the free surface and
![]() $P_{v}$
is the saturated vapour pressure of freshwater. The results suggested that the value of
$P_{v}$
is the saturated vapour pressure of freshwater. The results suggested that the value of
![]() ${\it\sigma}_{v}$
was a primary factor governing ventilation formation when vaporous cavities were present. Taylor instabilities in the thin layer of water between a vaporous cavity and the free surface were a primary mechanism of air ingress into the low-pressure vaporous cavity.
${\it\sigma}_{v}$
was a primary factor governing ventilation formation when vaporous cavities were present. Taylor instabilities in the thin layer of water between a vaporous cavity and the free surface were a primary mechanism of air ingress into the low-pressure vaporous cavity.
Swales et al. (Reference Swales, Wright, McGregor and Cole1973) used pressure taps and oil-film visualization on the suction surface of a yawed vertical hydrofoil with a 0.1 m chord biogival section to show that sub-atmospheric pressures and flow separation preceded ventilation formation in all cases, consistent with previous studies. The oil film indicated a long leading edge separation bubble on the suction surface, which, like those observed by Wadlin (Reference Wadlin1958) and Breslin & Skalak (Reference Breslin and Skalak1959), did not extend to the free surface at sub-stall yaw angles. This indicated that a thin layer of fluid near the free surface presented a barrier to the ingress of air. The researchers corroborated the claim of Wadlin (Reference Wadlin1958) that sub-atmospheric pressures and boundary layer separation are necessary pre-conditions of ventilation. However, they found no explicit relationship between spontaneous ventilation formation and the satisfaction of these pre-conditions, i.e. they were unable to show that the pre-conditions were sufficient to guarantee ventilation formation.
Swales et al. (Reference Swales, Wright, McGregor and Rothblum1974) studied the same biogival model families as Rothblum et al. (Reference Rothblum, Mayer and Wilburn1969) and Swales et al. (Reference Swales, Wright, McGregor and Cole1973). In addition, struts with NACA-0012 and NACA-16-021 sections and 10 cm chords were used. They found that the Taylor instabilities described by Rothblum et al. (Reference Rothblum, Mayer and Wilburn1969) induced ventilation formation for streamlined sections (termed ‘tail inception’), while sharp-nosed sections ventilated through a long leading edge bubble and the associated leading edge vortex (termed ‘nose inception’). It should be noted again that the term ‘inception’ describes processes that are, in this work, classified as ventilation ‘formation’, while ‘inception’ will be defined more formally in § 4.1. Leading edge separation with subsequent reattachment of the flow is a feature of sharp-nosed sections known as ‘thin-airfoil stall’ (Gault Reference Gault1957), which occurs when adverse pressure gradients induce laminar separation upstream of the turbulent transition point. Chang (Reference Chang1960, Reference Chang1961) states that the laminar separation point is independent of the free-stream Reynolds number on such section shapes. Hecker & Ober (Reference Hecker and Ober1974) found that the length of separation bubbles on sharp-nosed hydrofoil sections grew as the angle of attack was increased, and depended only weakly on the Reynolds number in the range of
![]() $1\times 10^{5}\leqslant \mathit{Re}_{c}\leqslant 3\times 10^{5}$
. Air injected into a separation bubble by Hecker & Ober (Reference Hecker and Ober1974) was entrained in the separated flow and formed a partial ventilated cavity, while air injected outside of the bubble was convected downstream without inducing ventilation.
$1\times 10^{5}\leqslant \mathit{Re}_{c}\leqslant 3\times 10^{5}$
. Air injected into a separation bubble by Hecker & Ober (Reference Hecker and Ober1974) was entrained in the separated flow and formed a partial ventilated cavity, while air injected outside of the bubble was convected downstream without inducing ventilation.
Rothblum, McGregor & Swales (Reference Rothblum, McGregor and Swales1974) studied the effects of surface roughness, surface wettability and speed on the formation of ventilated cavities using a strut with a 10 cm chord and NACA-0012 section profile with different surface coatings and finishes. They determined that roughened surfaces and higher speeds acted to weaken the sealing effect of the unseparated flow at the free surface by promoting turbulence and generating vorticity near the free surface. Surface wettability and surface tension were judged to have negligible influence at the scale tested.
Interested readers may find additional background in the work of Acosta (Reference Acosta1973) and Rothblum (Reference Rothblum1977). One recurring conclusion from the studies is that ventilation must be preceded by both sub-atmospheric pressures and boundary layer separation. Another recurring observation is that there exists an unseparated layer of flow near the free surface at angles of attack below stall. The free surface relieves chordwise pressure gradients on the hydrofoil, precluding flow separation. As a result, a thin layer of high-energy flow forms a seal between the ventilation-prone regions and the source of air, delaying ventilation, even beyond the point at which the flow could begin to sustain a ventilated cavity. This conclusion was supported by the observations of Wadlin (Reference Wadlin1958), Breslin & Skalak (Reference Breslin and Skalak1959), Rothblum et al. (Reference Rothblum, Mayer and Wilburn1969) and Swales et al. (Reference Swales, Wright, McGregor and Rothblum1974) that in some trials, sub-atmospheric pressures and separated flow were evident (inferred from pressure surveys and oil films, or indicated by the presence of vaporous cavities), even while the flow remained fully wetted. Likewise, the lack of sufficiency of sub-atmospheric separated flow for predicting ventilation formation (Swales et al. Reference Swales, Wright, McGregor and Cole1973) was thought to be a result of the free-surface seal created by the unseparated layer of flow.
Depth-based Froude numbers in the range of
![]() $1\leqslant Fn_{h}\leqslant 25$
were reported for studies of streamlined struts/hydrofoils, but discussions of cavity topologies and stability were focused primarily on relatively large Froude numbers (
$1\leqslant Fn_{h}\leqslant 25$
were reported for studies of streamlined struts/hydrofoils, but discussions of cavity topologies and stability were focused primarily on relatively large Froude numbers (
![]() $Fn_{h}\geqslant 4$
), by testing at high speeds or by using very small models. In this range of
$Fn_{h}\geqslant 4$
), by testing at high speeds or by using very small models. In this range of
![]() $Fn_{h}$
, the flows tend to be unambiguously wetted or ventilated. The transitional flows that precede fully developed ventilation, especially at lower speeds, have been largely neglected. The range of low-to-moderate Froude numbers (
$Fn_{h}$
, the flows tend to be unambiguously wetted or ventilated. The transitional flows that precede fully developed ventilation, especially at lower speeds, have been largely neglected. The range of low-to-moderate Froude numbers (
![]() $0.5\lesssim Fn_{h}\lesssim 4$
) is an important one, however. As shown by the results of Wetzel (Reference Wetzel1957) and Breslin & Skalak (Reference Breslin and Skalak1959), ventilation formation and elimination may occur at low Froude numbers, incurring sudden changes in loading and flow topology. Additionally, while a limited number of studies have investigated ventilation formation, the process of ventilation elimination has not been examined closely, with the exception of a brief treatment by Breslin & Skalak (Reference Breslin and Skalak1959). From a design standpoint, any system designed to operate at high Froude numbers must necessarily transit the low-to-moderate Froude number range. From a scientific standpoint, it is desirable to better understand ventilation in this range of Froude numbers, where hydrostatic and dynamic pressures are of the same order of magnitude. Therefore, a more thorough investigation of flow stability and ventilation transition processes is of both practical and academic interest.
$0.5\lesssim Fn_{h}\lesssim 4$
) is an important one, however. As shown by the results of Wetzel (Reference Wetzel1957) and Breslin & Skalak (Reference Breslin and Skalak1959), ventilation formation and elimination may occur at low Froude numbers, incurring sudden changes in loading and flow topology. Additionally, while a limited number of studies have investigated ventilation formation, the process of ventilation elimination has not been examined closely, with the exception of a brief treatment by Breslin & Skalak (Reference Breslin and Skalak1959). From a design standpoint, any system designed to operate at high Froude numbers must necessarily transit the low-to-moderate Froude number range. From a scientific standpoint, it is desirable to better understand ventilation in this range of Froude numbers, where hydrostatic and dynamic pressures are of the same order of magnitude. Therefore, a more thorough investigation of flow stability and ventilation transition processes is of both practical and academic interest.
1.2 Example cavity flow and lifting-line model
In this section, an example of a 3D ventilated cavity will be presented to illustrate the disparity between two-dimensional (2D) and three-dimensional (3D) flow descriptors. Additionally, a simple lifting-line method is used to model the effects of dominant physics acting on a surface-piercing strut in ventilated flow.
1.2.1 Two-dimensional cavity flows
Two-dimensional cavity flows are characterized by the ratio of the cavity length to the chord length (
![]() $L_{c}/c$
). Such cavities, whether vaporous or ventilated, are scaled with the section angle of attack (
$L_{c}/c$
). Such cavities, whether vaporous or ventilated, are scaled with the section angle of attack (
![]() ${\it\alpha}_{2D}$
) and the sectional cavitation number,
${\it\alpha}_{2D}$
) and the sectional cavitation number,
Here,
![]() ${\it\sigma}_{c}$
should not be confused with the vaporous cavitation number defined earlier,
${\it\sigma}_{c}$
should not be confused with the vaporous cavitation number defined earlier,
![]() ${\it\sigma}_{v}$
. The sectional cavitation number
${\it\sigma}_{v}$
. The sectional cavitation number
![]() ${\it\sigma}_{c}$
is a generalized form of the cavitation number (also known as the cavity under-pressure coefficient), where
${\it\sigma}_{c}$
is a generalized form of the cavitation number (also known as the cavity under-pressure coefficient), where
![]() $P_{\infty }$
and
$P_{\infty }$
and
![]() $P_{c}$
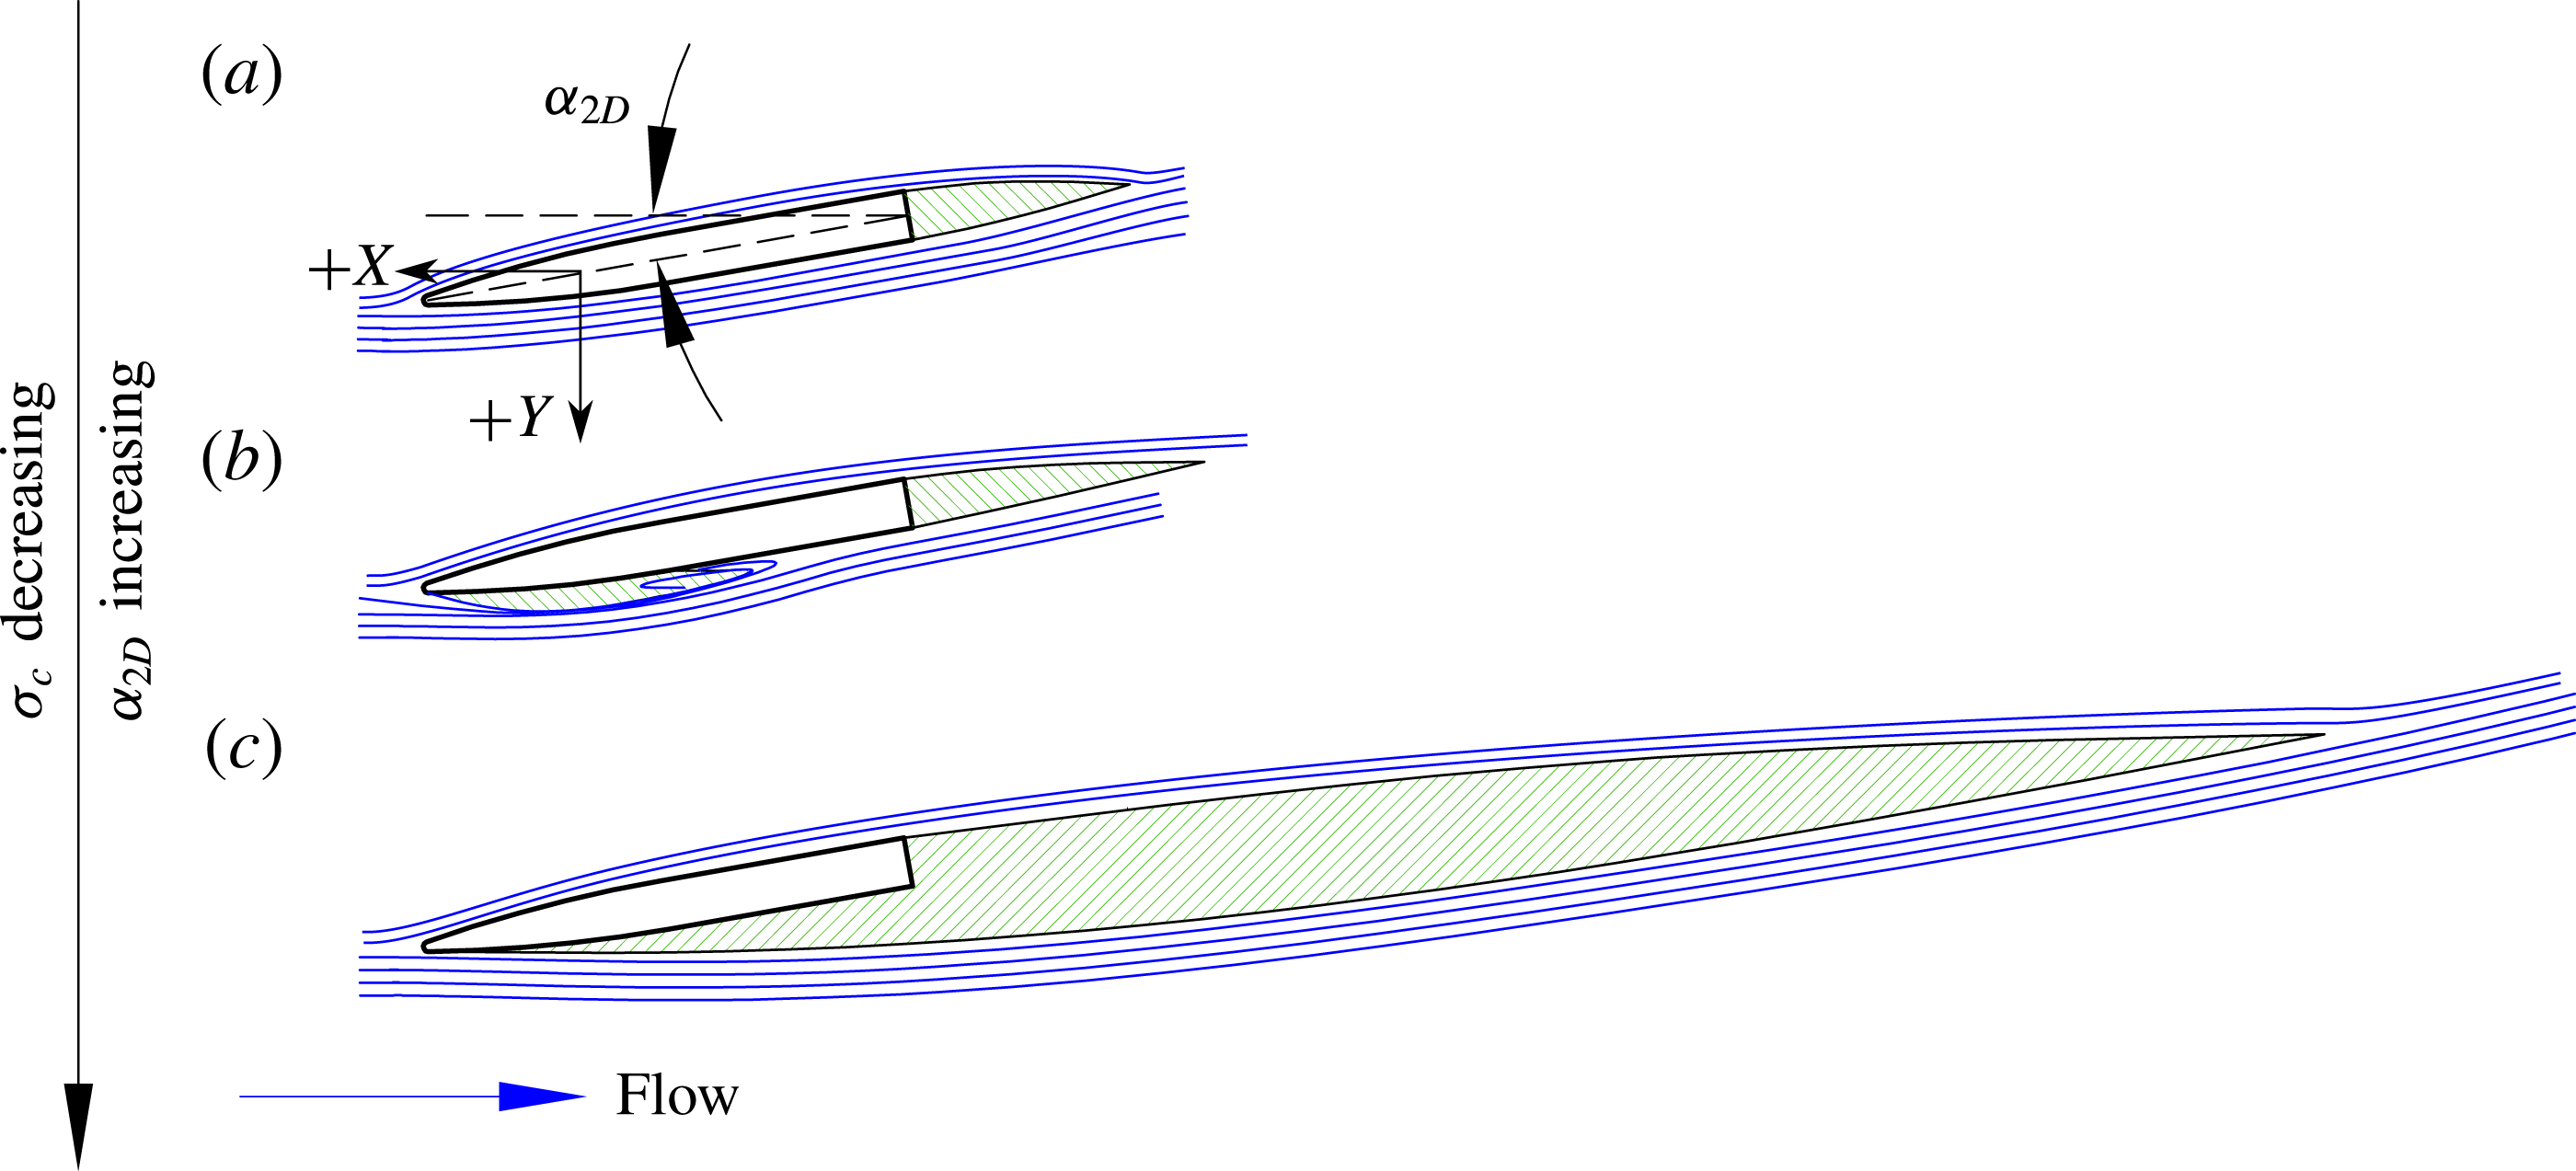
are respectively the absolute pressure of the incoming flow and the pressure inside the cavity, each at some depth below the free surface. Figure 1 illustrates fully wetted, partially cavitating and fully/supercavitating 2D cavity regimes and their dependence upon
$P_{c}$
are respectively the absolute pressure of the incoming flow and the pressure inside the cavity, each at some depth below the free surface. Figure 1 illustrates fully wetted, partially cavitating and fully/supercavitating 2D cavity regimes and their dependence upon
![]() ${\it\sigma}_{c}$
and
${\it\sigma}_{c}$
and
![]() ${\it\alpha}_{2D}$
.
${\it\alpha}_{2D}$
.
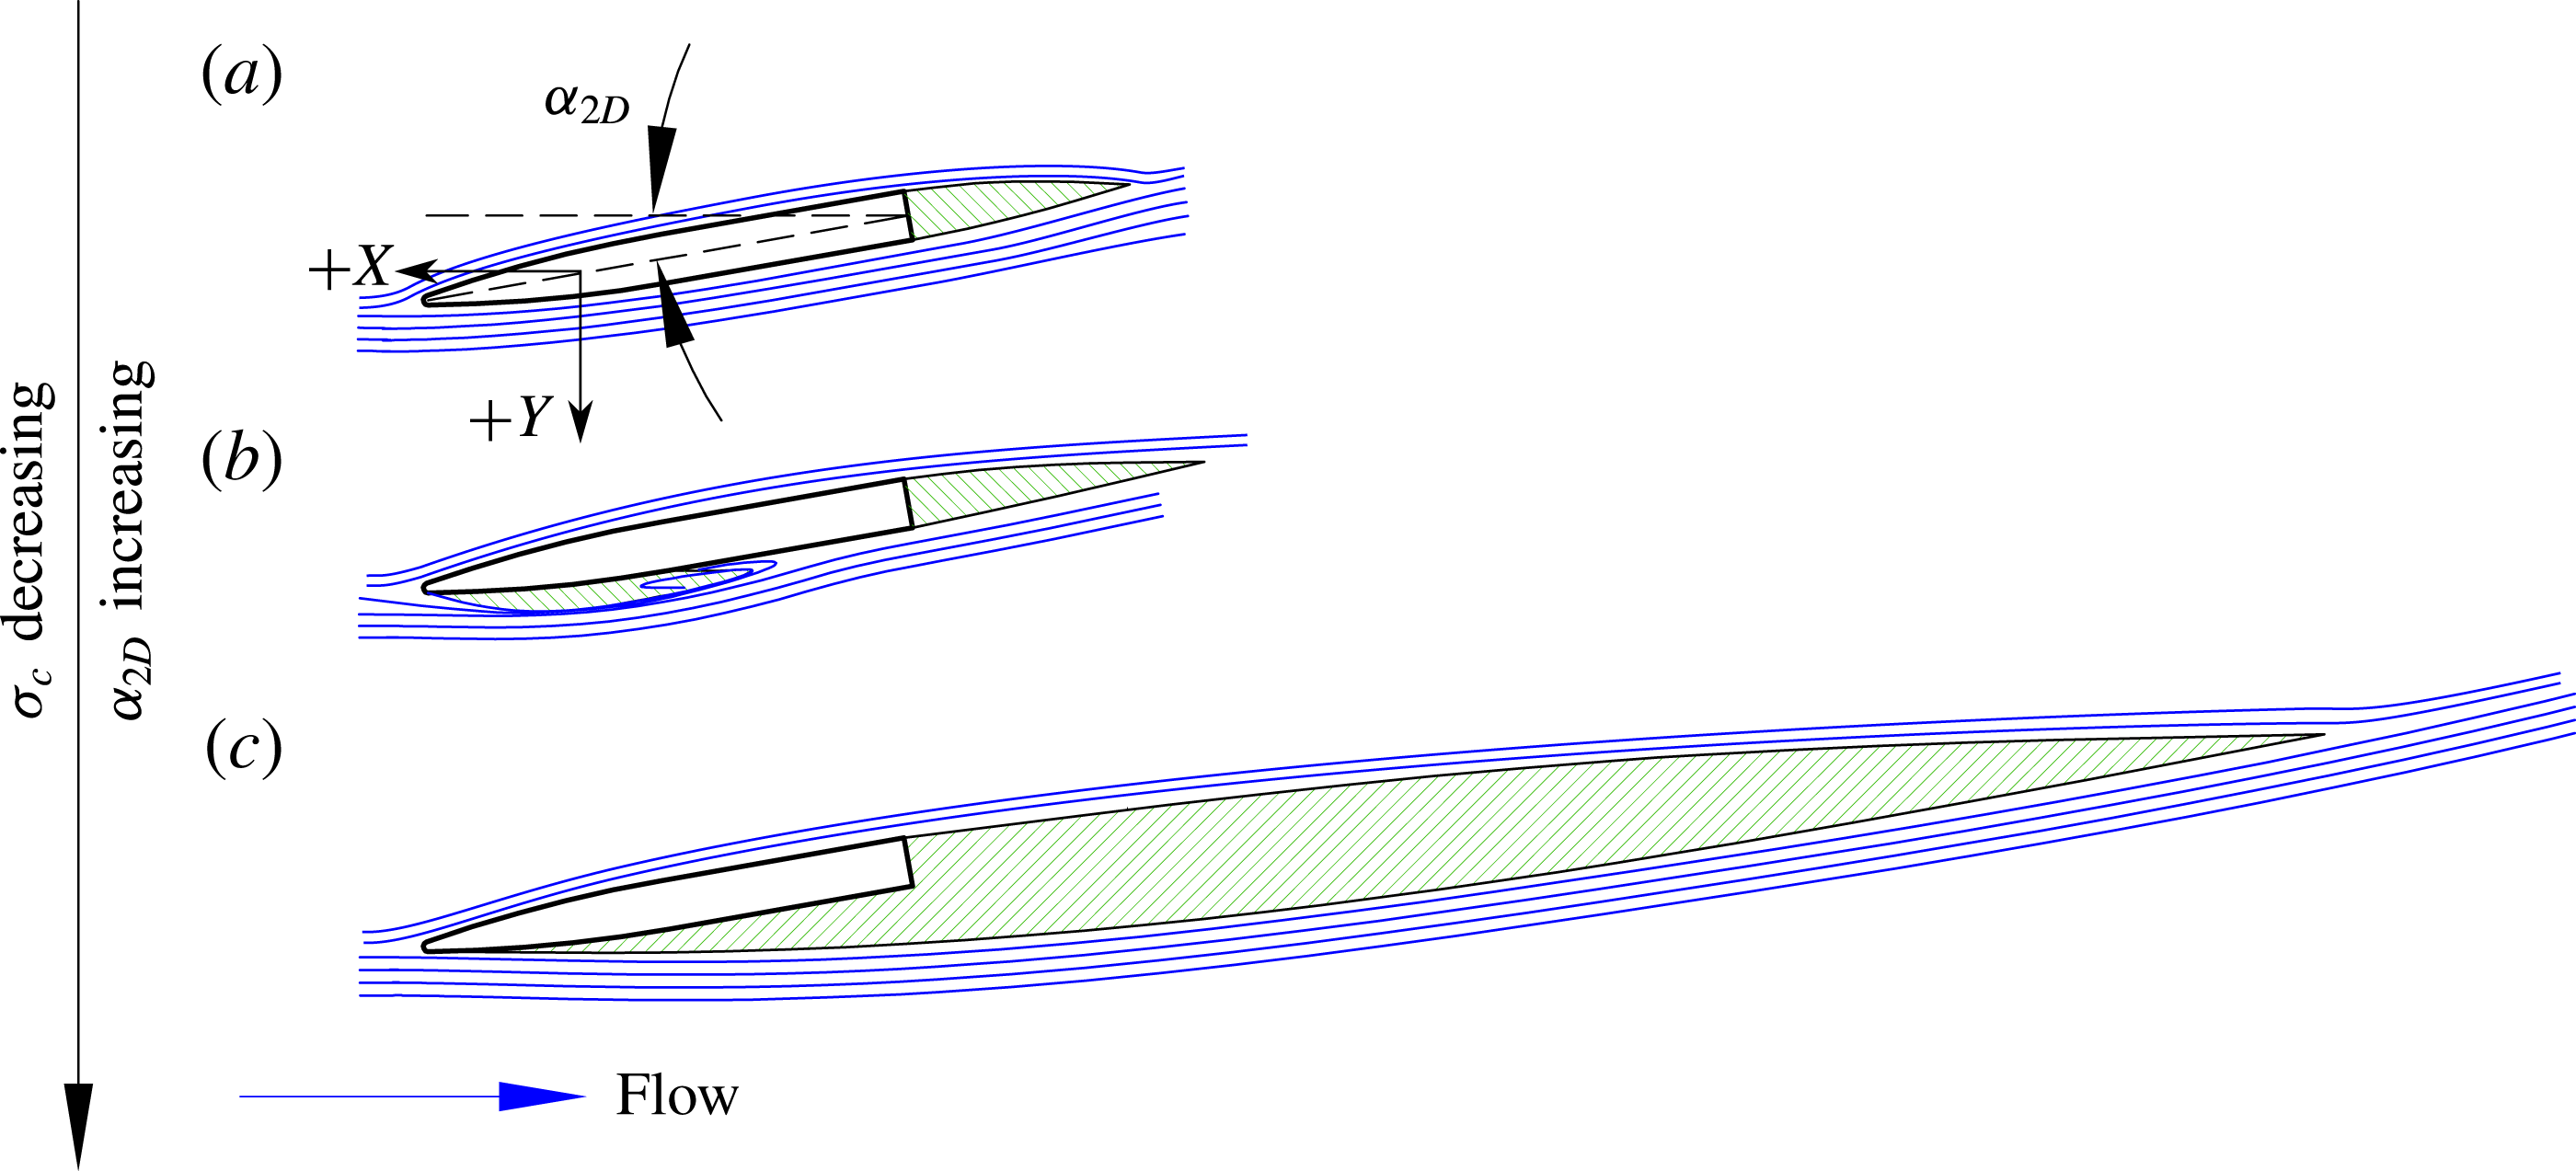
Figure 1. Two-dimensional cavity regimes on a hydrofoil section. The hydrofoil section is indicated by a black outline, cavities are indicated by green hatching and streamlines are indicated by blue lines. (a) Fully wetted flow lacks any attached cavity along the suction surface, but may exhibit a base cavity in the wake of a bluff body. (b) Partial cavitation is characterized by a cavity that does not reach the foil trailing edge. (c) Full/supercavitation is characterized by a cavity that extends to or beyond the foil trailing edge.
The lift coefficient of a 2D section is approximated in thin-airfoil theory as
where
![]() $a_{0}$
(commonly referred to as the lift slope) is the tangent slope of the lift coefficient curve at small angles (
$a_{0}$
(commonly referred to as the lift slope) is the tangent slope of the lift coefficient curve at small angles (
![]() $a_{0}\approx \partial C_{l_{2D}}/\partial {\it\alpha}_{2D}$
). Sectional lift is strongly influenced by cavitation. To model this effect, classical linear solutions for vaporous cavitating flow around a flat plate are used. For a supercavitating flat plate, Tulin (Reference Tulin1953) gave
$a_{0}\approx \partial C_{l_{2D}}/\partial {\it\alpha}_{2D}$
). Sectional lift is strongly influenced by cavitation. To model this effect, classical linear solutions for vaporous cavitating flow around a flat plate are used. For a supercavitating flat plate, Tulin (Reference Tulin1953) gave
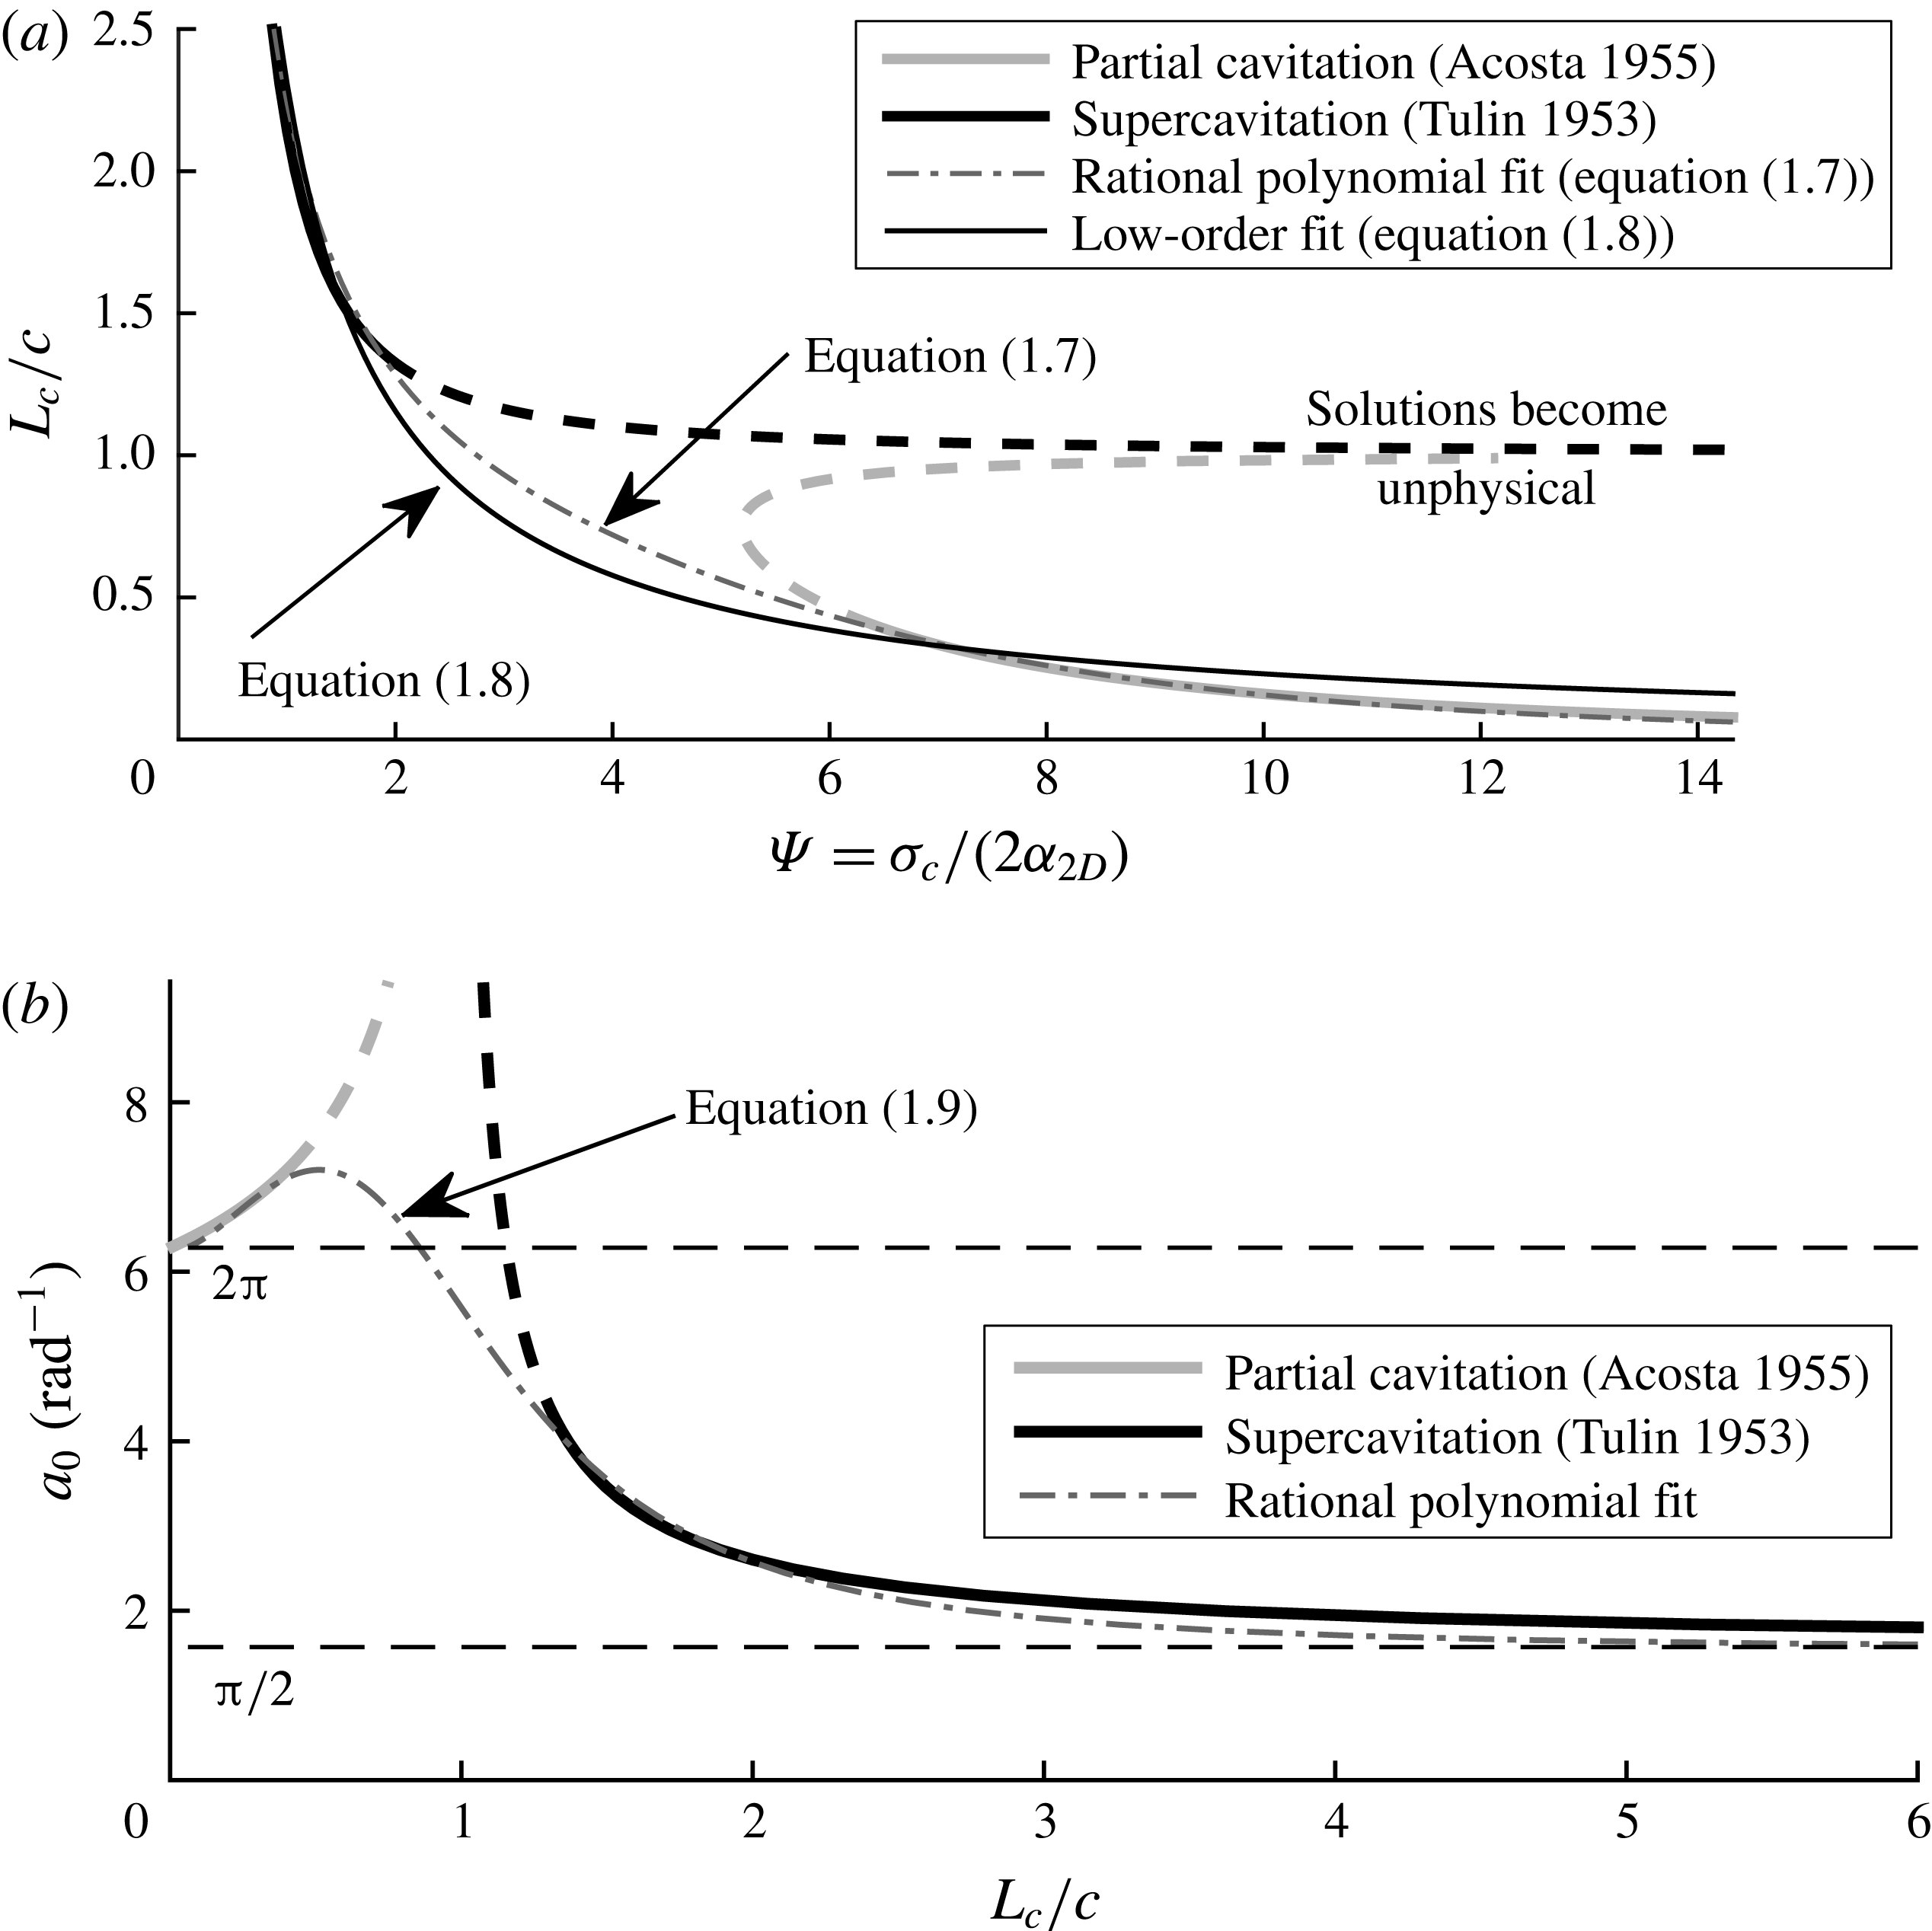
A lower-order fit, which approximates
![]() $L_{c}/c$
with a single term, is
$L_{c}/c$
with a single term, is
The slope of the lift coefficient curve is fitted by
 $$\begin{eqnarray}a_{0}=\frac{{\displaystyle \frac{{\rm\pi}}{2}}\left({\displaystyle \frac{L_{c}}{c}}\right)^{3}-2\left({\displaystyle \frac{L_{c}}{c}}\right)^{2}+4.5\left({\displaystyle \frac{L_{c}}{c}}\right)+1}{\left({\displaystyle \frac{L_{c}}{c}}\right)^{3}-\left({\displaystyle \frac{L_{c}}{c}}\right)^{2}+0.75\left({\displaystyle \frac{L_{c}}{c}}\right)+{\displaystyle \frac{1}{2{\rm\pi}}}},\end{eqnarray}$$
which approaches the respective analytical solutions in the limits (
![]() $a_{0}=2{\rm\pi}$
as
$a_{0}=2{\rm\pi}$
as
![]() $L_{c}/c\rightarrow 0$
and
$L_{c}/c\rightarrow 0$
and
![]() ${\rm\pi}/2$
as
${\rm\pi}/2$
as
![]() $L_{c}/c\rightarrow \infty$
). Equations (1.7)–(1.9) are also plotted in figure 2(a,b).
$L_{c}/c\rightarrow \infty$
). Equations (1.7)–(1.9) are also plotted in figure 2(a,b).
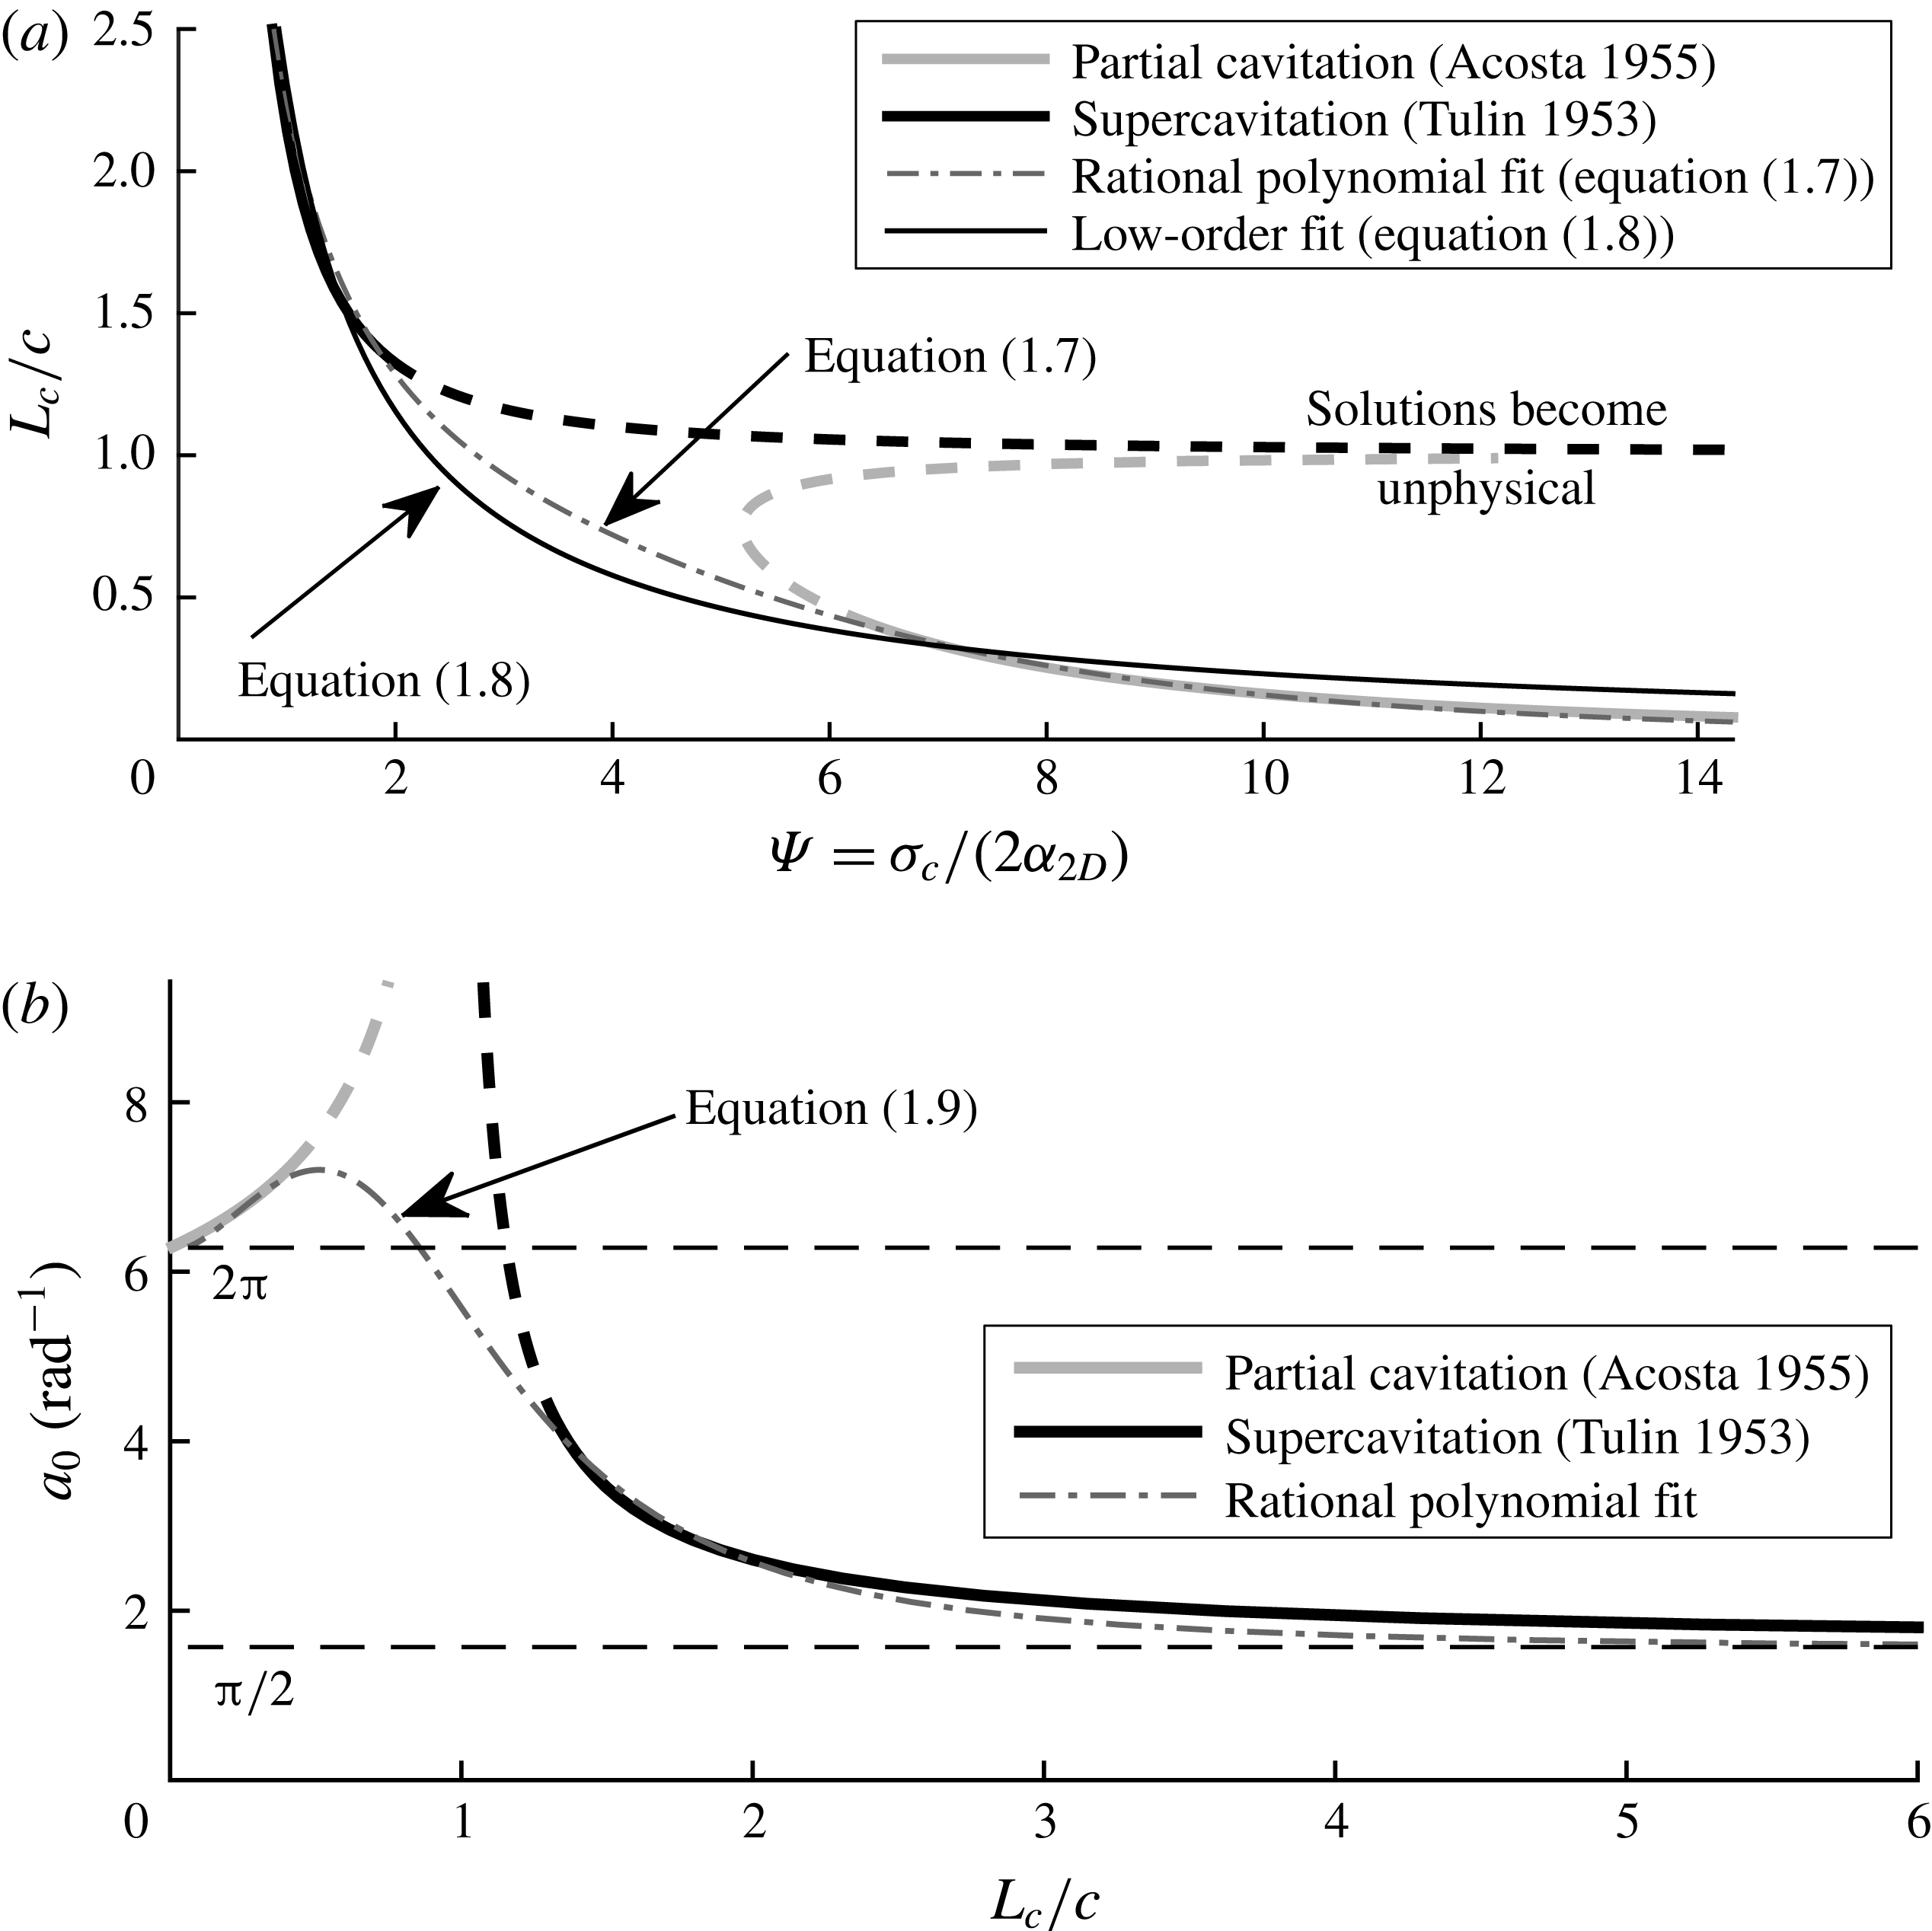
Figure 2. Modelling of sectional (a) cavity length and (b) lift-curve slope. (a) Dimensionless cavity length plotted against cavitation parameter
![]() ${\it\Psi}$
. The exact form of (1.5a
) is shown for
${\it\Psi}$
. The exact form of (1.5a
) is shown for
![]() ${\it\alpha}_{2D}=4^{\circ }$
. The dashed segments indicate portions of the linear solutions that approach non-physical singularities at
${\it\alpha}_{2D}=4^{\circ }$
. The dashed segments indicate portions of the linear solutions that approach non-physical singularities at
![]() $L_{c}/c=1$
, and which are not used for fitting. A rational polynomial and a single-term expression are shown to smoothly approximate the valid regions of both classical expressions. (b) Sectional lift coefficient slope (
$L_{c}/c=1$
, and which are not used for fitting. A rational polynomial and a single-term expression are shown to smoothly approximate the valid regions of both classical expressions. (b) Sectional lift coefficient slope (
![]() $a_{0}$
), plotted against dimensionless cavity length. A rational polynomial is fitted through the valid portions of the linear solutions to yield a smooth explicit equation that approaches the analytical values of
$a_{0}$
), plotted against dimensionless cavity length. A rational polynomial is fitted through the valid portions of the linear solutions to yield a smooth explicit equation that approaches the analytical values of
![]() $2{\rm\pi}$
and
$2{\rm\pi}$
and
![]() ${\rm\pi}/2$
in the limits of
${\rm\pi}/2$
in the limits of
![]() $L_{c}/c\rightarrow 0$
and
$L_{c}/c\rightarrow 0$
and
![]() $L_{c}/c\rightarrow \infty$
respectively.
$L_{c}/c\rightarrow \infty$
respectively.
1.2.2 Lifting-line model of three-dimensional cavity flows
To extend the concepts of 2D cavity flows to a 3D topology, a simple lifting-line model is used next to illustrate the effects of gravity and finite aspect ratio. Consider a hydrofoil that vertically pierces the free surface, as shown schematically in figure 3. A horizontal section cut may be taken through the hydrofoil at a depth of
![]() $z^{\prime }=-(S-h)-Z$
below the free surface, where
$z^{\prime }=-(S-h)-Z$
below the free surface, where
![]() $S$
is the total span of the hydrofoil and
$S$
is the total span of the hydrofoil and
![]() $Z$
is defined pointing upward from the hydrofoil root (away from the water surface). In the plane of this cut, the cavitation number can be recast as (Young & Brizzolara Reference Young, Brizzolara, Binns, Brown and Bose2013)
$Z$
is defined pointing upward from the hydrofoil root (away from the water surface). In the plane of this cut, the cavitation number can be recast as (Young & Brizzolara Reference Young, Brizzolara, Binns, Brown and Bose2013)
where
For the case of natural ventilation, the cavity is open to the atmosphere, so
![]() $P_{c}=P_{atm}$
and
$P_{c}=P_{atm}$
and
![]() ${\rm\Delta}{\it\sigma}=0$
, leading to the expression
${\rm\Delta}{\it\sigma}=0$
, leading to the expression
which increases linearly with depth for a given
![]() $Fn_{h}$
, as shown in figure 3 by the dashed line.
$Fn_{h}$
, as shown in figure 3 by the dashed line.

Figure 3. Nonlinear lifting-line model of a surface-piercing hydrofoil at
![]() ${\it\alpha}=10^{\circ }$
,
${\it\alpha}=10^{\circ }$
,
![]() $Fn_{h}=1.5$
,
$Fn_{h}=1.5$
,
![]() $AR_{h}=1.0$
. The suction surface of the hydrofoil is shown. The effective angle of attack and cavitation number both vary along the span, leading to a spanwise non-uniform cavity. The agreement between computed and true cavity profiles (observed in the present experimental study) suggests that the simplistic model is suitable for capturing qualitative features of 3D ventilated cavity flows.
$AR_{h}=1.0$
. The suction surface of the hydrofoil is shown. The effective angle of attack and cavitation number both vary along the span, leading to a spanwise non-uniform cavity. The agreement between computed and true cavity profiles (observed in the present experimental study) suggests that the simplistic model is suitable for capturing qualitative features of 3D ventilated cavity flows.
The presence of the free surface and the finite aspect ratio lead to non-uniform distribution of sectional effective angles of attack along the spanwise (
![]() $Z$
) axis, i.e.
$Z$
) axis, i.e.
![]() ${\it\alpha}_{2D}(Z)\neq {\it\alpha}$
. The discrete lifting-line code shown by Harwood & Young (Reference Harwood and Young2014) is modified to model surface-piercing lifting bodies in ventilated flows. An abbreviated description of the modified lifting-line model follows; more details on the original form of the method may be found in Harwood & Young (Reference Harwood and Young2014).
${\it\alpha}_{2D}(Z)\neq {\it\alpha}$
. The discrete lifting-line code shown by Harwood & Young (Reference Harwood and Young2014) is modified to model surface-piercing lifting bodies in ventilated flows. An abbreviated description of the modified lifting-line model follows; more details on the original form of the method may be found in Harwood & Young (Reference Harwood and Young2014).
The lifting-line formulation collapses a 3D wing onto a 1D spanwise distribution of section properties. Glauert (Reference Glauert1943) presented the following governing equations, which relate the induced downwash velocity
![]() $v(Z)$
and bound circulation
$v(Z)$
and bound circulation
![]() ${\it\Gamma}(Z)$
:
${\it\Gamma}(Z)$
:
where
![]() ${\it\alpha}$
is the local section geometric angle of attack and
${\it\alpha}$
is the local section geometric angle of attack and
![]() $C_{l_{0}}$
is the 2D lift coefficient at
$C_{l_{0}}$
is the 2D lift coefficient at
![]() ${\it\alpha}=0^{\circ }$
. The two equations may be combined into the fundamental integral equation for the circulation distribution, which must be satisfied at all points on the lifting line:
${\it\alpha}=0^{\circ }$
. The two equations may be combined into the fundamental integral equation for the circulation distribution, which must be satisfied at all points on the lifting line:
In this work, the governing equation is recast as a root-finding problem and the small-angle assumption is removed, giving
Equation (1.16) states that the effective angle of attack of a section (
![]() ${\it\alpha}_{2D}$
) is a sum of the geometric angle of attack (
${\it\alpha}_{2D}$
) is a sum of the geometric angle of attack (
![]() ${\it\alpha}$
) and the dimensionless downwash induced at that section (
${\it\alpha}$
) and the dimensionless downwash induced at that section (
![]() $v/u$
). Downwash is the name given to flow normal to the surface of the hydrofoil (along the positive
$v/u$
). Downwash is the name given to flow normal to the surface of the hydrofoil (along the positive
![]() $Y$
axis as defined in figure 1), induced by vorticity shed from neighbouring sections. The span of the hydrofoil is discretized into panels, at the centre of each of which (1.16) is imposed. The derivative term present in (1.15) is approximated with finite differences (second-order central and backwards differencing), and the integral term is approximated by trapezoidal quadrature. The lift coefficient and bound circulation of a 2D section are related by
$Y$
axis as defined in figure 1), induced by vorticity shed from neighbouring sections. The span of the hydrofoil is discretized into panels, at the centre of each of which (1.16) is imposed. The derivative term present in (1.15) is approximated with finite differences (second-order central and backwards differencing), and the integral term is approximated by trapezoidal quadrature. The lift coefficient and bound circulation of a 2D section are related by
Equation (1.13), rewritten in the compact discrete form, gives
For a hydrofoil discretized at
![]() $N$
stations,
$N$
stations,
![]() ${\it\bf\Omega}$
is an
${\it\bf\Omega}$
is an
![]() $N\times N$
matrix operator containing the differencing and quadrature weights,
$N\times N$
matrix operator containing the differencing and quadrature weights,
![]() $\unicode[STIX]{x1D658}^{D}$
and
$\unicode[STIX]{x1D658}^{D}$
and
![]() $\unicode[STIX]{x1D650}^{D}$
are diagonal
$\unicode[STIX]{x1D650}^{D}$
are diagonal
![]() $N\times N$
matrices with entries respectively corresponding to the chord and inflow velocities of each of the
$N\times N$
matrices with entries respectively corresponding to the chord and inflow velocities of each of the
![]() $N$
sections, and
$N$
sections, and
![]() $\boldsymbol{C}_{l_{2D}}$
and
$\boldsymbol{C}_{l_{2D}}$
and
![]() $\boldsymbol{v}$
are each an
$\boldsymbol{v}$
are each an
![]() $N\times 1$
column vector containing the sectional lift coefficients and induced downwash velocities of the sections respectively.
$N\times 1$
column vector containing the sectional lift coefficients and induced downwash velocities of the sections respectively.
By substituting (1.18) into (1.16), the following system is derived:
Equation (1.19) is solved by iterating on
![]() ${\bf\alpha}_{2D}$
using a numerical root-finding algorithm.
${\bf\alpha}_{2D}$
using a numerical root-finding algorithm.
In (1.18) and (1.19), the vector
![]() $\boldsymbol{C}_{l_{2D}}$
must be computed as some function of the known section parameters. Following the 2D cavitating-flow models in § 1.2.1,
$\boldsymbol{C}_{l_{2D}}$
must be computed as some function of the known section parameters. Following the 2D cavitating-flow models in § 1.2.1,
![]() $\boldsymbol{C}_{l_{2D}}$
is made a function of the respective sectional
$\boldsymbol{C}_{l_{2D}}$
is made a function of the respective sectional
![]() ${\it\alpha}_{2D}$
and
${\it\alpha}_{2D}$
and
![]() ${\it\sigma}_{c}$
. For a given distribution of
${\it\sigma}_{c}$
. For a given distribution of
![]() ${\it\alpha}_{2D}$
and with
${\it\alpha}_{2D}$
and with
![]() ${\it\sigma}_{c}$
known at each spanwise section (via (1.12)), the distribution of
${\it\sigma}_{c}$
known at each spanwise section (via (1.12)), the distribution of
![]() $L_{c}/c$
is estimated by applying (1.7) to the calculated distributions of
$L_{c}/c$
is estimated by applying (1.7) to the calculated distributions of
![]() ${\it\alpha}_{2D}$
and
${\it\alpha}_{2D}$
and
![]() ${\it\sigma}_{c}$
. Equation (1.9) is then used to calculate the unscaled 2D lift coefficient distribution,
${\it\sigma}_{c}$
. Equation (1.9) is then used to calculate the unscaled 2D lift coefficient distribution,
![]() $C_{l_{2D}}^{\ast }$
. The lifting line does not fully capture 3D effects for very small aspect ratios because it neglects effect such as cross-flow. Small immersed aspect ratios are being considered in the present work, so a correction factor is used to rescale the sectional distribution as a means of approximating the additional 3D effects. Helmbold (Reference Helmbold1942) derived the expression for the total lift of rectangular wings of small aspect ratio (
$C_{l_{2D}}^{\ast }$
. The lifting line does not fully capture 3D effects for very small aspect ratios because it neglects effect such as cross-flow. Small immersed aspect ratios are being considered in the present work, so a correction factor is used to rescale the sectional distribution as a means of approximating the additional 3D effects. Helmbold (Reference Helmbold1942) derived the expression for the total lift of rectangular wings of small aspect ratio (
![]() $AR<4$
) as
$AR<4$
) as
 $$\begin{eqnarray}C_{L}^{H}=\left[\frac{a_{0}}{{\displaystyle \frac{a_{0}}{{\rm\pi}AR}}+\sqrt{1+\left({\displaystyle \frac{a_{0}}{{\rm\pi}AR}}\right)^{2}}}\right]{\it\alpha}.\end{eqnarray}$$
Equation (1.20) is used to rescale the computed
![]() $\boldsymbol{C}_{l_{2D}}^{\ast }$
for small aspect ratios, inside of the iterative solution of (1.19). At each iteration, the unscaled 3D lift coefficient (
$\boldsymbol{C}_{l_{2D}}^{\ast }$
for small aspect ratios, inside of the iterative solution of (1.19). At each iteration, the unscaled 3D lift coefficient (
![]() $C_{L}^{\ast }$
) is computed by integrating
$C_{L}^{\ast }$
) is computed by integrating
![]() $C_{l_{2D}}$
along the span,
$C_{l_{2D}}$
along the span,
The lift slope,
![]() $a_{0}$
, also varies along the span. To find a single representative value for use in (1.20), a lift-weighted mean value (
$a_{0}$
, also varies along the span. To find a single representative value for use in (1.20), a lift-weighted mean value (
![]() $a_{0}^{\ast }$
) is estimated from the lifting-line results,
$a_{0}^{\ast }$
) is estimated from the lifting-line results,
Numerical quadrature is used to evaluate (1.21) and (1.22). The lift-weighted mean value
![]() $a_{0}^{\ast }$
is substituted into (1.20) to yield the scaled 3D lift coefficient
$a_{0}^{\ast }$
is substituted into (1.20) to yield the scaled 3D lift coefficient
![]() $C_{L}^{H}$
. The Helmbold correction factor
$C_{L}^{H}$
. The Helmbold correction factor
![]() $H$
is computed as the ratio
$H$
is computed as the ratio
Finally, the 2D lift distribution is rescaled,
The vector
![]() $\boldsymbol{C}_{l_{2D}}$
is then substituted into (1.19). By executing this procedure at each iteration, equation (1.19) may be iteratively solved for
$\boldsymbol{C}_{l_{2D}}$
is then substituted into (1.19). By executing this procedure at each iteration, equation (1.19) may be iteratively solved for
![]() ${\bf\alpha}_{2D}$
.
${\bf\alpha}_{2D}$
.
A zero-load boundary condition is imposed at the foil tip and a negative image of the vorticity distribution is imposed above the free surface, forcing the effective angle of attack,
![]() ${\it\alpha}_{2D}(z^{\prime })$
, to be zero at
${\it\alpha}_{2D}(z^{\prime })$
, to be zero at
![]() $z^{\prime }=0$
and
$z^{\prime }=0$
and
![]() $z^{\prime }=h$
. The negative image method can be formulated by imposing the linearized dynamic/kinematic free-surface boundary condition for large chord-based Froude numbers. Boundary conditions are built into the matrix operator
$z^{\prime }=h$
. The negative image method can be formulated by imposing the linearized dynamic/kinematic free-surface boundary condition for large chord-based Froude numbers. Boundary conditions are built into the matrix operator
![]() ${\it\bf\Omega}$
. More details on image techniques are given by Faltinsen (Reference Faltinsen2005), and the inclusion of images in the coefficient matrix is described by Harwood & Young (Reference Harwood and Young2014).
${\it\bf\Omega}$
. More details on image techniques are given by Faltinsen (Reference Faltinsen2005), and the inclusion of images in the coefficient matrix is described by Harwood & Young (Reference Harwood and Young2014).
The non-dimensional distributions of
![]() ${\it\alpha}_{2D}/{\it\alpha}$
,
${\it\alpha}_{2D}/{\it\alpha}$
,
![]() $L_{c}/c$
,
$L_{c}/c$
,
![]() $a_{0}/(2{\rm\pi})$
,
$a_{0}/(2{\rm\pi})$
,
![]() ${\it\sigma}_{c}$
and
${\it\sigma}_{c}$
and
![]() $C_{l_{2D}}$
are shown in figure 3 for a case of
$C_{l_{2D}}$
are shown in figure 3 for a case of
![]() ${\it\alpha}=10^{\circ }$
,
${\it\alpha}=10^{\circ }$
,
![]() $Fn_{h}=1.5$
and
$Fn_{h}=1.5$
and
![]() $AR_{h}=1.0$
. The planform of the ventilated cavity observed in experiments (described in § 2) at the same flow conditions is shown for comparison. The lifting-line method is not proposed as a high-fidelity model, but the close agreement between the computed and observed cavity profiles suggests that the inclusion of gravitational, free-surface and 3D effects adequately captures the dominant features of a 3D ventilated cavity flow around a surface-piercing hydrofoil. One should note the characteristic hump in the sectional angle of attack where the sections are supercavitating, which occurs because
$AR_{h}=1.0$
. The planform of the ventilated cavity observed in experiments (described in § 2) at the same flow conditions is shown for comparison. The lifting-line method is not proposed as a high-fidelity model, but the close agreement between the computed and observed cavity profiles suggests that the inclusion of gravitational, free-surface and 3D effects adequately captures the dominant features of a 3D ventilated cavity flow around a surface-piercing hydrofoil. One should note the characteristic hump in the sectional angle of attack where the sections are supercavitating, which occurs because
![]() $a_{0}$
reduces sharply when
$a_{0}$
reduces sharply when
![]() $L_{c}/c>1$
, while
$L_{c}/c>1$
, while
![]() $C_{l_{2D}}$
remains smooth and without major inflections. The shape of the
$C_{l_{2D}}$
remains smooth and without major inflections. The shape of the
![]() $a_{0}$
distribution reflects that in figure 2(b), with a local maximum where sections are partially cavitating.
$a_{0}$
distribution reflects that in figure 2(b), with a local maximum where sections are partially cavitating.
The cavity is clearly non-uniform along the span as a result of gravitational effects and the finite aspect ratio. Unlike the well-established topologies of 2D cavity flows, 3D cavity flows cannot be easily defined. Sections taken, for example, at
![]() $z^{\prime }=0.1h$
,
$z^{\prime }=0.1h$
,
![]() $z^{\prime }=0.5h$
and
$z^{\prime }=0.5h$
and
![]() $z^{\prime }=h$
in figure 3 would be respectively classified as supercavitating, partially cavitating and fully wetted under the classifications of figure 1. At transitional Froude numbers (
$z^{\prime }=h$
in figure 3 would be respectively classified as supercavitating, partially cavitating and fully wetted under the classifications of figure 1. At transitional Froude numbers (
![]() $0.5\leqslant Fn_{h}\leqslant 2$
), the spanwise pressure gradient is of the same order as the chordwise pressure gradient, resulting in the strongly 3D topology. Such flows have been described in the literature either using ad hoc terminology or by considering only a representative 2D section of a 3D geometry. As a result, the distinction between partial ventilation and full ventilation becomes ambiguous for 3D geometries at low-to-moderate Froude numbers, requiring a more quantitative set of criteria for delineating flow regimes in a laboratory environment.
$0.5\leqslant Fn_{h}\leqslant 2$
), the spanwise pressure gradient is of the same order as the chordwise pressure gradient, resulting in the strongly 3D topology. Such flows have been described in the literature either using ad hoc terminology or by considering only a representative 2D section of a 3D geometry. As a result, the distinction between partial ventilation and full ventilation becomes ambiguous for 3D geometries at low-to-moderate Froude numbers, requiring a more quantitative set of criteria for delineating flow regimes in a laboratory environment.
1.2.3 Summary
The example presented in § 1.2 demonstrates that combined 3D effects, free-surface effects and gravity can yield cavity profiles at moderate Froude numbers that are not suitably described by the 2D terminology found in the literature. An adequate characterization of 3D cavity flows is still needed, particularly at low-to-moderate Froude numbers. Moreover, there is a need to identify the mechanisms that cause transition between steady flow regimes and when these ventilation transition processes occur. Previous studies have focused on the steady regimes of ventilated flows and the resulting steady lift and drag forces. Those studies that have dealt with unsteady ventilation transition mechanisms have focused almost exclusively on formation mechanisms, leaving the processes of ventilation elimination unexplored.
2 Experimental set-up
To address the issues described above, a study was performed on a canonical surface-piercing hydrofoil. The work is focused on a region of low-to-moderate Froude numbers and Reynolds numbers, where both gravitational and viscous forces are significant, and in which large changes in hydrodynamic loading and flow topology occur. Experiments were carried out in the towing tank at the University of Michigan Marine Hydrodynamics Laboratory, which has dimensions of 110 m (360 ft) long
![]() $\times$
6.7 m (22 ft) wide
$\times$
6.7 m (22 ft) wide
![]() $\times$
3.05 m (10 ft) deep. The model was towed by a gantry-type carriage, capable of speeds of up to
$\times$
3.05 m (10 ft) deep. The model was towed by a gantry-type carriage, capable of speeds of up to
![]() $6.1~\text{m}~\text{s}^{-1}$
(
$6.1~\text{m}~\text{s}^{-1}$
(
![]() $20~\text{ft}~\text{s}^{-1}$
).
$20~\text{ft}~\text{s}^{-1}$
).
2.1 Experimental model and fixture
The model used in the experiments possesses a uniform semi-ogival section along the span, with a 27.94 cm chord and a maximum thickness of 2.79 cm, a circular-arc (ogival) forebody with a radius of curvature of 84.84 cm, and a rectangular afterbody. The section has a leading edge radius of
![]() $0.01c$
and a blunt trailing edge, as shown in figure 4. The hydrofoil has a rectangular planform with a 91 cm span, and was machined as a single piece from 6061 aluminium. The geometry resembles that used in past studies, particularly the models of Waid (Reference Waid1968), Rothblum et al. (Reference Rothblum, Mayer and Wilburn1969) and Swales et al. (Reference Swales, Wright, McGregor and Cole1973, Reference Swales, Wright, McGregor and Rothblum1974).
$0.01c$
and a blunt trailing edge, as shown in figure 4. The hydrofoil has a rectangular planform with a 91 cm span, and was machined as a single piece from 6061 aluminium. The geometry resembles that used in past studies, particularly the models of Waid (Reference Waid1968), Rothblum et al. (Reference Rothblum, Mayer and Wilburn1969) and Swales et al. (Reference Swales, Wright, McGregor and Cole1973, Reference Swales, Wright, McGregor and Rothblum1974).

Figure 4. Cross-section of the hydrofoil. The model was machined from 6061 aluminium.
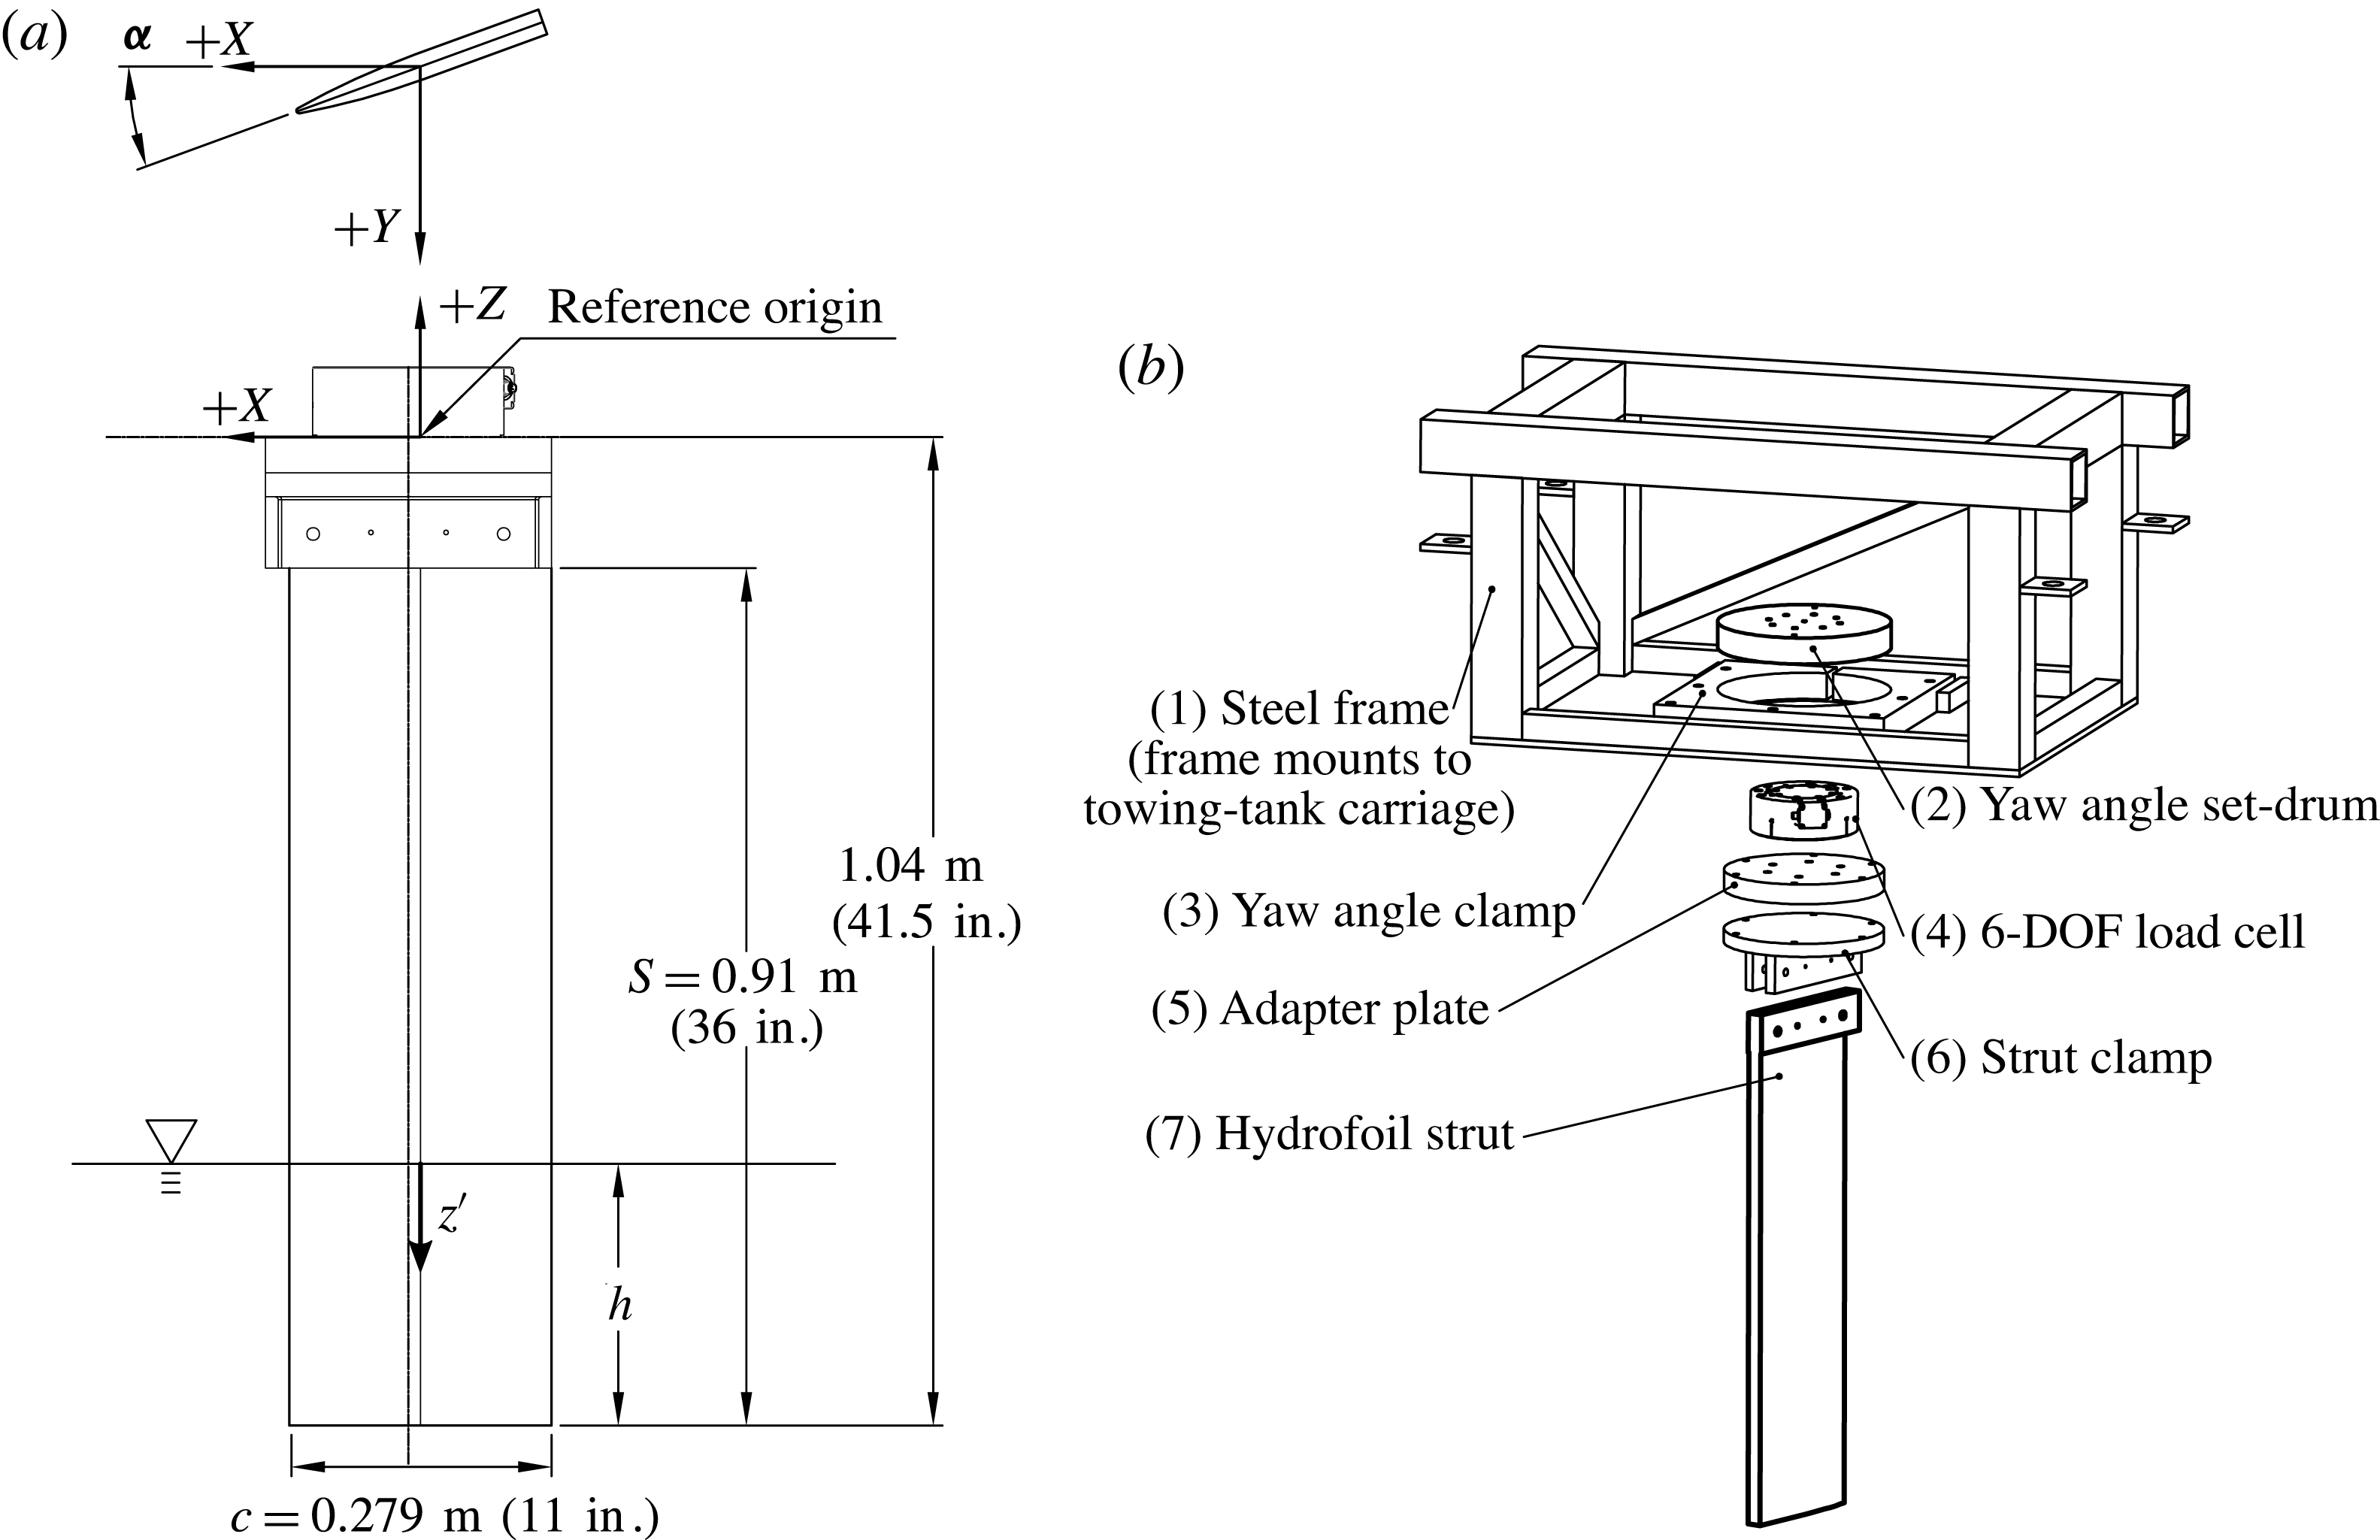
The hydrofoil was clamped at the root and slung vertically in a cantilevered configuration to pierce the water free surface, as shown in figure 5. A steel fixture frame was mounted between two longitudinal structural members of the towing-tank carriage (figure 5
b). Threaded feet were used to bring the frame to within
![]() $\pm 0.1^{\circ }$
of level, as measured in the
$\pm 0.1^{\circ }$
of level, as measured in the
![]() $X$
–
$X$
–
![]() $Z$
and
$Z$
and
![]() $Y$
–
$Y$
–
![]() $Z$
planes. The hydrofoil was coupled to the frame by way of a load cell that, in turn, attached to a drum that rotated about a vertical axis, permitting the yaw angle (angle of attack) to be varied. An ATI Omega-190 US 800-6000 six-degree-of-freedom force–torque transducer was used to measure forces and moments at the root of the hydrofoil.
$Z$
planes. The hydrofoil was coupled to the frame by way of a load cell that, in turn, attached to a drum that rotated about a vertical axis, permitting the yaw angle (angle of attack) to be varied. An ATI Omega-190 US 800-6000 six-degree-of-freedom force–torque transducer was used to measure forces and moments at the root of the hydrofoil.

Figure 5. Experimental apparatus for the surface-piercing foil experiments. (a) The foil geometry, foil dimensions and coordinate system used in the following discussion. (b) An exploded view of the components comprising the experimental rig. The entire apparatus attaches to the towing-tank carriage.
2.2 Videography and surface-flow visualization
Videography was performed using GoPro® brand cameras (HERO3 Black® models) in waterproof housings. Video was recorded with a resolution of
![]() $1920\times 1080$
pixels at a rate of 60 frames
$1920\times 1080$
pixels at a rate of 60 frames
![]() $\text{s}^{-1}$
. Lighting was provided by commercial halogen work lamps mounted below the carriage and aimed at the hydrofoil. Video streams were recorded above and below the water and were collectively synchronized with the data collection by an LED indicator in the field of view of each camera.
$\text{s}^{-1}$
. Lighting was provided by commercial halogen work lamps mounted below the carriage and aimed at the hydrofoil. Video streams were recorded above and below the water and were collectively synchronized with the data collection by an LED indicator in the field of view of each camera.
A limited number of surface-flow visualizations were conducted using a grid of paint dots, following the method of Green (Reference Green1988) and Green & Acosta (Reference Green and Acosta1991). Eight parts yellow artist’s oil paint and one part white oil primer were mixed with five to twelve parts refined linseed oil to achieve a range of shear-thinning behaviours, suitable for trials conducted at different speeds. Droplets of volume
![]() $10~{\rm\mu}\text{L}$
were applied as a grid on the suction surface of the hydrofoil with a pipette, with a spacing of approximately 1–2.5 cm (0.5–1 in.), totalling between 50 and 150 dots. Between each trial, the foil was wiped clean and the dots were reapplied.
$10~{\rm\mu}\text{L}$
were applied as a grid on the suction surface of the hydrofoil with a pipette, with a spacing of approximately 1–2.5 cm (0.5–1 in.), totalling between 50 and 150 dots. Between each trial, the foil was wiped clean and the dots were reapplied.
2.3 Experimental procedure
The yaw angle, or angle of attack (
![]() ${\it\alpha}$
), was measured as the rotation of the hydrofoil in the
${\it\alpha}$
), was measured as the rotation of the hydrofoil in the
![]() $X{-}Y$
plane. The yaw angle
$X{-}Y$
plane. The yaw angle
![]() ${\it\alpha}$
was set by visually sighting one-degree marks machined into the yaw drum (see figure 5) against a reference line calibrated to match the longitudinal axis of the towing tank. The drum was secured by tightening a collar clamp. The depth of immersion was varied by adding and draining water from the towing tank and visually sighting the water line against tick marks drawn along the span of the hydrofoil. Speed was measured by an optical encoder wheel, and instantaneous carriage speed was governed by an on-board controller. The variable
${\it\alpha}$
was set by visually sighting one-degree marks machined into the yaw drum (see figure 5) against a reference line calibrated to match the longitudinal axis of the towing tank. The drum was secured by tightening a collar clamp. The depth of immersion was varied by adding and draining water from the towing tank and visually sighting the water line against tick marks drawn along the span of the hydrofoil. Speed was measured by an optical encoder wheel, and instantaneous carriage speed was governed by an on-board controller. The variable
![]() $U_{\infty }$
denotes the steady-state speed entered as an input to the carriage speed controller, while
$U_{\infty }$
denotes the steady-state speed entered as an input to the carriage speed controller, while
![]() $u(t)$
is the instantaneous velocity of the carriage, measured by the optical encoder. During a run, the carriage accelerated to the specified speed (
$u(t)$
is the instantaneous velocity of the carriage, measured by the optical encoder. During a run, the carriage accelerated to the specified speed (
![]() $u(t)=U_{\infty }$
) and decelerated again along a programmed speed profile. The acceleration of the carriage during the ramp-up and ramp-down stages was software-limited to
$u(t)=U_{\infty }$
) and decelerated again along a programmed speed profile. The acceleration of the carriage during the ramp-up and ramp-down stages was software-limited to
![]() $\pm 0.025$
–
$\pm 0.025$
–
![]() $0.525~\text{m}~\text{s}^{-2}$
. The ranges of parameters investigated are given in table 2. Trials were conducted by varying
$0.525~\text{m}~\text{s}^{-2}$
. The ranges of parameters investigated are given in table 2. Trials were conducted by varying
![]() $U_{\infty }$
for each configuration of
$U_{\infty }$
for each configuration of
![]() ${\it\alpha}$
and
${\it\alpha}$
and
![]() $AR_{h}$
, then varying
$AR_{h}$
, then varying
![]() ${\it\alpha}$
within each fixed value of
${\it\alpha}$
within each fixed value of
![]() $AR_{h}$
, and varying
$AR_{h}$
, and varying
![]() $AR_{h}$
once all values of
$AR_{h}$
once all values of
![]() ${\it\alpha}$
and
${\it\alpha}$
and
![]() $Fn_{h}$
had been tested.
$Fn_{h}$
had been tested.
Table 2. Model dimensions and ranges of variables used in the present experiment.

For each trial, data collection was started while the carriage was at rest. For steady-state data collection, ramp-up and ramp-down times were minimized to increase the amount of data collected at the target condition of
![]() $u(t)=U_{\infty }$
. To study formation, elimination and other transient processes, the ramp-up and/or ramp-down times were typically made longer to minimize inertial effects. A small-diameter air jet (driven by a pneumatic tank at 350–700 kPa) was used to perturb the flow at the junction of the free surface and the foil leading edge in order to trigger ventilation at small yaw angles. Airflow through the jet was actuated by a solenoid valve, in turn controlled by an output from the data acquisition computer. The valve was set to open when
$u(t)=U_{\infty }$
. To study formation, elimination and other transient processes, the ramp-up and/or ramp-down times were typically made longer to minimize inertial effects. A small-diameter air jet (driven by a pneumatic tank at 350–700 kPa) was used to perturb the flow at the junction of the free surface and the foil leading edge in order to trigger ventilation at small yaw angles. Airflow through the jet was actuated by a solenoid valve, in turn controlled by an output from the data acquisition computer. The valve was set to open when
![]() $u(t)$
remained within
$u(t)$
remained within
![]() $\pm 3\,\%$
of
$\pm 3\,\%$
of
![]() $U_{\infty }$
continuously for a user-specified period of time, and to remain open for a user-specified duration. The duration of air injection was varied between 0.25 and 1 s as needed to achieve ventilation. Sufficient time (5–15 min) was permitted between runs to allow waves and currents in the tank to dissipate.
$U_{\infty }$
continuously for a user-specified period of time, and to remain open for a user-specified duration. The duration of air injection was varied between 0.25 and 1 s as needed to achieve ventilation. Sufficient time (5–15 min) was permitted between runs to allow waves and currents in the tank to dissipate.
2.4 Data collection and processing
The speed and load-cell outputs were recorded using a pair of 16-bit National Instruments multifunction DAQ cards on either a PCI-e bus or a dedicated PXI chassis. All signals were sampled at 1000 Hz, with asynchronism of less than
![]() $1~{\rm\mu}\text{s}$
introduced by channel muxing on the analogue-to-digital converters (ADCs). All voltage signals were normalized to a
$1~{\rm\mu}\text{s}$
introduced by channel muxing on the analogue-to-digital converters (ADCs). All voltage signals were normalized to a
![]() $\pm 10$
volt range to maximize the dynamic range of the ADCs.
$\pm 10$
volt range to maximize the dynamic range of the ADCs.
Windows around steady-state data were manually specified. In some cases, a short window was taken on data recorded during acceleration or deceleration phases. Data taken during transient flows were considered to be suitably quasi-steady when no significant topological changes were observed and when all recorded speeds remained within
![]() $\pm 3\,\%$
of the desired steady velocity during the window in question. In other words, a time window
$\pm 3\,\%$
of the desired steady velocity during the window in question. In other words, a time window
![]() $t_{w}$
was specified as
$t_{w}$
was specified as
![]() $t_{w}=\{t\mid u(t)~\text{within}~\pm 3\,\%~\text{of}~U_{\infty }\}$
. In this way, slowly varying ramped runs were used to canvas several quasi-steady flow conditions in a single run. Statistics for speed, force and moment coefficients, instantaneous accelerations, and other inferred quantities were calculated on these windows. Some transient effects, due to fluid inertia, are unavoidable. However, for
$t_{w}=\{t\mid u(t)~\text{within}~\pm 3\,\%~\text{of}~U_{\infty }\}$
. In this way, slowly varying ramped runs were used to canvas several quasi-steady flow conditions in a single run. Statistics for speed, force and moment coefficients, instantaneous accelerations, and other inferred quantities were calculated on these windows. Some transient effects, due to fluid inertia, are unavoidable. However, for
![]() $Fn_{h}>1$
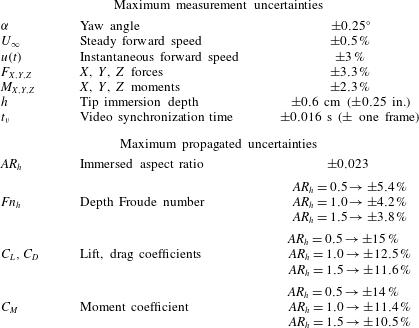
, the effect of unsteady inertial fluid loading on measured lift and drag may be neglected. The justification for this statement can be found in appendix B. The nominal uncertainty bounds of measured quantities and the propagated uncertainty in results of interest are presented in table 3.
$Fn_{h}>1$
, the effect of unsteady inertial fluid loading on measured lift and drag may be neglected. The justification for this statement can be found in appendix B. The nominal uncertainty bounds of measured quantities and the propagated uncertainty in results of interest are presented in table 3.
Table 3. Nominal error bounds of measured quantities are given in the first section. Values are quoted from the load-cell manufacturer in the case of forces and moments, estimated from recorded data in the case of speed, and taken to be one quarter of the smallest delineation for yaw angle and tip immersion. It should be noted that force/torque uncertainties are quoted at 50 % of the rated load, and include cumulative noise and quantization error. Propagated uncertainty bounds on quantities of interest are given in the second part. It should be noted that different values are given, corresponding to the three immersed aspect ratios that were tested.

3 Results: steady flows
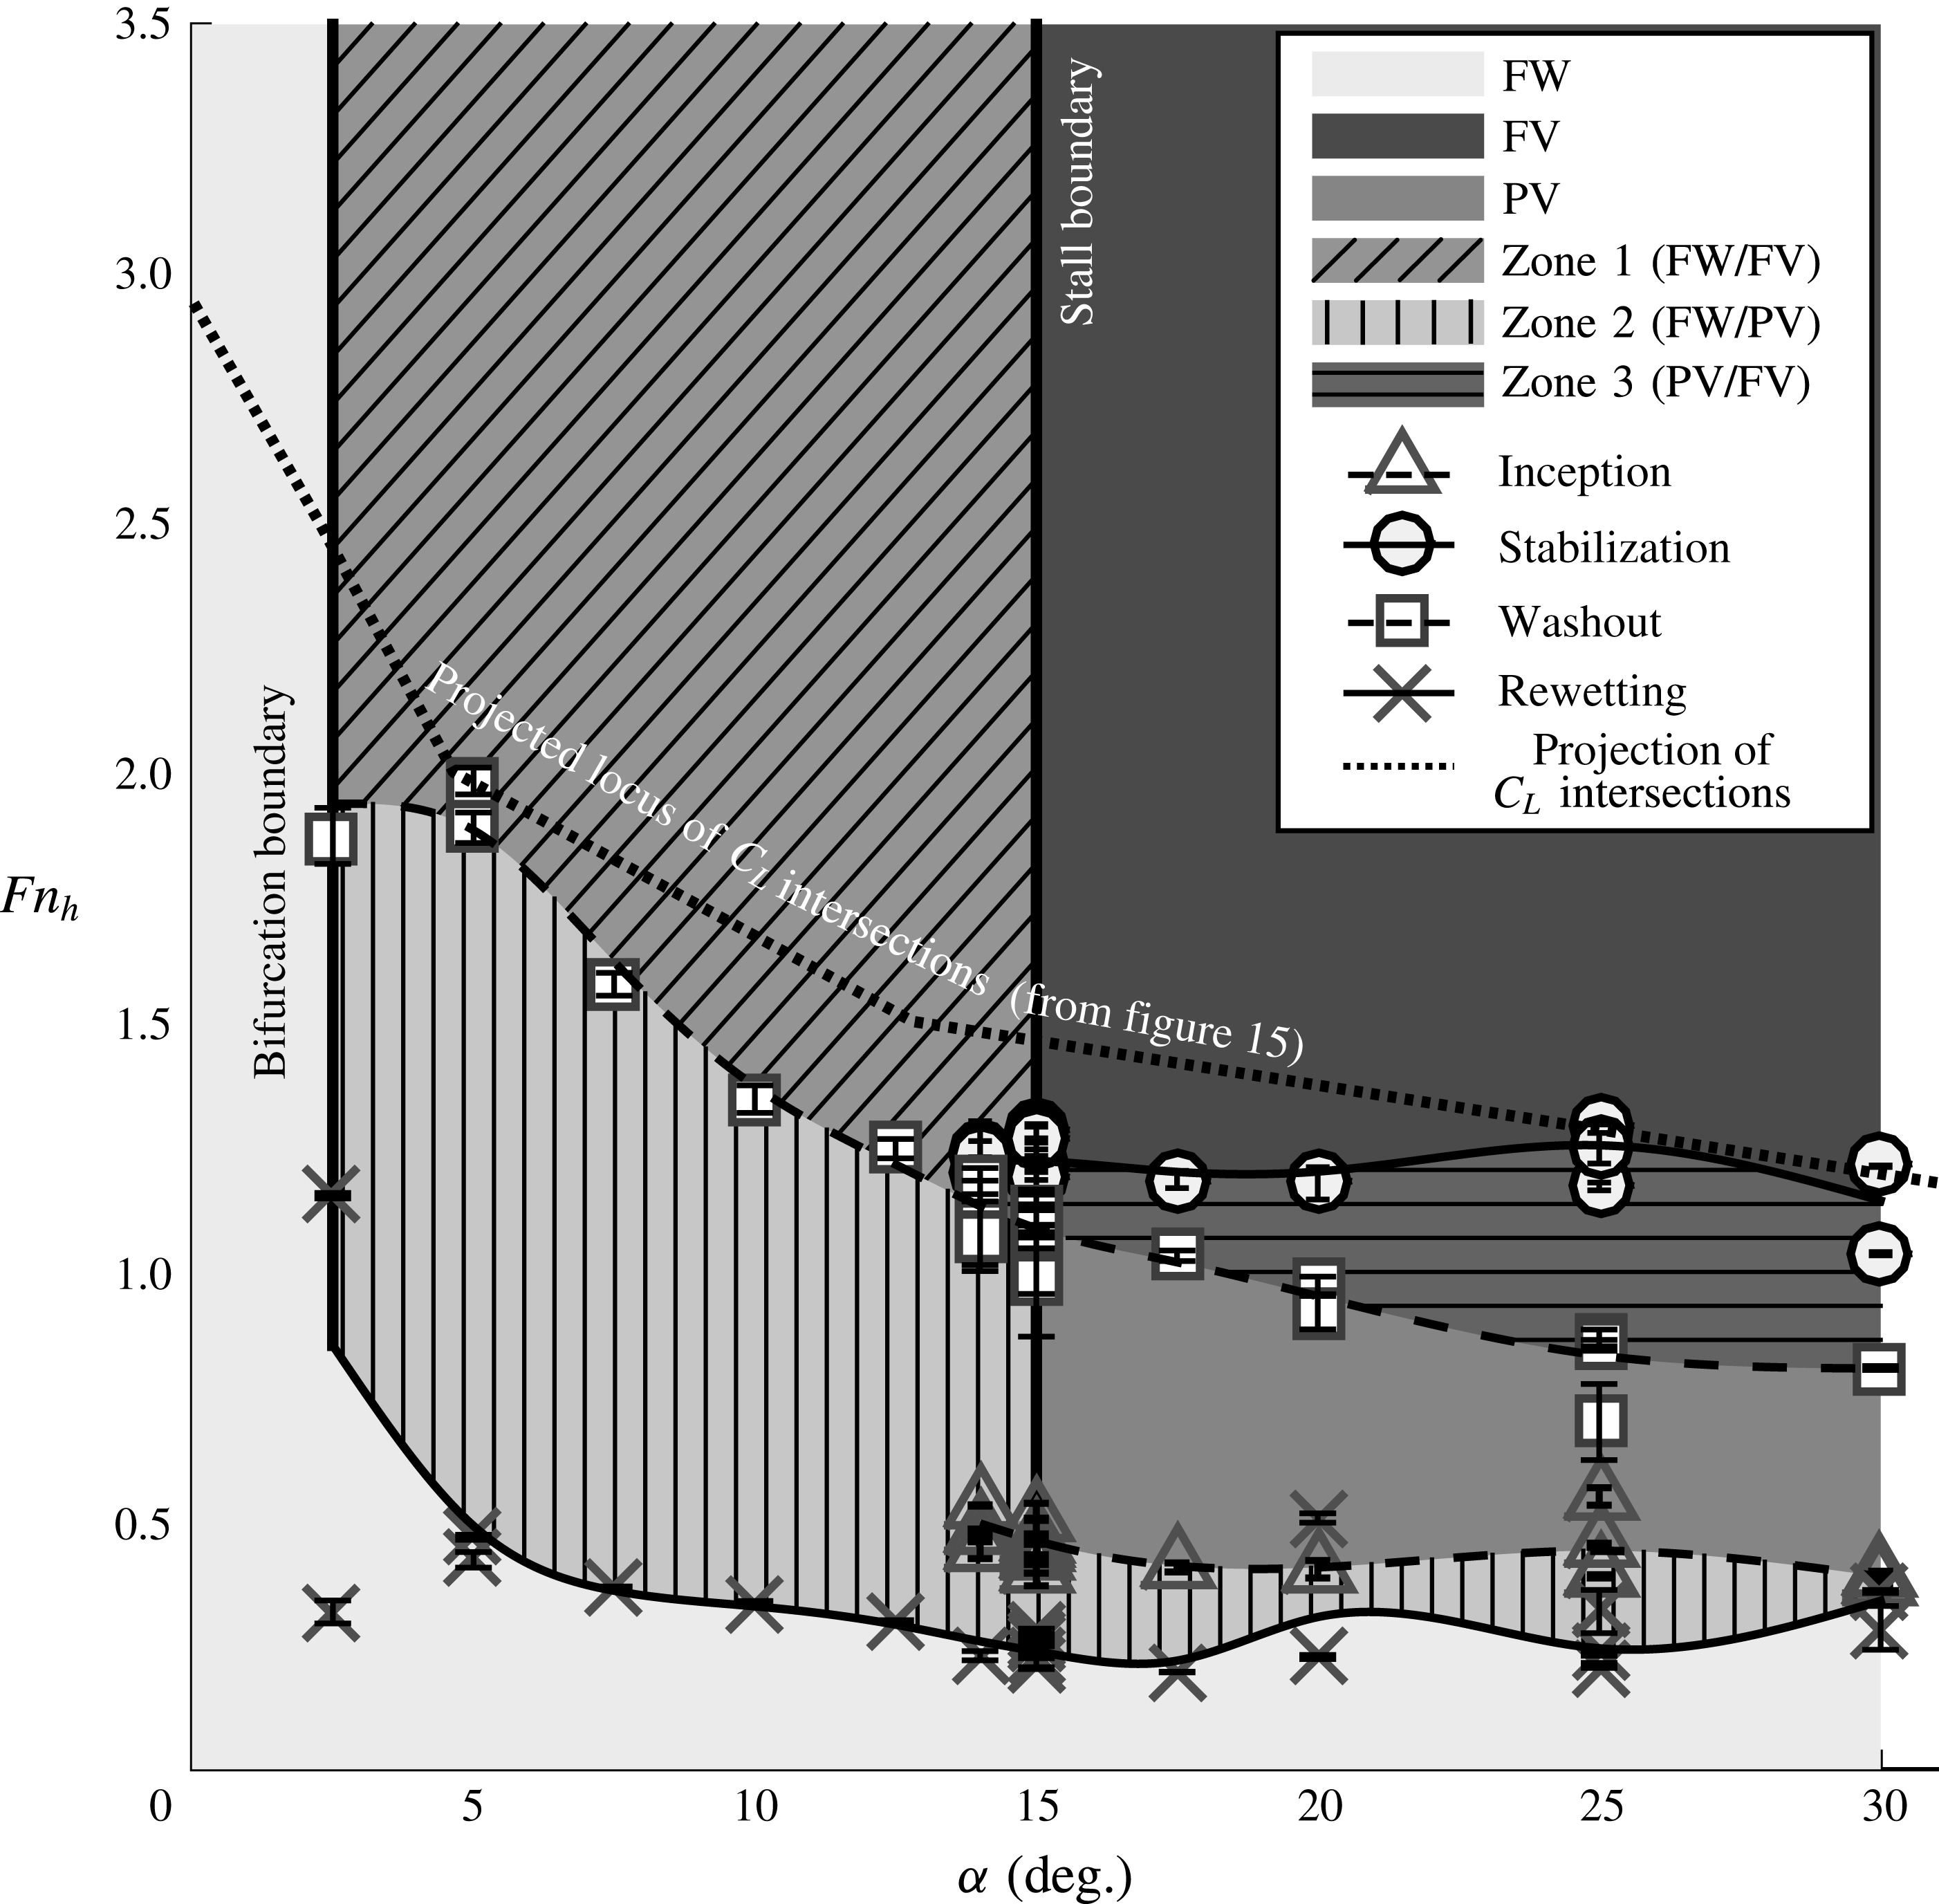
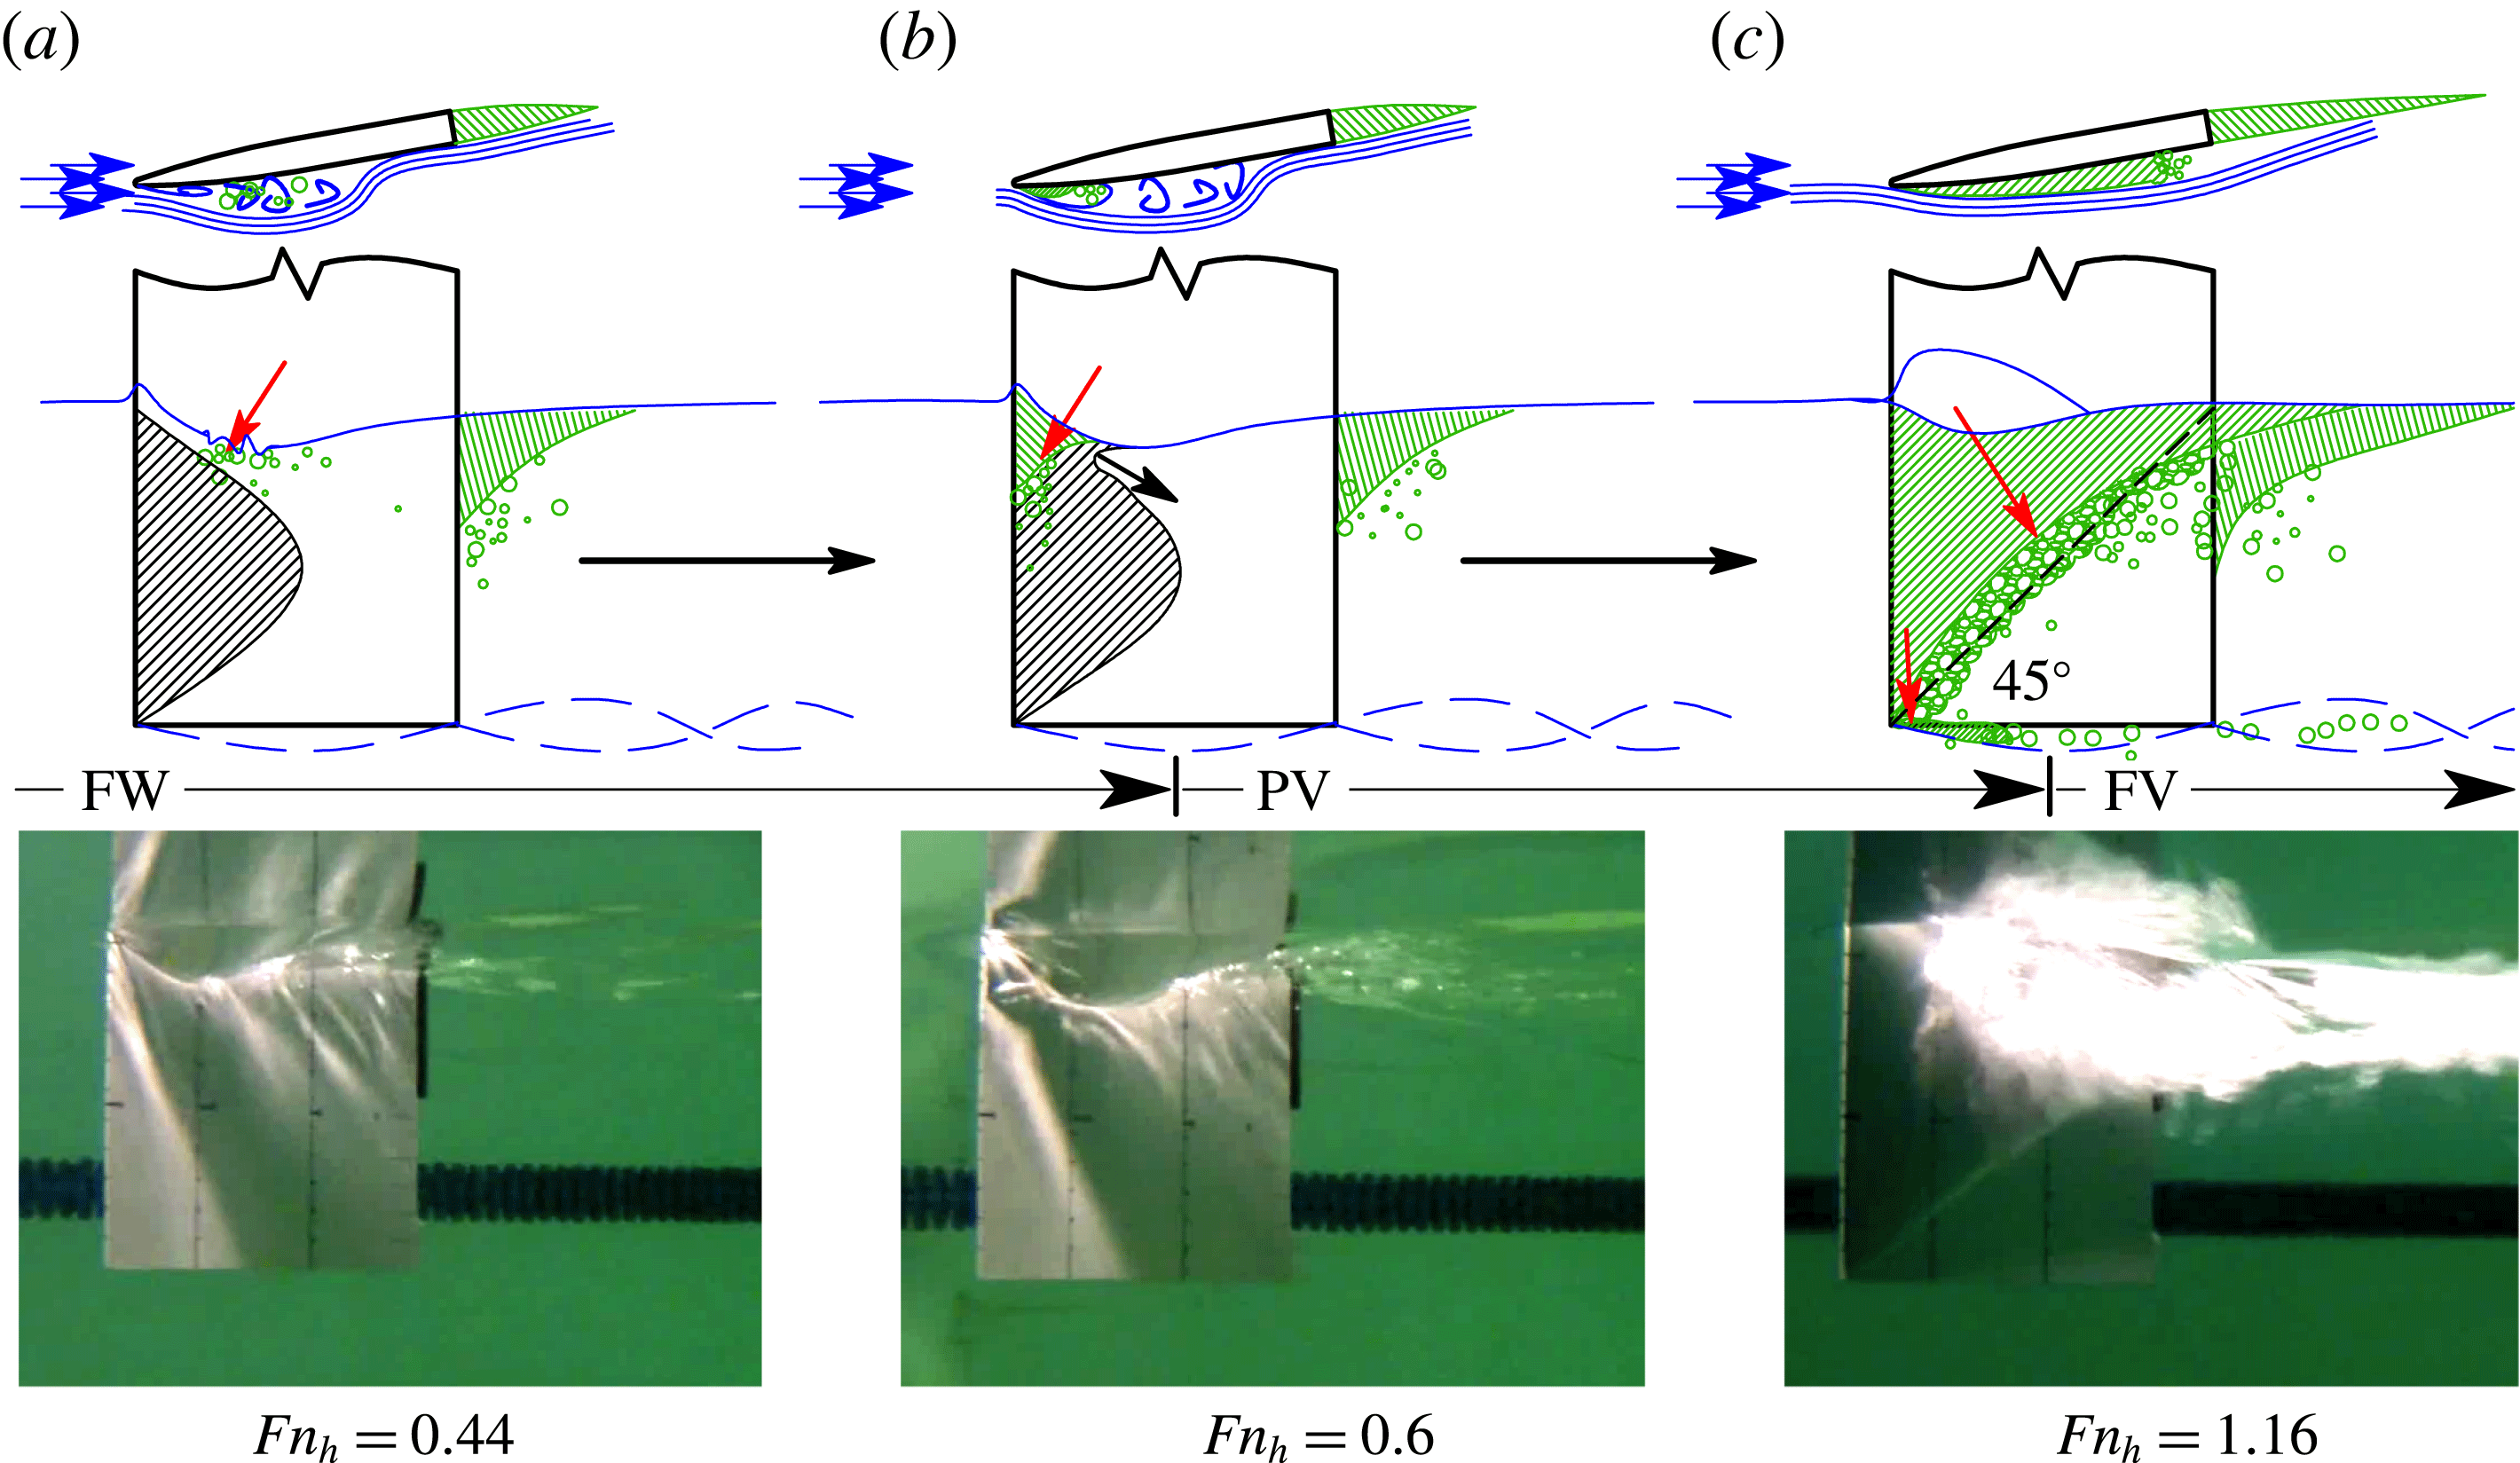
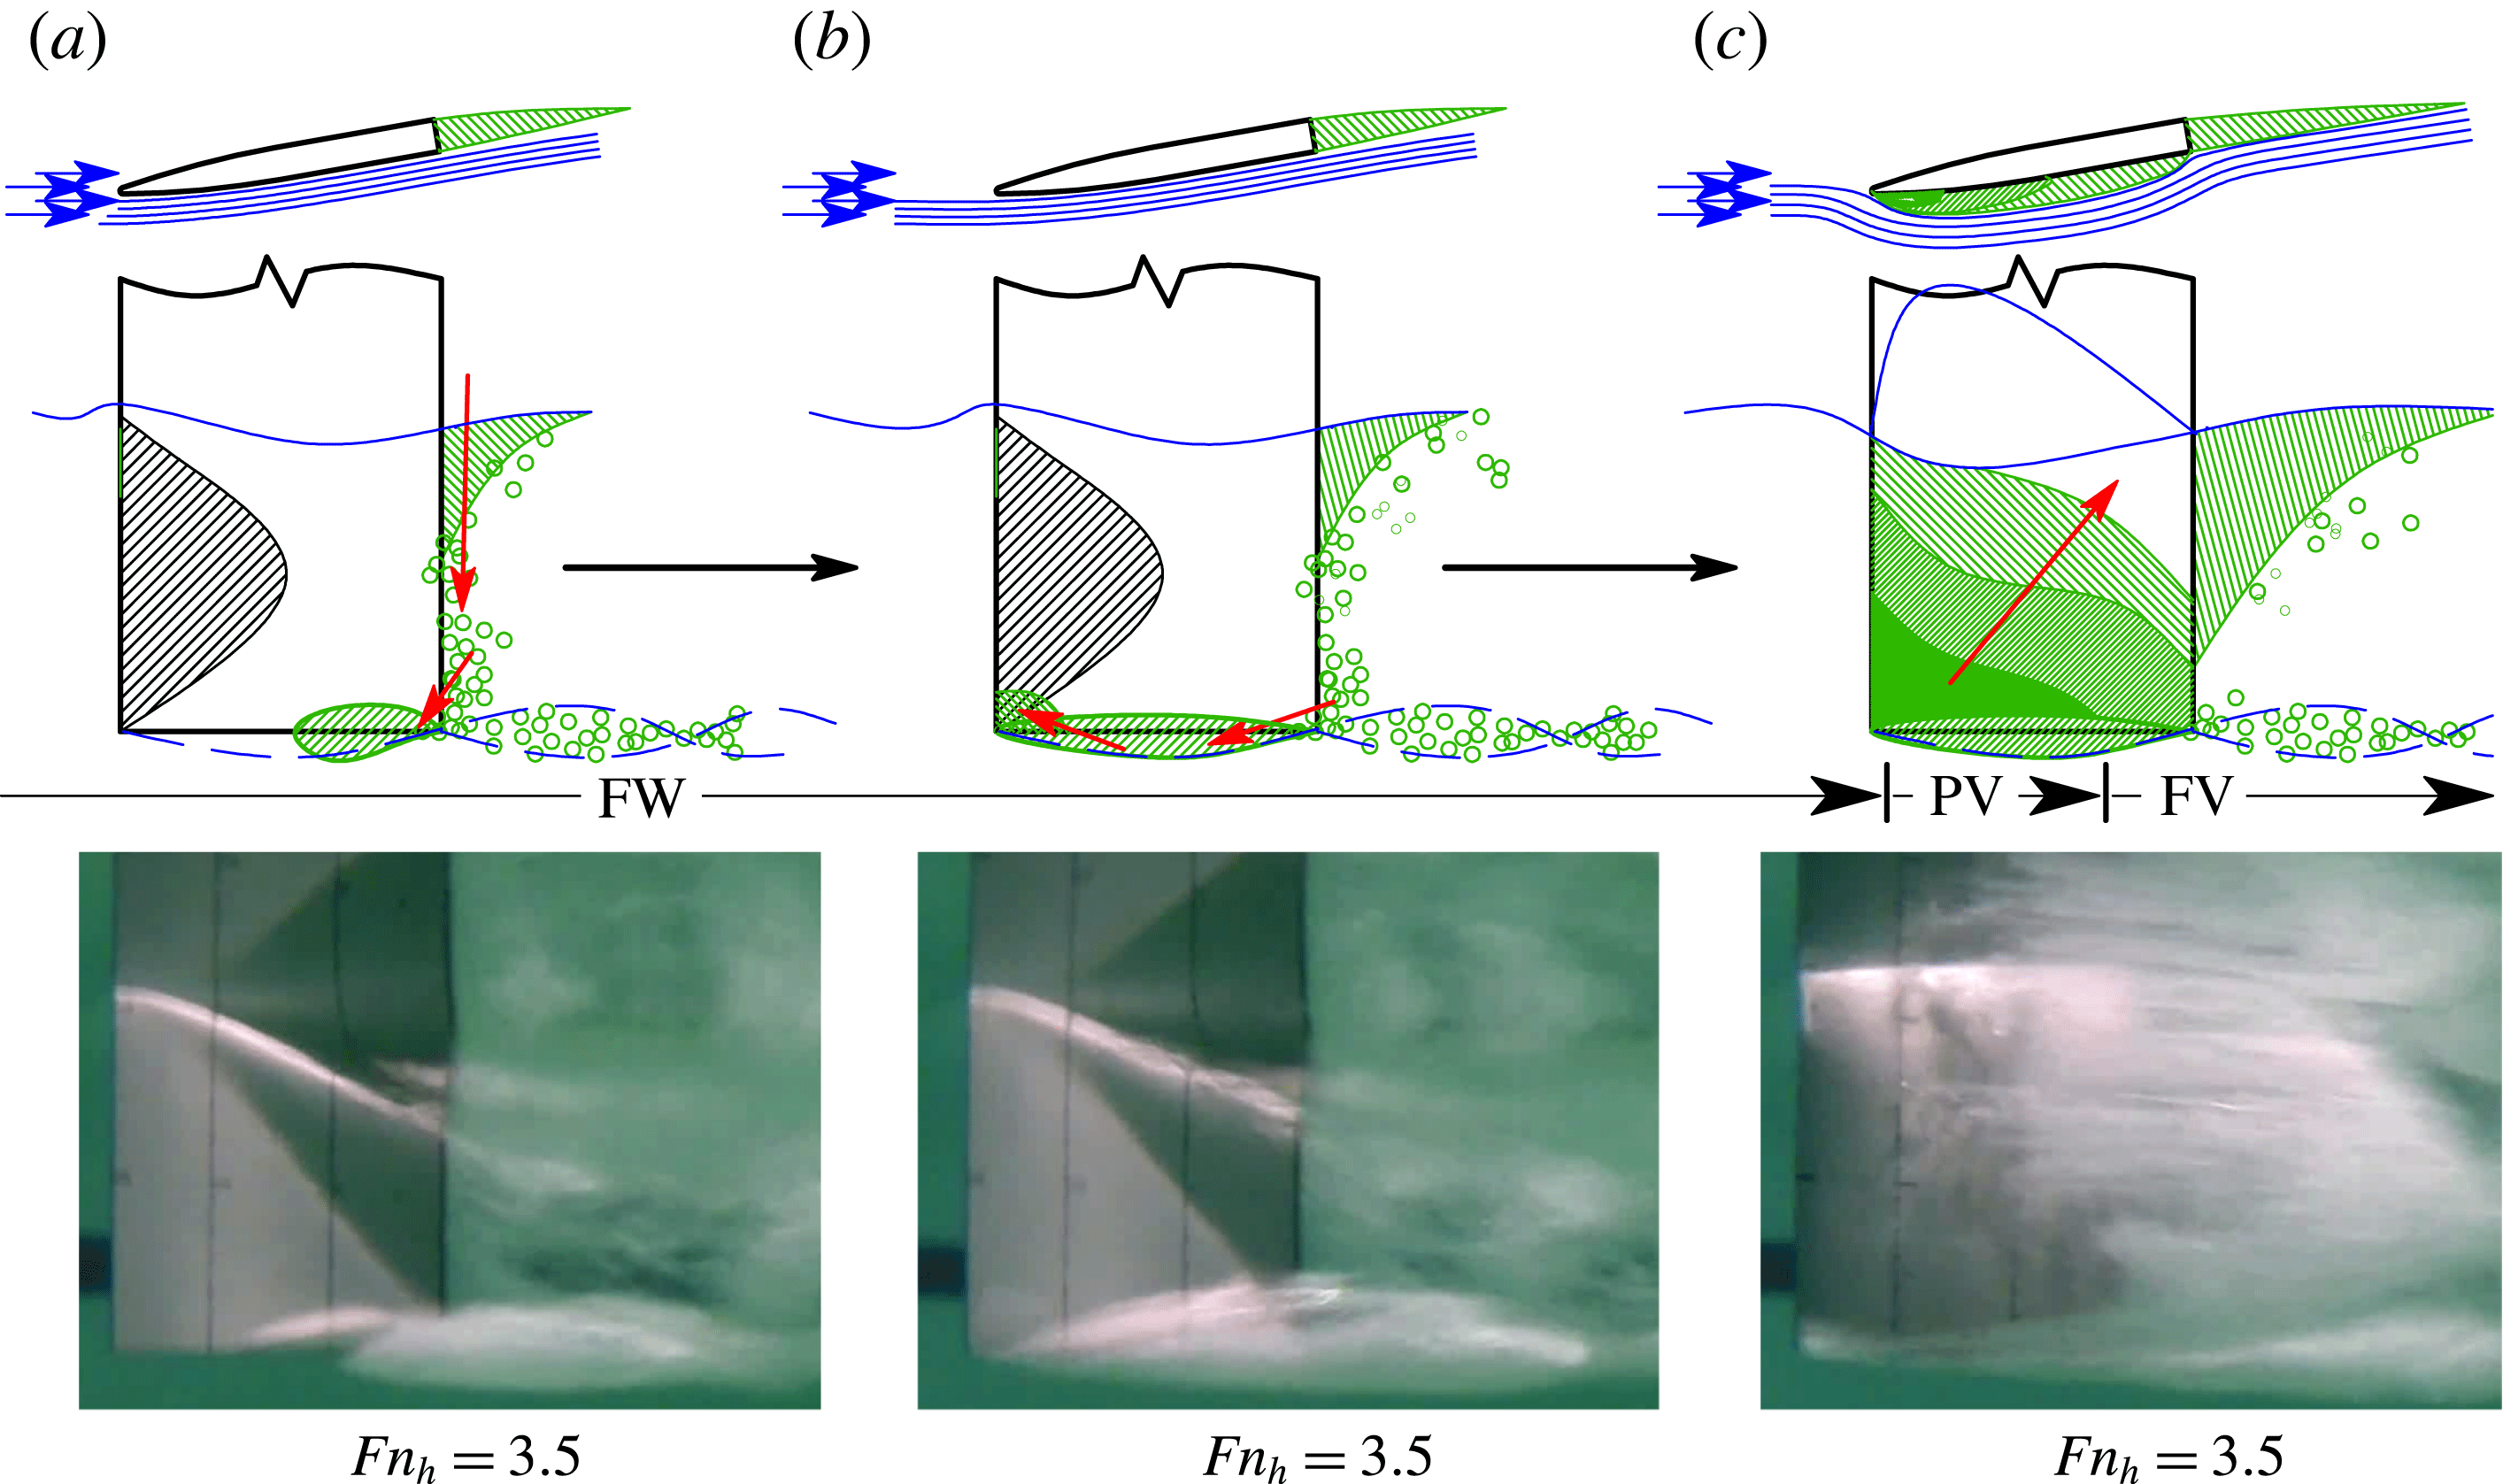
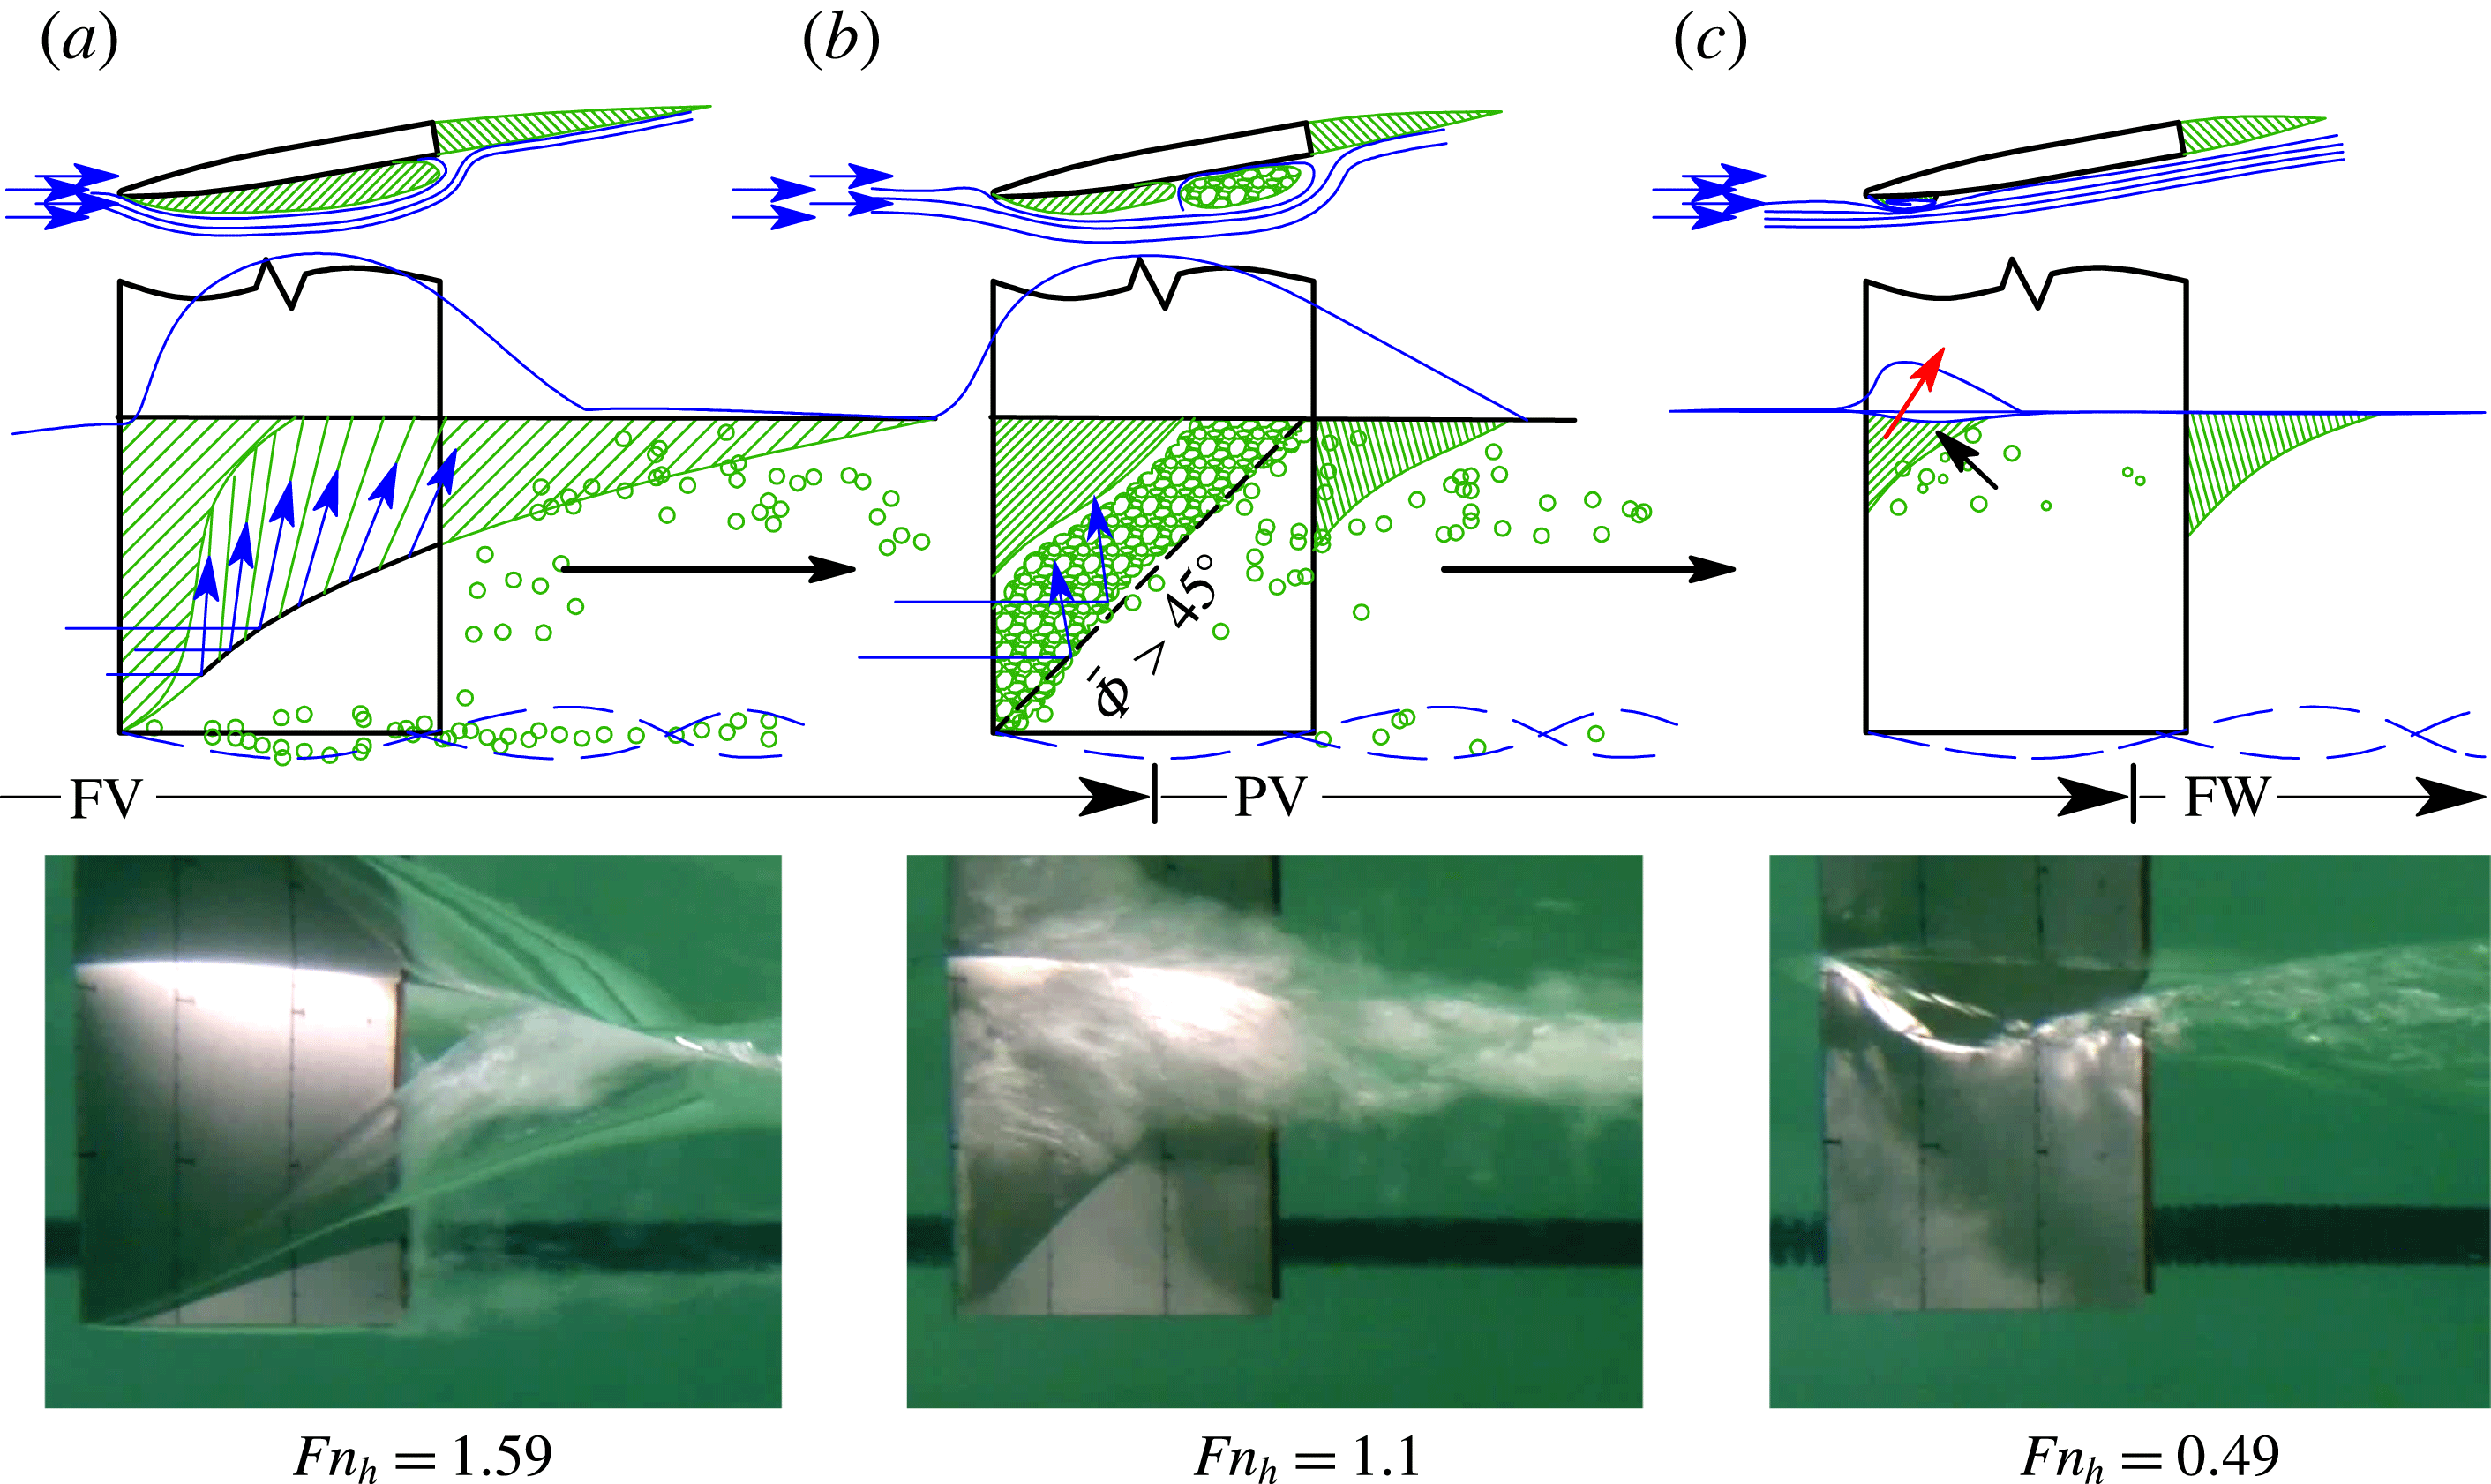
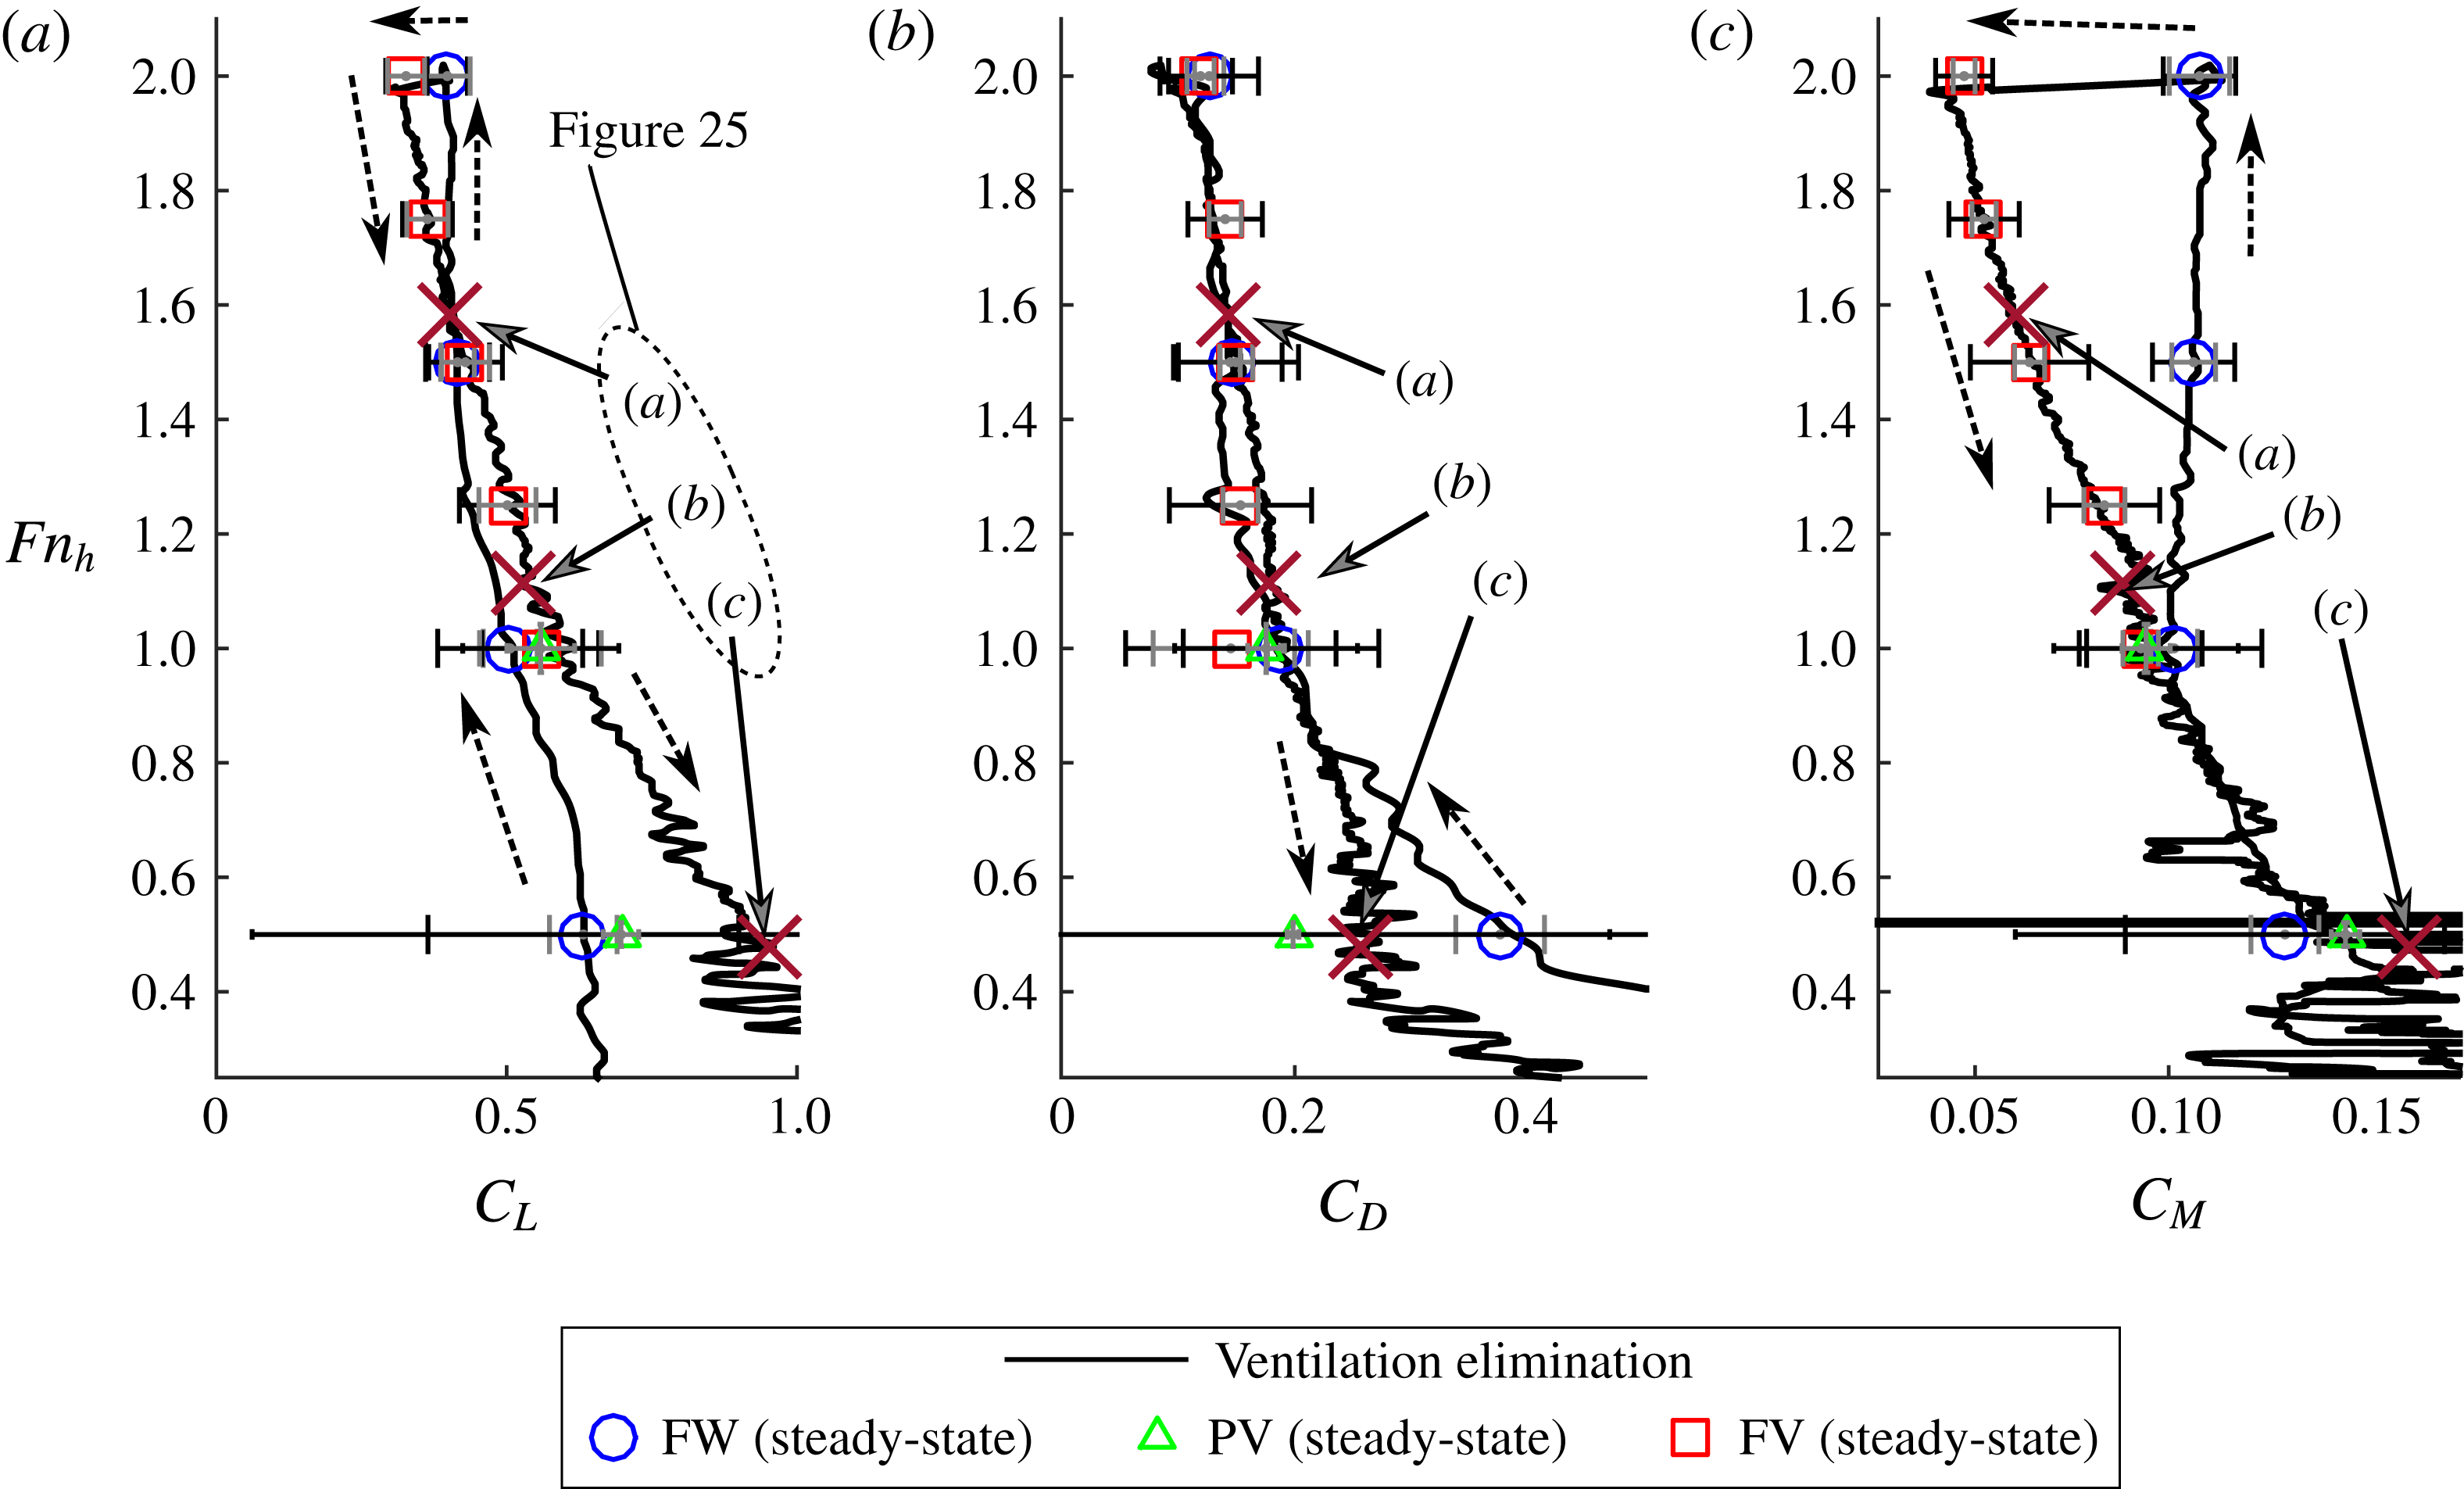
In this section, the flow structure of steady ventilation is described. The role of the re-entrant jet is described in § 3.1. Characteristic flow regimes are classified in § 3.2, and their effects on the hydrofoil hydrodynamic loading are given in § 3.3. The stability boundaries of the regimes are mapped in § 3.4.
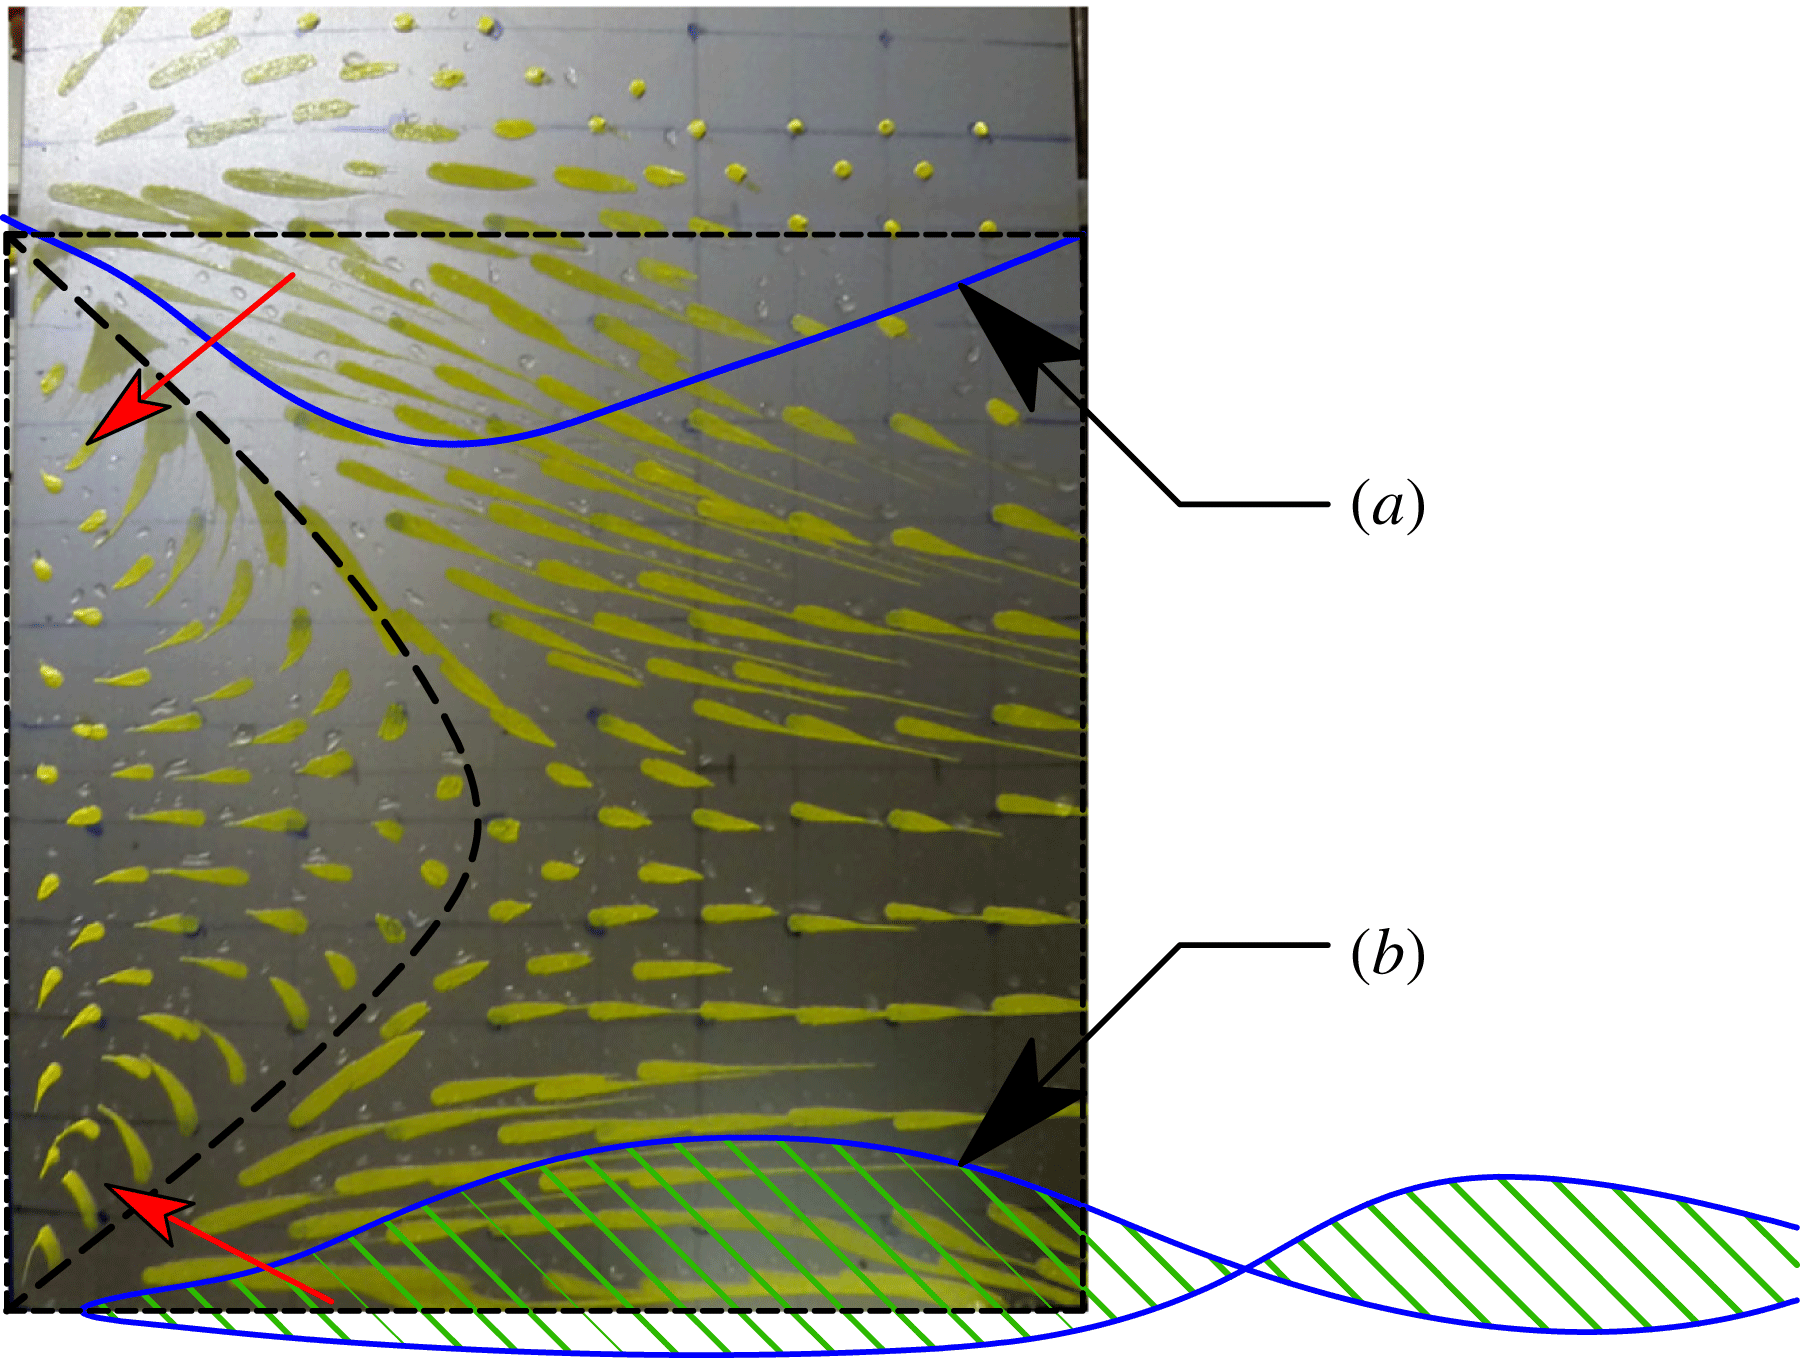
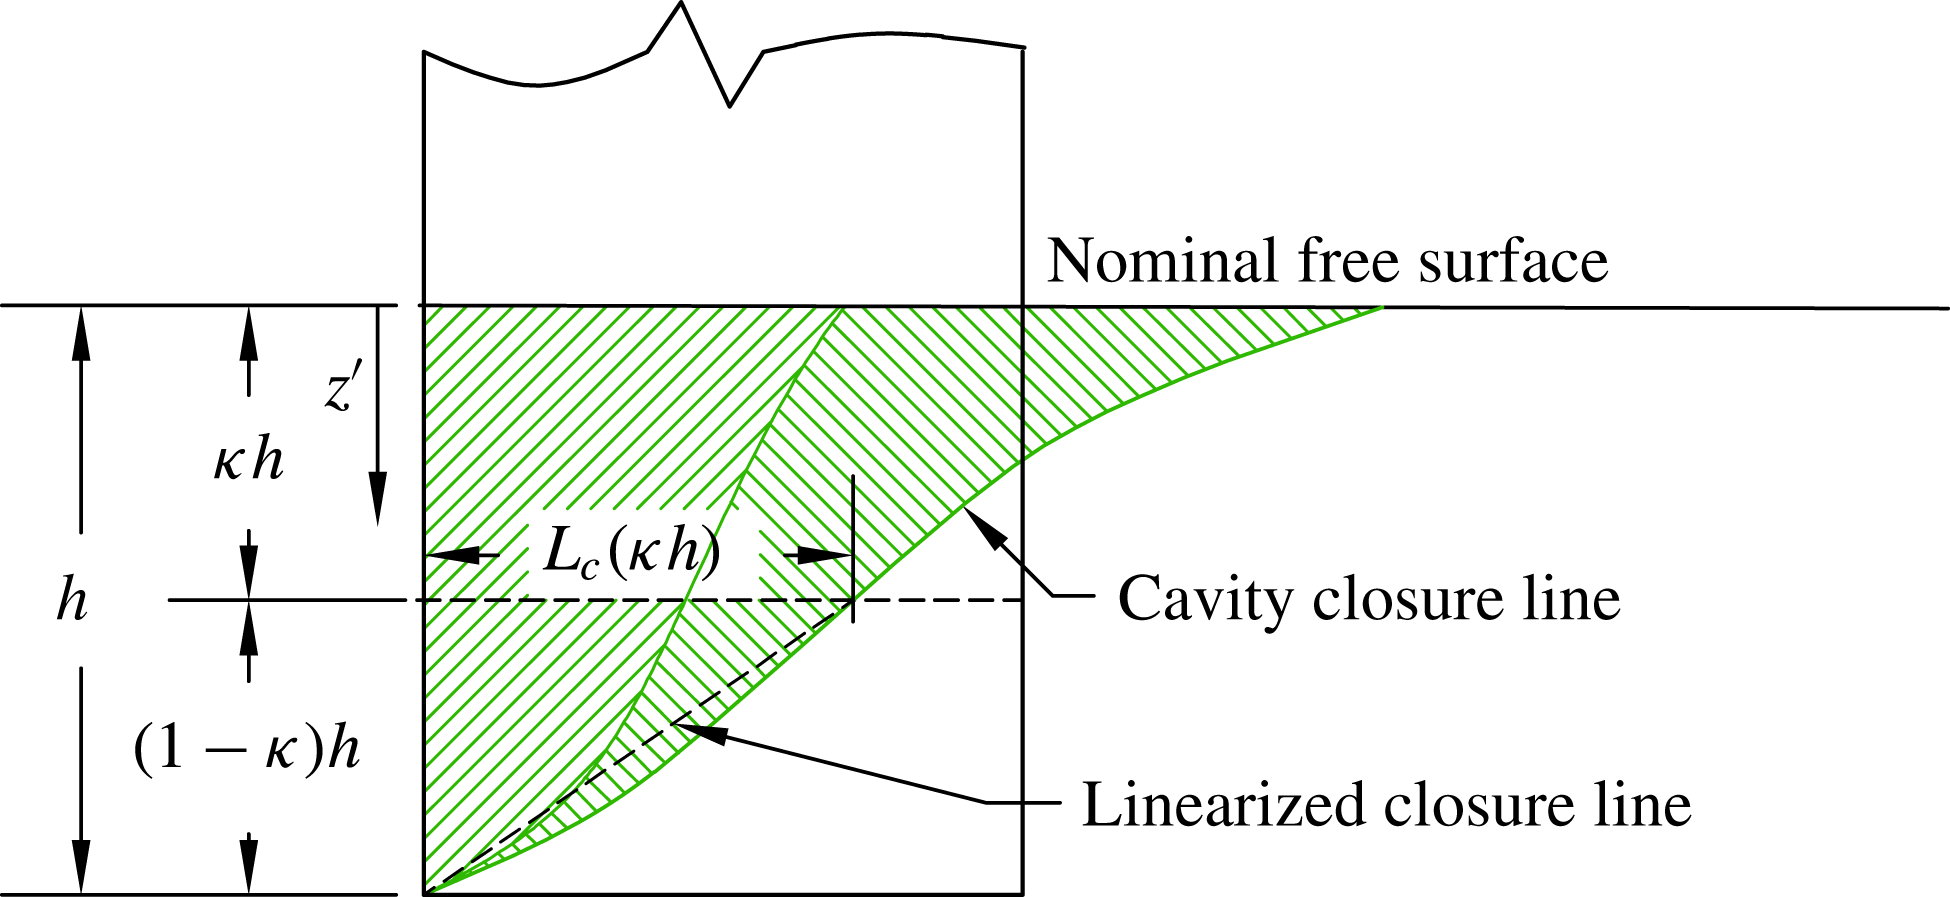
3.1 The re-entrant jet at cavity closure
Where a cavity closes on a solid surface, streamlines inside the stagnation streamline form a jet spray that undercuts the cavity, known as a re-entrant jet (Laberteaux & Ceccio Reference Laberteaux and Ceccio2001a
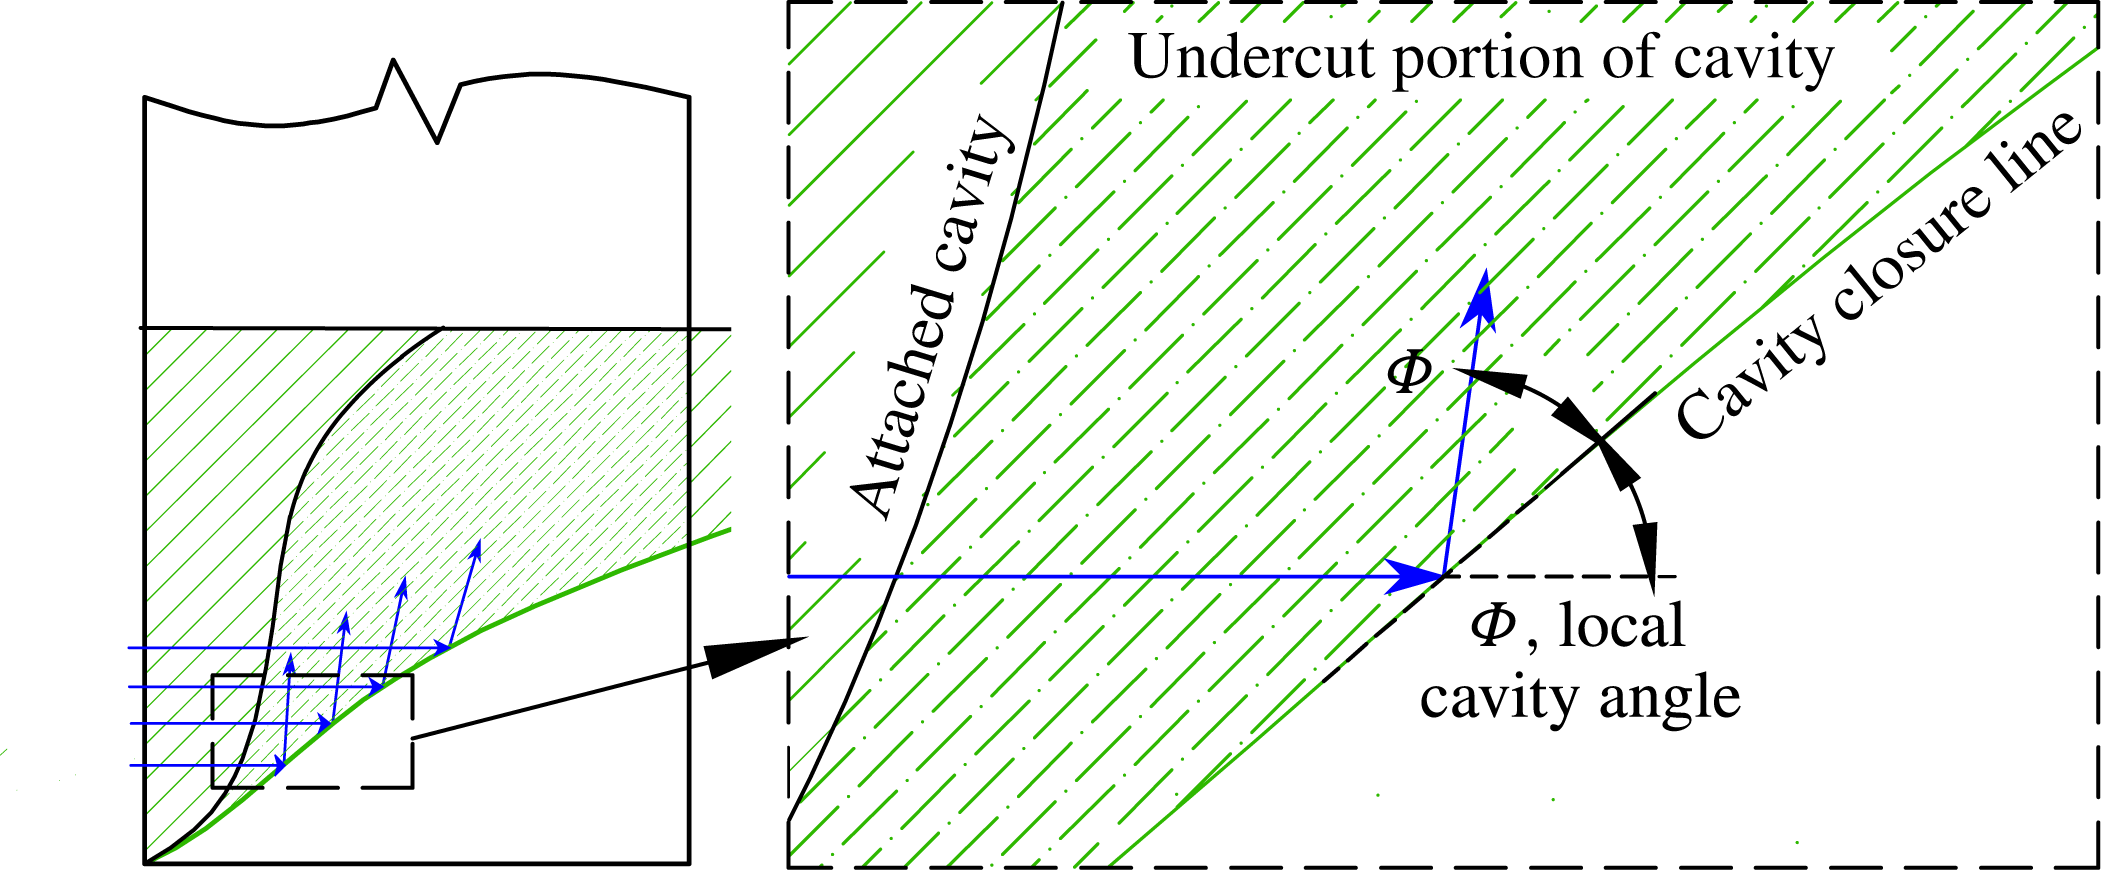
). In 2D flows, the re-entrant jet may impinge on the upstream cavity boundary, causing ‘pinch-off’. A well-known example is the phenomenon of sheet–cloud cavitation, which occurs when a re-entrant jet induces periodic shedding of vaporous partial cavities. When the line of cavity closure is non-normal to the incoming flow, the re-entrant jet is a reflection of the incoming flow about the cavity closure line, as shown in figure 6 (De Lange & De Bruin Reference De Lange and De Bruin1998; Laberteaux & Ceccio Reference Laberteaux and Ceccio2001b
; Franc & Michel Reference Franc and Michel2006). If incoming flow encounters a cavity closure line at a local angle of
![]() ${\it\Phi}$
from the horizontal plane, the jet flow will be directed at an angle of
${\it\Phi}$
from the horizontal plane, the jet flow will be directed at an angle of
![]() $2{\it\Phi}$
, as shown by the arrows in figure 6. At a given depth beneath the free surface,
$2{\it\Phi}$
, as shown by the arrows in figure 6. At a given depth beneath the free surface,
![]() $z^{\prime }$
, the magnitude of the jet velocity vector (
$z^{\prime }$
, the magnitude of the jet velocity vector (
![]() $\boldsymbol{U}_{j}$
) may be obtained by applying Bernoulli’s equation between the upstream flow (known velocity) and the cavity boundary (known pressure) to obtain
$\boldsymbol{U}_{j}$
) may be obtained by applying Bernoulli’s equation between the upstream flow (known velocity) and the cavity boundary (known pressure) to obtain
The respective streamwise (
![]() $U_{j}$
) and spanwise (
$U_{j}$
) and spanwise (
![]() $W_{j}$
) components of the re-entrant jet velocity are (Harwood et al.
Reference Harwood, Brucker, Miguel, Young and Ceccio2014)
$W_{j}$
) components of the re-entrant jet velocity are (Harwood et al.
Reference Harwood, Brucker, Miguel, Young and Ceccio2014)

Figure 6. Schematic representation of the re-entrant jet on a spanwise-varying cavity. When incoming flow (arrows) encounters an oblique line of cavity closure at a local angle
![]() ${\it\Phi}$
, the flow is reflected about the normal to the cavity closure line so that the resulting jet spray is directed along an angle of
${\it\Phi}$
, the flow is reflected about the normal to the cavity closure line so that the resulting jet spray is directed along an angle of
![]() $2{\it\Phi}$
from the horizontal plane.
$2{\it\Phi}$
from the horizontal plane.
The notion of re-entrant as a reflection of incoming flow is reinforced by the surface-flow visualization shown in figure 7. Paint dots were applied as described in § 2.2, and the hydrofoil was accelerated along a ramped velocity profile at a yaw angle sufficiently large for a ventilated cavity to spontaneously develop (
![]() ${\it\alpha}=14^{\circ }$
). As the forward velocity,
${\it\alpha}=14^{\circ }$
). As the forward velocity,
![]() $u$
, increased, the ventilated cavity grew in size. The re-entrant jet at the cavity closure line was swept over the paint dots, causing the dots to shear in the direction of the local jet spray. Some smearing of the dots was unavoidable, as the dots were sheared somewhat in the streamwise direction prior to their interaction with the re-entrant jet; nevertheless, the primary directions of streaking clearly coincide with the superimposed arrows, which indicate the local
$u$
, increased, the ventilated cavity grew in size. The re-entrant jet at the cavity closure line was swept over the paint dots, causing the dots to shear in the direction of the local jet spray. Some smearing of the dots was unavoidable, as the dots were sheared somewhat in the streamwise direction prior to their interaction with the re-entrant jet; nevertheless, the primary directions of streaking clearly coincide with the superimposed arrows, which indicate the local
![]() $2{\it\Phi}$
trajectories at their intersections with the respective cavity profiles.
$2{\it\Phi}$
trajectories at their intersections with the respective cavity profiles.

Figure 7. Paint streaks on the suction side of a hydrofoil in accelerating flow at
![]() ${\it\alpha}=14^{\circ }$
,
${\it\alpha}=14^{\circ }$
,
![]() $AR_{h}=1$
. As the speed increased, the cavity grew (see b–d), sweeping the re-entrant jet over the surface of the foil and shearing the paint in the direction of the jet. Cavity profiles are drawn for
$AR_{h}=1$
. As the speed increased, the cavity grew (see b–d), sweeping the re-entrant jet over the surface of the foil and shearing the paint in the direction of the jet. Cavity profiles are drawn for
![]() $Fn_{h}=1.15,1.5$
and 2.0. Superimposed on each cavity profile are arrows indicating the local theoretical re-entrant jet direction of
$Fn_{h}=1.15,1.5$
and 2.0. Superimposed on each cavity profile are arrows indicating the local theoretical re-entrant jet direction of
![]() $2{\it\Phi}$
. The streaks in the paint coincide with the theoretical jet directions, indicating that the theory ((3.2a
) and (3.2b
)) correctly predicts the trajectory of the re-entrant flow.
$2{\it\Phi}$
. The streaks in the paint coincide with the theoretical jet directions, indicating that the theory ((3.2a
) and (3.2b
)) correctly predicts the trajectory of the re-entrant flow.
When the local angle of the cavity closure line is
![]() ${\it\Phi}>45^{\circ }$
, the re-entrant jet will possess an upstream velocity component. With enough momentum, the jet impinges on the leading edge of the ventilated cavity, causing a large-scale shedding of the cavity via pinch-off (as in the case of sheet–cloud cavitation, described earlier). If this occurs over a significant portion of the span, then a ventilated cavity becomes unstable.
${\it\Phi}>45^{\circ }$
, the re-entrant jet will possess an upstream velocity component. With enough momentum, the jet impinges on the leading edge of the ventilated cavity, causing a large-scale shedding of the cavity via pinch-off (as in the case of sheet–cloud cavitation, described earlier). If this occurs over a significant portion of the span, then a ventilated cavity becomes unstable.
At this point, it is useful to define stability in the context of ventilated flows. If a configuration, or regime, of the flow remains unchanged following any perturbation to the flow, then that regime is considered to be exclusively and globally stable. If small perturbations do not affect the flow regime, but large perturbations cause transition to another flow regime, then the regime is considered to be locally stable. The coexistence of a locally stable regime and another locally or globally stable regime constitutes a bi-stable set of conditions. For given flow conditions, a flow regime is considered to be unstable if it cannot be sustained, even if left unperturbed.
A criterion of
![]() $\bar{{\it\Phi}}=45^{\circ }$
is proposed on the stability of fully ventilated cavities, where
$\bar{{\it\Phi}}=45^{\circ }$
is proposed on the stability of fully ventilated cavities, where
![]() $\bar{{\it\Phi}}$
is the angle of a linear approximation to the cavity closure line. To verify that
$\bar{{\it\Phi}}$
is the angle of a linear approximation to the cavity closure line. To verify that
![]() $\bar{{\it\Phi}}$
is a suitable metric, images were taken of ventilated cavities in decelerating flows, immediately preceding the instant when the cavity became unstable. The cavity length was measured at three spanwise stations, as shown in figure 8(a), through which was fitted an affine curve to get the value of
$\bar{{\it\Phi}}$
is a suitable metric, images were taken of ventilated cavities in decelerating flows, immediately preceding the instant when the cavity became unstable. The cavity length was measured at three spanwise stations, as shown in figure 8(a), through which was fitted an affine curve to get the value of
![]() $\bar{{\it\Phi}}$
, measured from the horizontal plane. The criterion
$\bar{{\it\Phi}}$
, measured from the horizontal plane. The criterion
![]() $\bar{{\it\Phi}}$
is plotted as a function of
$\bar{{\it\Phi}}$
is plotted as a function of
![]() ${\it\alpha}$
and
${\it\alpha}$
and
![]() $AR_{h}$
in figure 8(b). Measurements were translated into real-world coordinates by using an inverse projective transform. The results show the cavity angle at washout to be tightly clustered around a mean of
$AR_{h}$
in figure 8(b). Measurements were translated into real-world coordinates by using an inverse projective transform. The results show the cavity angle at washout to be tightly clustered around a mean of
![]() $\bar{{\it\Phi}}\approx 41^{\circ }$
for all values of
$\bar{{\it\Phi}}\approx 41^{\circ }$
for all values of
![]() ${\it\alpha}$
and
${\it\alpha}$
and
![]() $AR_{h}$
, which is acceptably close to the proposed stability boundary at
$AR_{h}$
, which is acceptably close to the proposed stability boundary at
![]() $\bar{{\it\Phi}}=45^{\circ }$
. With this stability condition, the topology of a cavity may be used to unambiguously distinguish partial ventilation from full ventilation in 3D flows.
$\bar{{\it\Phi}}=45^{\circ }$
. With this stability condition, the topology of a cavity may be used to unambiguously distinguish partial ventilation from full ventilation in 3D flows.
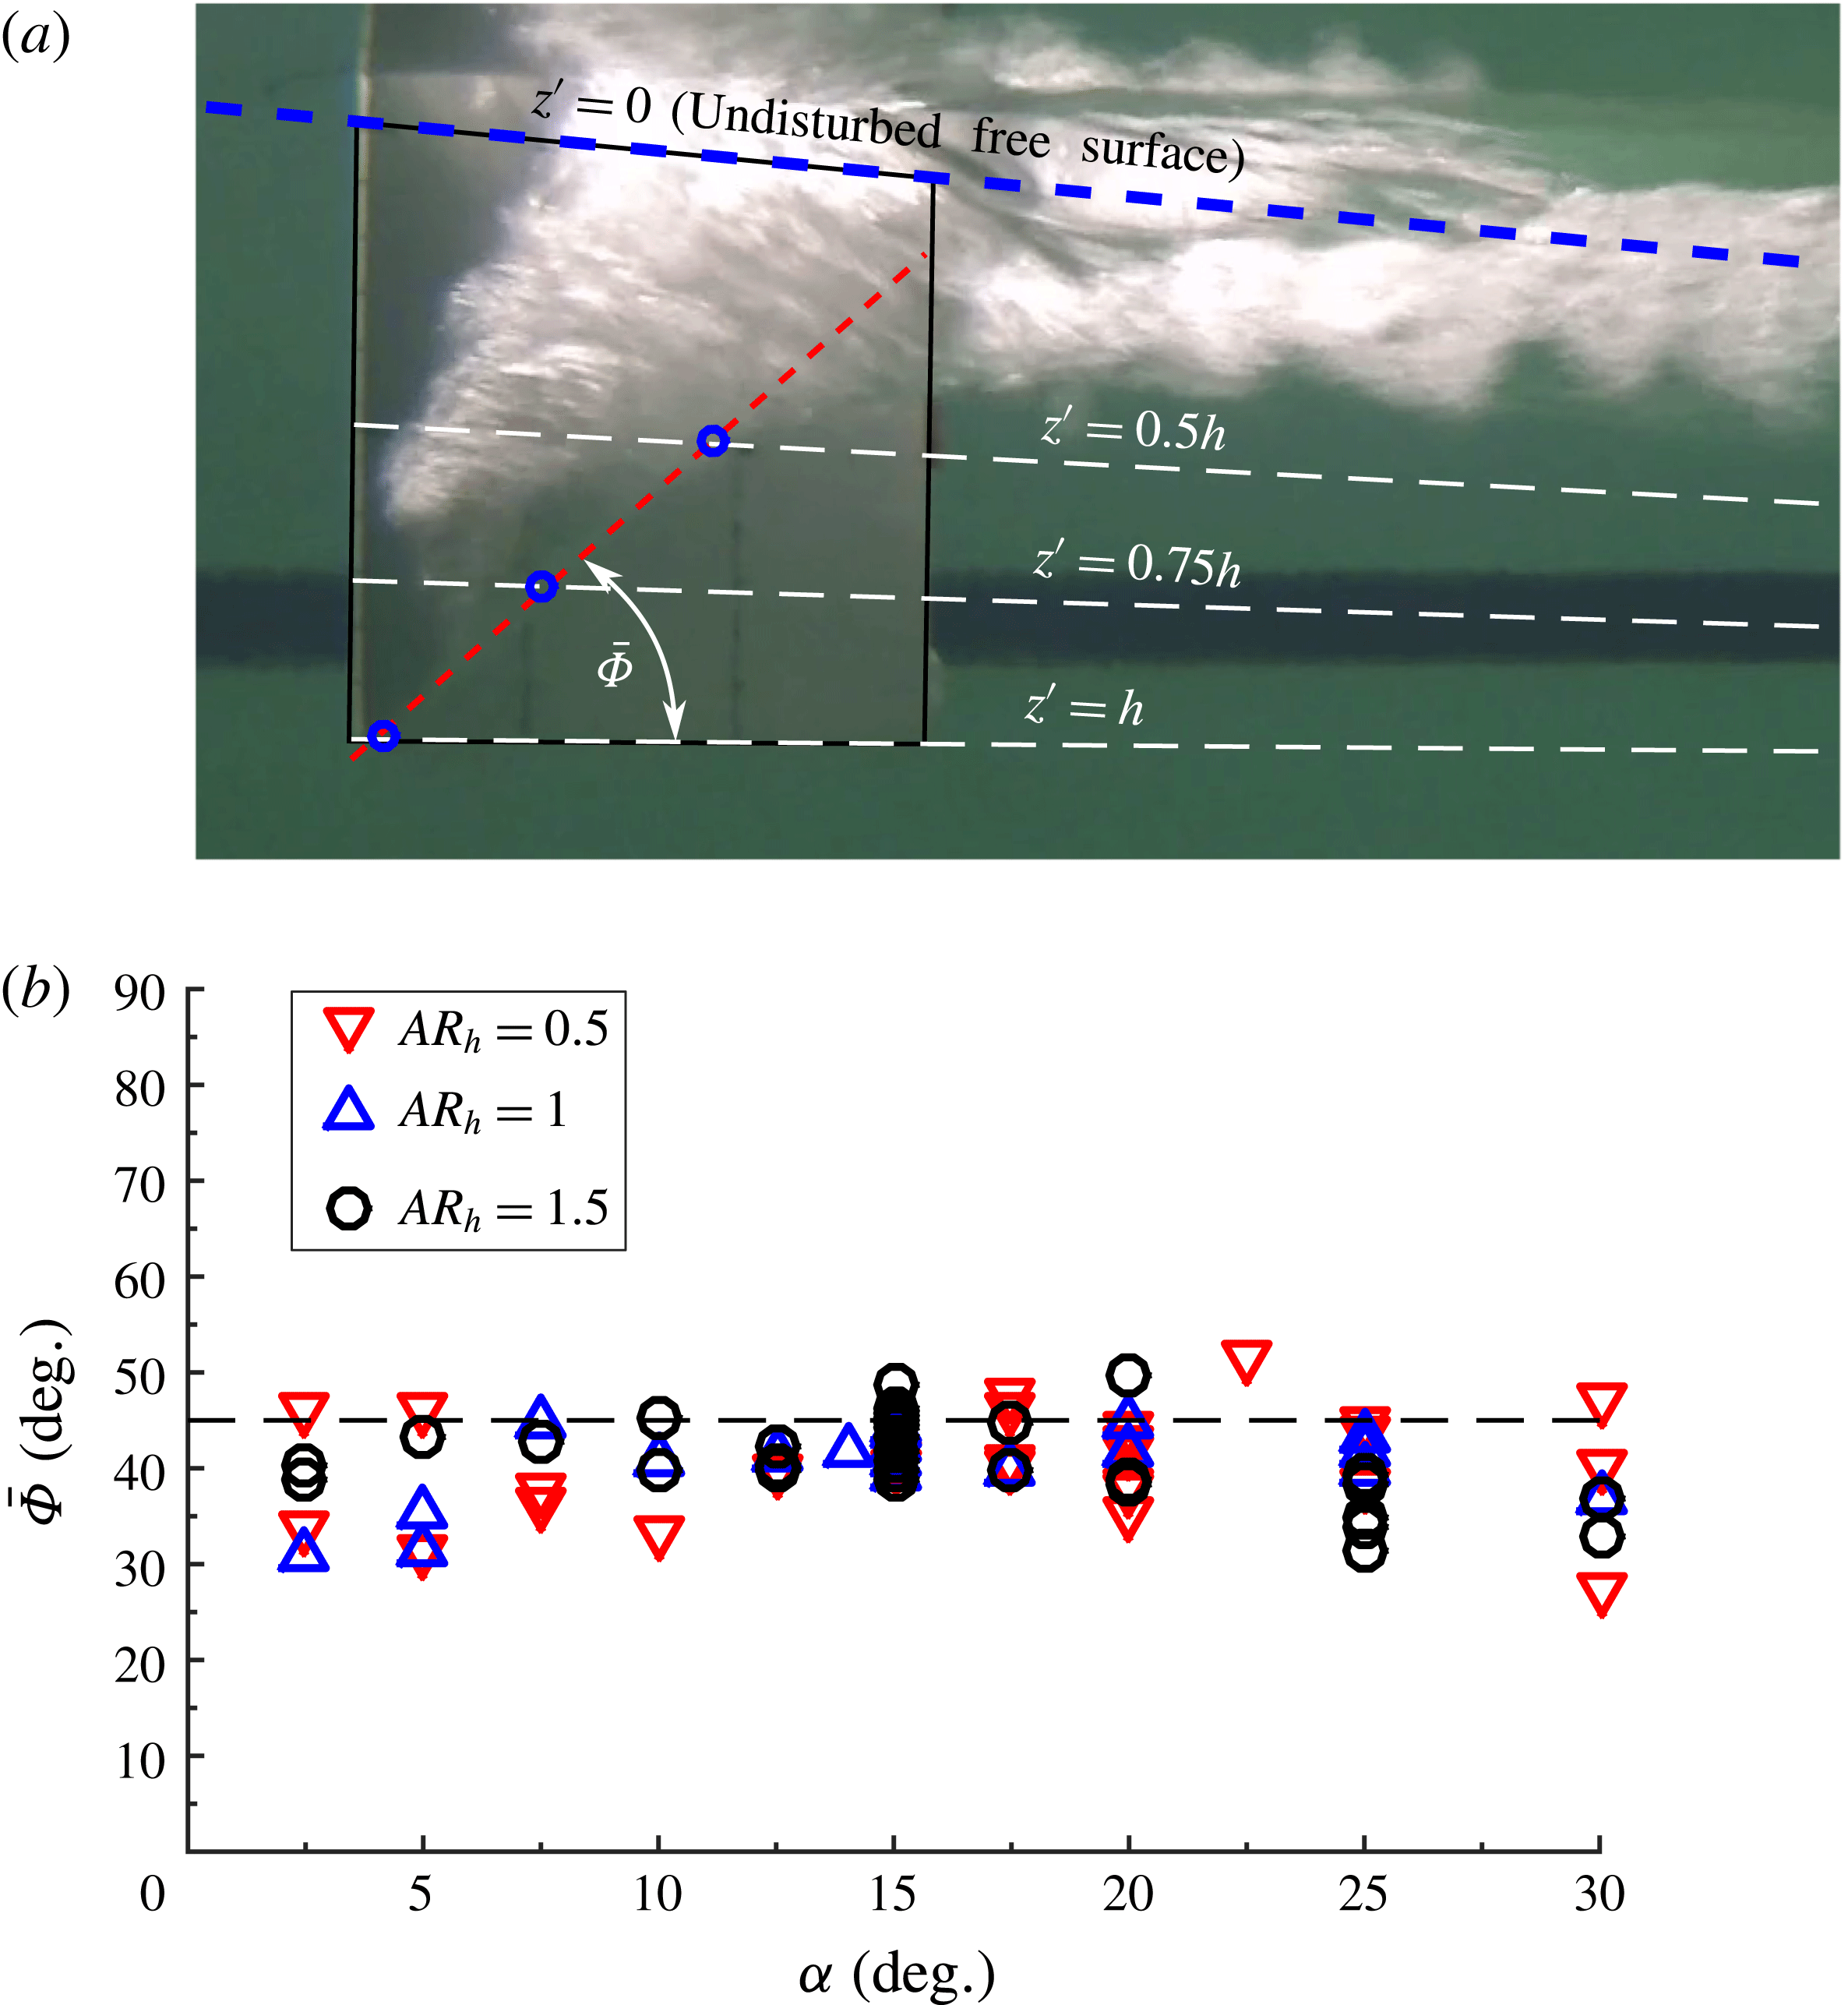
Figure 8. Experimental quantification of cavity closure angles at the point of cavity instability via pinch-off for immersed aspect ratios of
![]() $AR_{h}=0.5$
, 1 and 1.5. The example shown in (a) is at
$AR_{h}=0.5$
, 1 and 1.5. The example shown in (a) is at
![]() $Fn_{h}=1.5$
,
$Fn_{h}=1.5$
,
![]() ${\it\alpha}=20^{\circ }$
,
${\it\alpha}=20^{\circ }$
,
![]() $AR_{h}=1.0$
. Cavity closure line profiles were linearly approximated to find
$AR_{h}=1.0$
. Cavity closure line profiles were linearly approximated to find
![]() $\bar{{\it\Phi}}$
at the instant of cavity instability. (b) Angles of cavity closure lines as a function of and
$\bar{{\it\Phi}}$
at the instant of cavity instability. (b) Angles of cavity closure lines as a function of and
![]() $AR_{h}$
. The mean value of
$AR_{h}$
. The mean value of
![]() $\bar{{\it\Phi}}$
is
$\bar{{\it\Phi}}$
is
![]() $40.75^{\circ }$
and the dashed line corresponds to the proposed stability criterion of
$40.75^{\circ }$
and the dashed line corresponds to the proposed stability criterion of
![]() $45^{\circ }$
.
$45^{\circ }$
.
3.2 Flow-regime criteria
Fully wetted (FW) flow is defined as the regime in which no pronounced entrainment of gas occurs. In the present experiments, a small aerated base cavity was typically observed in the separated wake of the blunt trailing edge. However, the effects of the trailing edge were confined to a relatively small region immediately aft of the trailing edge; neither the flow separation nor the base cavity materially affected the hydrodynamic response of the hydrofoil (Perry Reference Perry1955). An example of FW flow is shown in figure 9. The nominal free surface indicates the initial calm water surface identified by the
![]() $z^{\prime }=0$
plane, where it intersects with the suction surface of the foil. The free-surface profile changes when subjected to the pressure distribution around the hydrofoil, and is termed the ‘deformed’ free surface.
$z^{\prime }=0$
plane, where it intersects with the suction surface of the foil. The free-surface profile changes when subjected to the pressure distribution around the hydrofoil, and is termed the ‘deformed’ free surface.

Figure 9. Fully wetted flow at
![]() ${\it\alpha}=10^{\circ }$
,
${\it\alpha}=10^{\circ }$
,
![]() $Fn_{h}=2$
,
$Fn_{h}=2$
,
![]() $AR_{h}=1.0$
. The FW regime shows no entrainment of air along the suction surface (
$AR_{h}=1.0$
. The FW regime shows no entrainment of air along the suction surface (
![]() $D=0$
, as measured from the nominal free surface). Some base ventilation occurs aft of the blunt trailing edge of the foil.
$D=0$
, as measured from the nominal free surface). Some base ventilation occurs aft of the blunt trailing edge of the foil.
Fully ventilated (FV) flow is defined as the case where a cavity is entrained along the entire immersed span of the hydrofoil suction surface (
![]() $D=h$
, where
$D=h$
, where
![]() $D$
is the maximum depth of the ventilated cavity beneath the nominal free surface), and where no inherently destabilizing re-entrant jet occurs (
$D$
is the maximum depth of the ventilated cavity beneath the nominal free surface), and where no inherently destabilizing re-entrant jet occurs (
![]() $\bar{{\it\Phi}}<45^{\circ }$
). Figure 10 shows an example of a fully ventilated cavity. The suction surface of the hydrofoil (pictured) is enveloped entirely inside a ventilated cavity. The near wall of the cavity detaches from the leading edge of the hydrofoil. The pressure side of the hydrofoil is fully wetted, and flow detaches smoothly from the corner of the pressure side and trailing edge to form the opposing cavity wall. Large spray sheets develop on both sides of the hydrofoil; the lower edge of the suction-side spray sheet is visible in figure 10. It should be noted that the angle of the cavity closure line is very shallow (
$\bar{{\it\Phi}}<45^{\circ }$
). Figure 10 shows an example of a fully ventilated cavity. The suction surface of the hydrofoil (pictured) is enveloped entirely inside a ventilated cavity. The near wall of the cavity detaches from the leading edge of the hydrofoil. The pressure side of the hydrofoil is fully wetted, and flow detaches smoothly from the corner of the pressure side and trailing edge to form the opposing cavity wall. Large spray sheets develop on both sides of the hydrofoil; the lower edge of the suction-side spray sheet is visible in figure 10. It should be noted that the angle of the cavity closure line is very shallow (
![]() $\bar{{\it\Phi}}\ll 45^{\circ }$
). As a result, the streamwise component of any re-entrant flow is directed towards the trailing edge of the hydrofoil, where it presents no detriment to the cavity stability. In figure 10, a strong tip vortex is present, the core of which aerates by ingesting air from the cavity. When the flow is in a fully ventilated state, the blunt trailing edge is contained entirely within the cavity, so it does not interact with the liquid flow. In the case pictured, and in other cases with a sufficiently strong tip vortex, the circumferential flow around the vortex impinges on the near (as pictured) cavity wall, forcing a small jet horizontally across the cavity. The impact of this jet on the far cavity wall causes a vertical jet spray to develop in the ventilated wake.
$\bar{{\it\Phi}}\ll 45^{\circ }$
). As a result, the streamwise component of any re-entrant flow is directed towards the trailing edge of the hydrofoil, where it presents no detriment to the cavity stability. In figure 10, a strong tip vortex is present, the core of which aerates by ingesting air from the cavity. When the flow is in a fully ventilated state, the blunt trailing edge is contained entirely within the cavity, so it does not interact with the liquid flow. In the case pictured, and in other cases with a sufficiently strong tip vortex, the circumferential flow around the vortex impinges on the near (as pictured) cavity wall, forcing a small jet horizontally across the cavity. The impact of this jet on the far cavity wall causes a vertical jet spray to develop in the ventilated wake.

Figure 10. Fully ventilated flow at
![]() ${\it\alpha}=15^{\circ }$
,
${\it\alpha}=15^{\circ }$
,
![]() $Fn_{h}=3.0$
,
$Fn_{h}=3.0$
,
![]() $AR_{h}=1.0$
. The suction surface (pictured) is contained entirely within the walls of the cavity. The cavity satisfies both FV flow criteria (
$AR_{h}=1.0$
. The suction surface (pictured) is contained entirely within the walls of the cavity. The cavity satisfies both FV flow criteria (
![]() $D=h$
and
$D=h$
and
![]() $\bar{{\it\Phi}}\leqslant 45^{\circ }$
). In the case pictured, a strong tip vortex is present, the core of which aerates by ingesting air from the cavity.
$\bar{{\it\Phi}}\leqslant 45^{\circ }$
). In the case pictured, a strong tip vortex is present, the core of which aerates by ingesting air from the cavity.
Partially ventilated (PV) flow is defined as the entrainment of a cavity which either does not span the entire immersed portion of the hydrofoil or does not meet the stability conditions to sustain fully ventilated flow (e.g. a destabilizing re-entrant jet exists). Figure 11 depicts two examples of partial ventilation. The flow in figure 11(a) is designated PV because the cavity does not reach the immersed tip of the hydrofoil (
![]() $D<h$
). In this case, the cavity depth and length are potentially unsteady. The flow pictured in figure 11(b) is so designated because the approximate cavity closure line, shown as a solid line fitted through the cavity closure region, exceeds the
$D<h$
). In this case, the cavity depth and length are potentially unsteady. The flow pictured in figure 11(b) is so designated because the approximate cavity closure line, shown as a solid line fitted through the cavity closure region, exceeds the
![]() $\bar{{\it\Phi}}=45^{\circ }$
stability condition, which is indicated by the dashed white line. As a result, a significant portion of the re-entrant jet is directed towards the leading edge. At small angles of attack, the resulting upstream flow may cause unsteady shedding of bubbly structures in a region confined to the trailing edge of the cavity, while at larger angles of attack, the jet destabilizes the entire cavity by impinging on the cavity interface and leading to pinch-off. In either case, the increased unsteadiness and decreased stability of the flow when
$\bar{{\it\Phi}}=45^{\circ }$
stability condition, which is indicated by the dashed white line. As a result, a significant portion of the re-entrant jet is directed towards the leading edge. At small angles of attack, the resulting upstream flow may cause unsteady shedding of bubbly structures in a region confined to the trailing edge of the cavity, while at larger angles of attack, the jet destabilizes the entire cavity by impinging on the cavity interface and leading to pinch-off. In either case, the increased unsteadiness and decreased stability of the flow when
![]() $\bar{{\it\Phi}}\geqslant 45^{\circ }$
serve to distinguish it from FV flow.
$\bar{{\it\Phi}}\geqslant 45^{\circ }$
serve to distinguish it from FV flow.

Figure 11. Partially ventilated flow, with (a)
![]() ${\it\alpha}=20^{\circ }$
,
${\it\alpha}=20^{\circ }$
,
![]() $Fn_{h}=1.0$
,
$Fn_{h}=1.0$
,
![]() $AR_{h}=1.0$
; (b)
$AR_{h}=1.0$
; (b)
![]() ${\it\alpha}=7.5^{\circ }$
,
${\it\alpha}=7.5^{\circ }$
,
![]() $Fn_{h}=1.54$
,
$Fn_{h}=1.54$
,
![]() $AR_{h}=1.0$
. (a) The case where the cavity does not reach the free tip (
$AR_{h}=1.0$
. (a) The case where the cavity does not reach the free tip (
![]() $0<D<h$
). (b) The case where the cavity reaches the free tip (
$0<D<h$
). (b) The case where the cavity reaches the free tip (
![]() $D=h$
), but the angle of the solid line fitted through the cavity closure region is greater than the critical angle (
$D=h$
), but the angle of the solid line fitted through the cavity closure region is greater than the critical angle (
![]() $\bar{{\it\Phi}}=45^{\circ }$
, shown as a dashed white line).
$\bar{{\it\Phi}}=45^{\circ }$
, shown as a dashed white line).
The criteria for the three flow regimes may be summarized as follows:
-
 $D=0,\quad \text{fully wetted (FW) flow}$
;
 -
 $D=h\quad \text{and}\quad \bar{{\it\Phi}}<45^{\circ },\quad \text{fully ventilated (FV) flow}$
;
 -
 $0<D<h\quad \text{or}\quad \bar{{\it\Phi}}\geqslant 45^{\circ },\quad \text{partially ventilated (PV) flow}$
.
Here,
![]() $D$
is the depth of a ventilated cavity, measured from the free surface, and
$D$
is the depth of a ventilated cavity, measured from the free surface, and
![]() $\bar{{\it\Phi}}$
is the approximate angle of the cavity closure line.
$\bar{{\it\Phi}}$
is the approximate angle of the cavity closure line.
3.3 Ventilation and hydrodynamic loading
When ventilation occurs, most or all of a lifting-surface suction surface becomes encapsulated in a cavity. The pressure inside the cavity after ventilation occurs is, by necessity, higher than the local absolute pressure in the prior wetted flow. Suction pressures along the portions of the hydrofoil within the cavity are thus strongly attenuated. As a result, ventilation can induce dramatic reductions in realizable lift, as observed by Breslin & Skalak (Reference Breslin and Skalak1959), Rothblum et al. (Reference Rothblum, Mayer and Wilburn1969) and Swales et al. (Reference Swales, Wright, McGregor and Rothblum1974). The 3D lift, drag and yawing moment coefficients are defined as
Figure 12 shows
![]() $C_{L}$
in the FW and FV flow regimes; a distinctive grouping of the data into the two regimes is evident. The PV data are omitted for clarity, but may be found in appendix A. The lift in the FV regime is significantly lower than that in the FW regime, and the difference in lift between the two regimes tends to increase with increasing
$C_{L}$
in the FW and FV flow regimes; a distinctive grouping of the data into the two regimes is evident. The PV data are omitted for clarity, but may be found in appendix A. The lift in the FV regime is significantly lower than that in the FW regime, and the difference in lift between the two regimes tends to increase with increasing
![]() ${\it\alpha}$
. It should be noted that a line fitted to the FV data will have an apparent non-zero intercept because the profile of the foil pressure surface and the streamline bounding the cavity together present to the flow a cambered lifting surface (Breslin & Skalak Reference Breslin and Skalak1959).
${\it\alpha}$
. It should be noted that a line fitted to the FV data will have an apparent non-zero intercept because the profile of the foil pressure surface and the streamline bounding the cavity together present to the flow a cambered lifting surface (Breslin & Skalak Reference Breslin and Skalak1959).
The nonlinear lifting-line model from § 1.2 was also used to approximate the lift. In the FV regime, the root-finding approach of § 1.2.2 was used to resolve the distributions of
![]() $L_{c}/c$
,
$L_{c}/c$
,
![]() $a_{0}$
,
$a_{0}$
,
![]() ${\it\alpha}_{2D}$
and
${\it\alpha}_{2D}$
and
![]() $C_{l_{2D}}$
iteratively. In the FW regime, equation (1.7) was replaced with
$C_{l_{2D}}$
iteratively. In the FW regime, equation (1.7) was replaced with
![]() $L_{c}/c=0$
and (1.9) was replaced with
$L_{c}/c=0$
and (1.9) was replaced with
![]() $a_{0}=2{\rm\pi}$
. In both regimes, the lifting-line model correctly captures the trends of the experimental measurements.
$a_{0}=2{\rm\pi}$
. In both regimes, the lifting-line model correctly captures the trends of the experimental measurements.
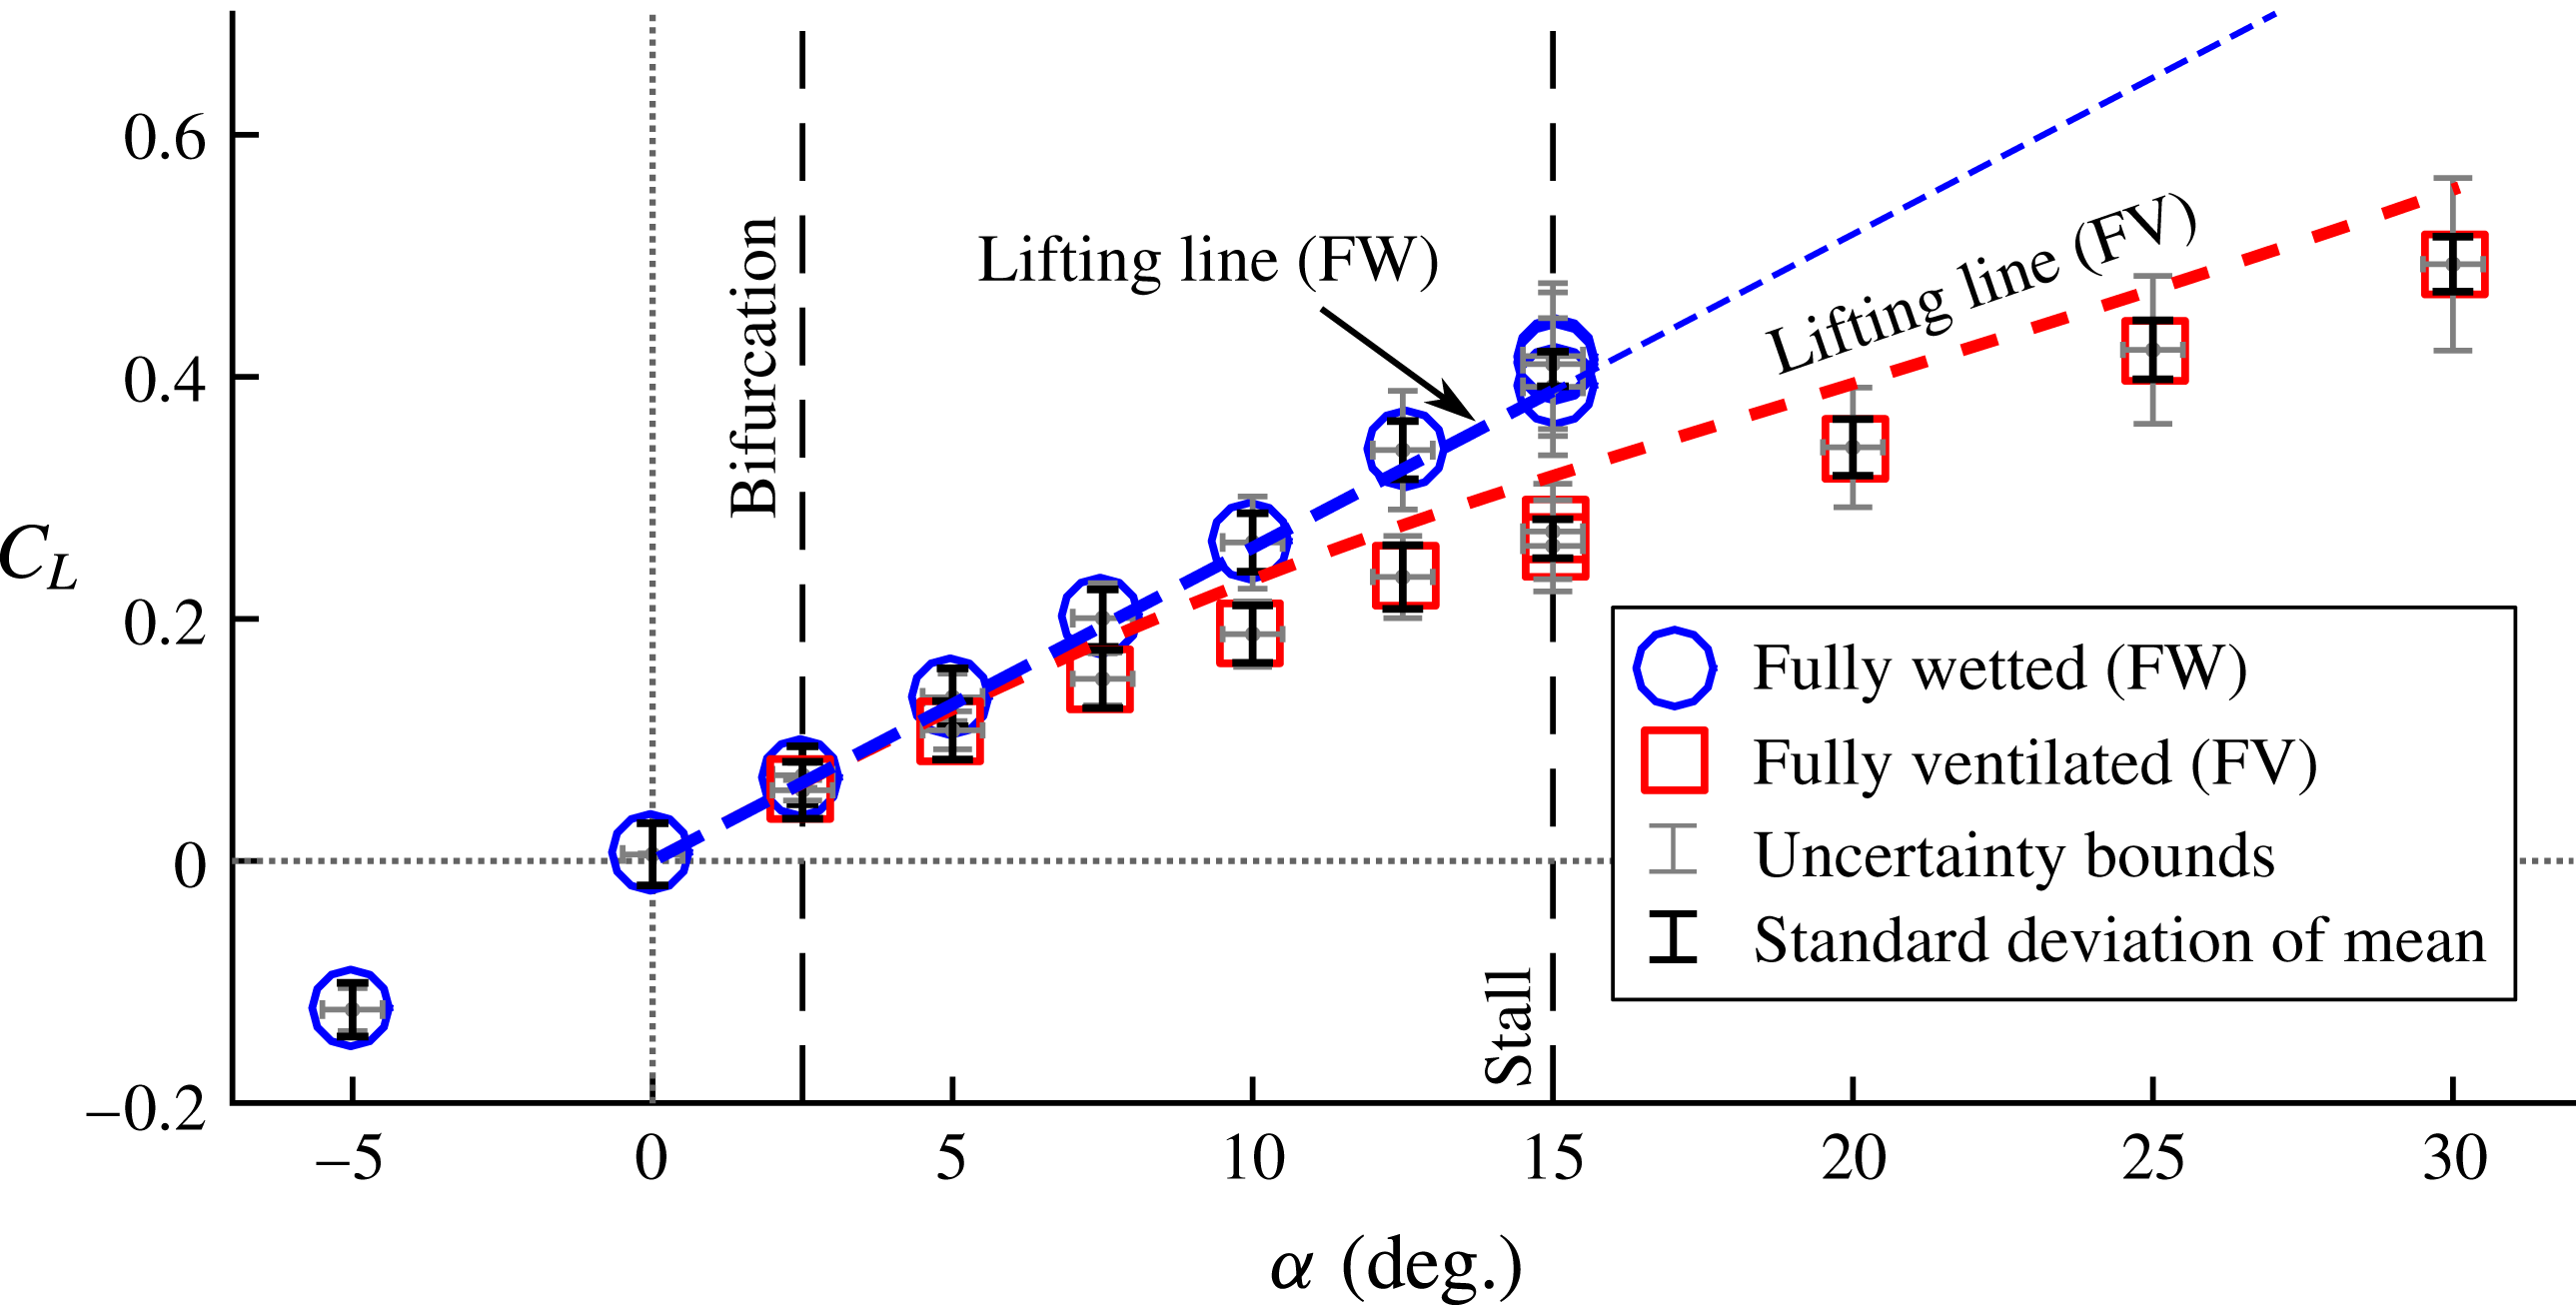
Figure 12. The 3D lift coefficient as a function of
![]() ${\it\alpha}$
at
${\it\alpha}$
at
![]() $Fn_{h}=2.5$
and
$Fn_{h}=2.5$
and
![]() $AR_{h}=1.0$
. Propagated uncertainties from table 3 are shown as grey bars. Black bars are used to denote the standard deviation of
$AR_{h}=1.0$
. Propagated uncertainties from table 3 are shown as grey bars. Black bars are used to denote the standard deviation of
![]() $C_{L}$
within the respective steady-state time window. Where duplicate points exist, the black bars correspond to the standard deviation of the estimate of the mean
$C_{L}$
within the respective steady-state time window. Where duplicate points exist, the black bars correspond to the standard deviation of the estimate of the mean
![]() $C_{L}$
. Between the bifurcation angle (
$C_{L}$
. Between the bifurcation angle (
![]() ${\it\alpha}_{b}$
) and the stall angle (
${\it\alpha}_{b}$
) and the stall angle (
![]() ${\it\alpha}_{s}$
), both wetted and ventilated flow regimes were observed, signalling a bi-stable range of
${\it\alpha}_{s}$
), both wetted and ventilated flow regimes were observed, signalling a bi-stable range of
![]() ${\it\alpha}$
. The nonlinear lifting-line model calculations are also shown, with thin lines used to indicate predictions outside the experimentally observed ranges of
${\it\alpha}$
. The nonlinear lifting-line model calculations are also shown, with thin lines used to indicate predictions outside the experimentally observed ranges of
![]() ${\it\alpha}$
.
${\it\alpha}$
.

Figure 13. The 3D drag coefficients as a function of
![]() ${\it\alpha}$
at
${\it\alpha}$
at
![]() $Fn_{h}=2.5$
and
$Fn_{h}=2.5$
and
![]() $AR_{h}=1.0$
. Both regimes exhibit a classical quadratic variation of
$AR_{h}=1.0$
. Both regimes exhibit a classical quadratic variation of
![]() $C_{D}$
with
$C_{D}$
with
![]() ${\it\alpha}$
. The drag coefficients are nearly continuous between the two regimes. The results of the lifting-line model include induced and frictional drag only, suggesting that the increased profile drag and spray drag of the cavity roughly negate the reduction in frictional and induced drag.
${\it\alpha}$
. The drag coefficients are nearly continuous between the two regimes. The results of the lifting-line model include induced and frictional drag only, suggesting that the increased profile drag and spray drag of the cavity roughly negate the reduction in frictional and induced drag.
The drag coefficients are shown in figure 13. The dashed lines indicate the summed frictional and lift-induced drag coefficients from the lifting-line model. The skin friction coefficient was estimated via the ITTC 1957 correlation line (Larsson & Raven Reference Larsson, Raven and Paulling2010) to be
![]() $C_{D_{f}}=0.0047$
at the conditions in figure 13. The skin friction was integrated over both surfaces of the foil in the FW regime and over the pressure surface only in the FV regime. Breslin & Skalak (Reference Breslin and Skalak1959) posited that, for certain geometries, a ventilated cavity yields an increased profile drag that roughly offsets the reduction in skin friction and induced drag. The frictional drag represents only a very minor contribution to the total drag in both regimes, so the near continuity of the measured total drag between the FW and FV flow regimes implies that any changes in the remaining components of drag (induced drag, profile drag, spray drag, etc.) approximately negate one another. The significant reduction in the induced drag predicted by the lifting-line model is caused by the previously noted decrease in lift, and suggests that those drag components not captured by the lifting-line model, namely profile and spray drag, are substantially increased by the formation of a ventilated cavity.
$C_{D_{f}}=0.0047$
at the conditions in figure 13. The skin friction was integrated over both surfaces of the foil in the FW regime and over the pressure surface only in the FV regime. Breslin & Skalak (Reference Breslin and Skalak1959) posited that, for certain geometries, a ventilated cavity yields an increased profile drag that roughly offsets the reduction in skin friction and induced drag. The frictional drag represents only a very minor contribution to the total drag in both regimes, so the near continuity of the measured total drag between the FW and FV flow regimes implies that any changes in the remaining components of drag (induced drag, profile drag, spray drag, etc.) approximately negate one another. The significant reduction in the induced drag predicted by the lifting-line model is caused by the previously noted decrease in lift, and suggests that those drag components not captured by the lifting-line model, namely profile and spray drag, are substantially increased by the formation of a ventilated cavity.
The yawing moment coefficient,
![]() $C_{M}$
, measured about mid-chord, is shown in figure 14. The FW data follow a roughly linear trend, except near the stall boundary, where a reduction in the yawing moment indicates impending stall and an accompanying shift in the centre of pressure towards the mid-chord. The FV data exhibit a significant reduction in
$C_{M}$
, measured about mid-chord, is shown in figure 14. The FW data follow a roughly linear trend, except near the stall boundary, where a reduction in the yawing moment indicates impending stall and an accompanying shift in the centre of pressure towards the mid-chord. The FV data exhibit a significant reduction in
![]() $C_{M}$
, compared with the wetted data. This is partly due to the reduction in
$C_{M}$
, compared with the wetted data. This is partly due to the reduction in
![]() $C_{L}$
shown in figure 12, and is compounded by the movement of the centre of pressure towards the mid-chord, resulting in a sub-linear trend in
$C_{L}$
shown in figure 12, and is compounded by the movement of the centre of pressure towards the mid-chord, resulting in a sub-linear trend in
![]() $C_{M}$
with respect to changing
$C_{M}$
with respect to changing
![]() ${\it\alpha}$
. The lifting-line code was used to approximate the yawing moment, also shown in figure 14. The dimensionless location of the centre of pressure for FW sections is estimated to be
${\it\alpha}$
. The lifting-line code was used to approximate the yawing moment, also shown in figure 14. The dimensionless location of the centre of pressure for FW sections is estimated to be
![]() $e_{FW}=x_{cp}/c=1/4$
, where
$e_{FW}=x_{cp}/c=1/4$
, where
![]() $x_{cp}$
is the location of the centre of pressure forward of mid-chord. For supercavitating sections,
$x_{cp}$
is the location of the centre of pressure forward of mid-chord. For supercavitating sections,
![]() $e_{SC}=3/16$
(Akcabay & Young Reference Akcabay and Young2014). A sigmoid function was used to smoothly interpolate between the bounding values as a function of sectional cavity length,
$e_{SC}=3/16$
(Akcabay & Young Reference Akcabay and Young2014). A sigmoid function was used to smoothly interpolate between the bounding values as a function of sectional cavity length,
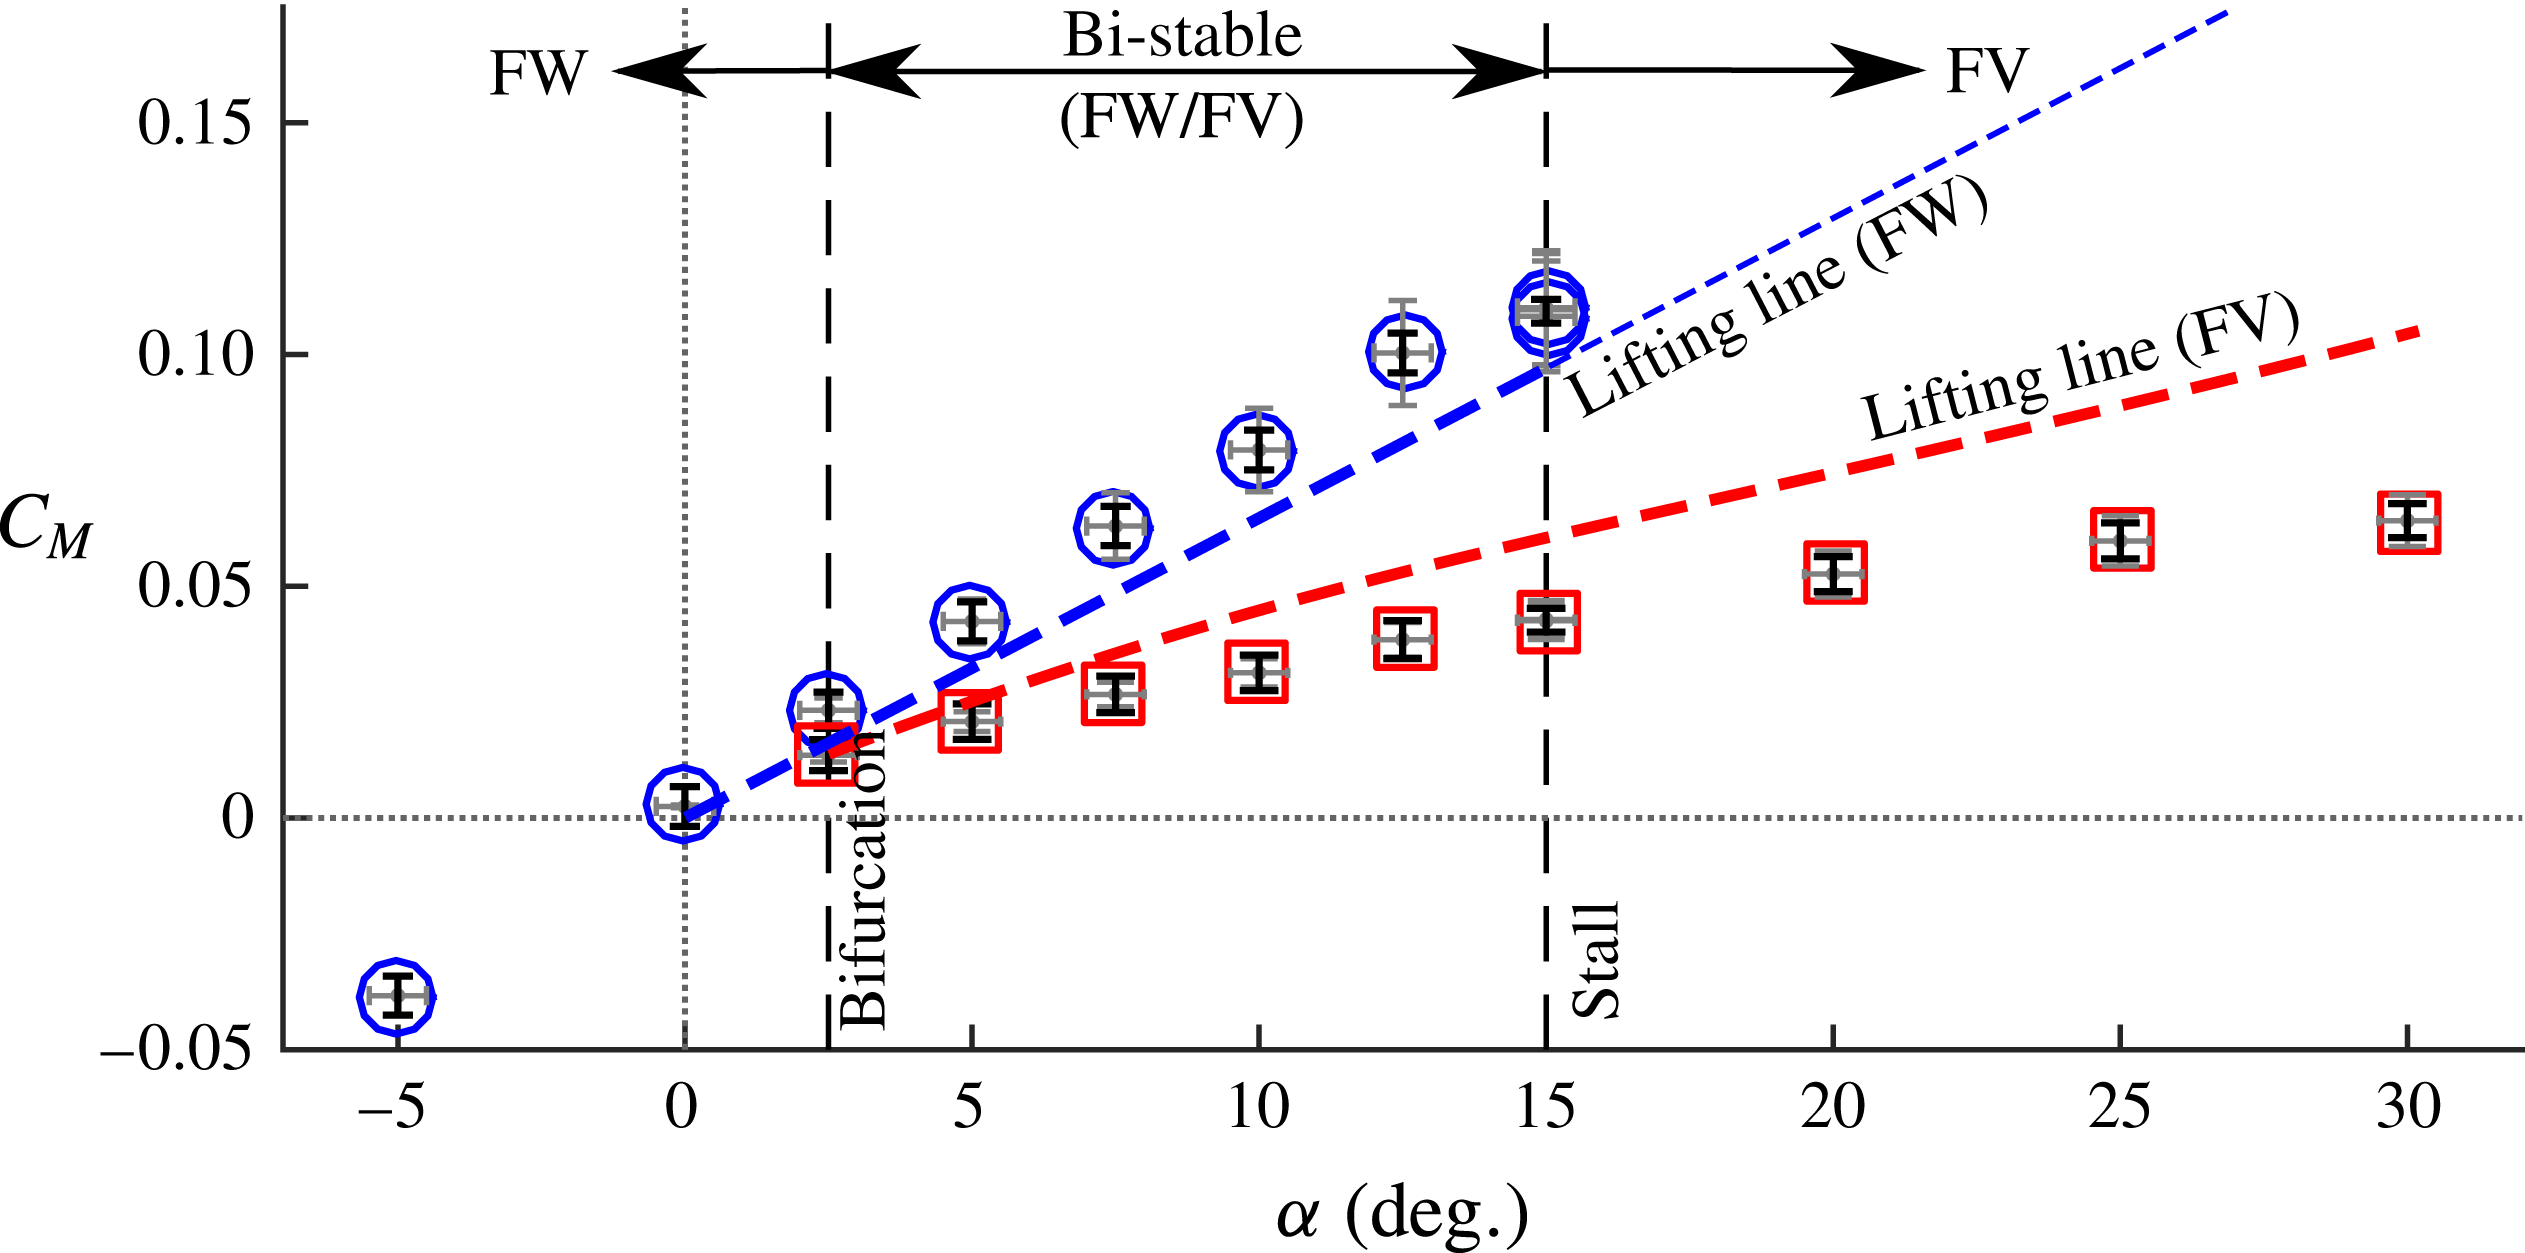
Figure 14. The 3D yawing moment coefficient as a function of
![]() ${\it\alpha}$
at
${\it\alpha}$
at
![]() $Fn_{h}=2.5$
and
$Fn_{h}=2.5$
and
![]() $AR_{h}=1.0$
. The yawing moment is defined about mid-chord. It is strongly reduced in ventilated flow, indicating that the centre of pressure moves towards the mid-chord as the suction surface becomes aerated. The lifting-line model, in concert with (3.4), was used to estimate
$AR_{h}=1.0$
. The yawing moment is defined about mid-chord. It is strongly reduced in ventilated flow, indicating that the centre of pressure moves towards the mid-chord as the suction surface becomes aerated. The lifting-line model, in concert with (3.4), was used to estimate
![]() $C_{M}$
, plotted as dashed lines. The relatively good agreement suggests that the combined reductions in lift and shift in the centre of pressure together adequately describe the trend in
$C_{M}$
, plotted as dashed lines. The relatively good agreement suggests that the combined reductions in lift and shift in the centre of pressure together adequately describe the trend in
![]() $C_{M}$
.
$C_{M}$
.

Figure 15. The
![]() $C_{L}$
surface as a function of
$C_{L}$
surface as a function of
![]() ${\it\alpha}$
and
${\it\alpha}$
and
![]() $Fn_{h}$
for
$Fn_{h}$
for
![]() $AR_{h}=1$
. Contours of constant
$AR_{h}=1$
. Contours of constant
![]() $C_{L}$
are shown as solid lines in the FW and FV regimes (the PV surface and contours are omitted for clarity). It is a strong function of
$C_{L}$
are shown as solid lines in the FW and FV regimes (the PV surface and contours are omitted for clarity). It is a strong function of
![]() $Fn_{h}$
in the FV regime, where for a fixed
$Fn_{h}$
in the FV regime, where for a fixed
![]() ${\it\alpha}$
,
${\it\alpha}$
,
![]() $C_{L}$
decreases as
$C_{L}$
decreases as
![]() $Fn_{h}$
increases. At low speeds (
$Fn_{h}$
increases. At low speeds (
![]() $Fn_{h}\leqslant 1$
), laminar separation occurs at the accompanying low Reynolds numbers (
$Fn_{h}\leqslant 1$
), laminar separation occurs at the accompanying low Reynolds numbers (
![]() $\mathit{Re}_{c}\leqslant 5\times 10^{5}$
), causing an increase in
$\mathit{Re}_{c}\leqslant 5\times 10^{5}$
), causing an increase in
![]() $C_{L}$
in the FW regimes. Affine fits of
$C_{L}$
in the FW regimes. Affine fits of
![]() $C_{L}$
as a function of
$C_{L}$
as a function of
![]() ${\it\alpha}$
are shown as dotted lines at each
${\it\alpha}$
are shown as dotted lines at each
![]() $Fn_{h}$
, with the intersection between the FW and FV fits indicated by cross-hatched circles. The dashed lines are orthographic projections of the locus of intersection points onto the
$Fn_{h}$
, with the intersection between the FW and FV fits indicated by cross-hatched circles. The dashed lines are orthographic projections of the locus of intersection points onto the
![]() ${\it\alpha}$
–
${\it\alpha}$
–
![]() $Fn_{h}$
plane and the
$Fn_{h}$
plane and the
![]() $Fn_{h}$
–
$Fn_{h}$
–
![]() $C_{L}$
plane. A heavy solid line indicates the locus of bifurcation angles (
$C_{L}$
plane. A heavy solid line indicates the locus of bifurcation angles (
![]() ${\it\alpha}_{b}$
), forming a bifurcation boundary, below which only FW flow was observed.
${\it\alpha}_{b}$
), forming a bifurcation boundary, below which only FW flow was observed.
The effect of Froude number is also of interest. In figure 15,
![]() $C_{L}$
is plotted as a function of
$C_{L}$
is plotted as a function of
![]() ${\it\alpha}$
at values of
${\it\alpha}$
at values of
![]() $Fn_{h}$
between 0.5 and 3.5, forming surfaces representing the FW and FV regimes. Two-dimensional plots of hydrodynamic load coefficients with varying Froude number may be found in figures 31–33 in appendix A. In the FW regime, the
$Fn_{h}$
between 0.5 and 3.5, forming surfaces representing the FW and FV regimes. Two-dimensional plots of hydrodynamic load coefficients with varying Froude number may be found in figures 31–33 in appendix A. In the FW regime, the
![]() $C_{L}$
contours are parallel to the
$C_{L}$
contours are parallel to the
![]() $Fn_{h}$
axis for
$Fn_{h}$
axis for
![]() $Fn_{h}>1$
, indicating that
$Fn_{h}>1$
, indicating that
![]() $C_{L}$
is speed-dependent only at very low speeds. For
$C_{L}$
is speed-dependent only at very low speeds. For
![]() $Fn_{h}\leqslant 1$
, the Reynolds numbers are low (
$Fn_{h}\leqslant 1$
, the Reynolds numbers are low (
![]() $\mathit{Re}_{c}\leqslant 5\times 10^{5}$
), resulting in leading edge laminar separation, which in turn causes a characteristic increase in lift (Breslin & Skalak Reference Breslin and Skalak1959). In the fully ventilated regime, lift monotonically decreases with increasing Froude number at a fixed angle of attack, made apparent by the curvature of the
$\mathit{Re}_{c}\leqslant 5\times 10^{5}$
), resulting in leading edge laminar separation, which in turn causes a characteristic increase in lift (Breslin & Skalak Reference Breslin and Skalak1959). In the fully ventilated regime, lift monotonically decreases with increasing Froude number at a fixed angle of attack, made apparent by the curvature of the
![]() $C_{L}$
contours in the FV regime. This behaviour is due in part to longer cavity lengths at each section along the span (caused by the reduction in sectional
$C_{L}$
contours in the FV regime. This behaviour is due in part to longer cavity lengths at each section along the span (caused by the reduction in sectional
![]() ${\it\sigma}_{c}$
at high Froude numbers), which lead to reduced lift coefficients (see figure 2
b). Additionally, longer sectional cavity lengths present a smaller amount of apparent camber to the flow, causing further reduction in the sectional values of
${\it\sigma}_{c}$
at high Froude numbers), which lead to reduced lift coefficients (see figure 2
b). Additionally, longer sectional cavity lengths present a smaller amount of apparent camber to the flow, causing further reduction in the sectional values of
![]() $C_{l_{2D}}$
. Affine curve fits through the
$C_{l_{2D}}$
. Affine curve fits through the
![]() $C_{L}$
values in the FW and FV flow regimes with respect to
$C_{L}$
values in the FW and FV flow regimes with respect to
![]() ${\it\alpha}$
are shown as dotted lines. Cross-hatched circular markers indicate the intersection between the FW and FV affine data fits at each respective value of
${\it\alpha}$
are shown as dotted lines. Cross-hatched circular markers indicate the intersection between the FW and FV affine data fits at each respective value of
![]() $Fn_{h}$
. The dependence of
$Fn_{h}$
. The dependence of
![]() $C_{L}$
upon
$C_{L}$
upon
![]() $Fn_{h}$
in the FV regime leads to intersection points at increasingly large angles of attack as the Froude number is decreased. Orthographic projections of this locus are made onto the
$Fn_{h}$
in the FV regime leads to intersection points at increasingly large angles of attack as the Froude number is decreased. Orthographic projections of this locus are made onto the
![]() ${\it\alpha}$
–
${\it\alpha}$
–
![]() $Fn_{h}$
and
$Fn_{h}$
and
![]() $Fn_{h}$
–
$Fn_{h}$
–
![]() $C_{L}$
planes and are shown as black dashed lines in figure 15. It should also be noted that, while not shown in figure 15 to avoid overcrowding, the nonlinear lifting line correctly represents the qualitative behaviour of
$C_{L}$
planes and are shown as black dashed lines in figure 15. It should also be noted that, while not shown in figure 15 to avoid overcrowding, the nonlinear lifting line correctly represents the qualitative behaviour of
![]() $C_{L}$
with changing
$C_{L}$
with changing
![]() $Fn_{h}$
. The model results do not yield a good qualitative match to experimental measurements across the entire
$Fn_{h}$
. The model results do not yield a good qualitative match to experimental measurements across the entire
![]() $Fn_{h}$
domain – thought to be because effects such as the apparent camber are not modelled – but the decrease in
$Fn_{h}$
domain – thought to be because effects such as the apparent camber are not modelled – but the decrease in
![]() $C_{L}$
with increasing
$C_{L}$
with increasing
![]() $Fn_{h}$
in the FV regime is present.
$Fn_{h}$
in the FV regime is present.
Partially ventilated data are also present in figure 15; however, the
![]() $C_{L}$
contours and surface fit are omitted for the PV regime to avoid overcrowding. It should be recalled that the bifurcation angle (
$C_{L}$
contours and surface fit are omitted for the PV regime to avoid overcrowding. It should be recalled that the bifurcation angle (
![]() ${\it\alpha}_{b}$
) was shown in figure 12 to be
${\it\alpha}_{b}$
) was shown in figure 12 to be
![]() ${\it\alpha}_{b}\approx 2.5^{\circ }$
at
${\it\alpha}_{b}\approx 2.5^{\circ }$
at
![]() $Fn_{h}=2.5$
and
$Fn_{h}=2.5$
and
![]() $AR_{h}=1.0$
. With the inclusion of PV data, the meaning of the bifurcation angle may be further clarified. The bifurcation angle is defined for a given Froude number as the angle below which FW flow was the sole flow regime observed during experiments. In figure 15, the bifurcation angles form a ‘bifurcation boundary’, shown as a solid black line. The bifurcation boundary takes on a value of
$AR_{h}=1.0$
. With the inclusion of PV data, the meaning of the bifurcation angle may be further clarified. The bifurcation angle is defined for a given Froude number as the angle below which FW flow was the sole flow regime observed during experiments. In figure 15, the bifurcation angles form a ‘bifurcation boundary’, shown as a solid black line. The bifurcation boundary takes on a value of
![]() ${\it\alpha}_{b}\approx 2.5^{\circ }$
at
${\it\alpha}_{b}\approx 2.5^{\circ }$
at
![]() $Fn_{h}\geqslant 2$
, and increases along the
$Fn_{h}\geqslant 2$
, and increases along the
![]() ${\it\alpha}$
-axis with decreasing values of
${\it\alpha}$
-axis with decreasing values of
![]() $Fn_{h}$
for
$Fn_{h}$
for
![]() $Fn_{h}<2$
. In the neighbourhood of
$Fn_{h}<2$
. In the neighbourhood of
![]() ${\it\alpha}_{b}$
, values of
${\it\alpha}_{b}$
, values of
![]() $C_{L}$
in the FW, FV and (where applicable) PV regimes are nearly coincident. This observation suggests that the suction-surface pressures of the wetted flow near
$C_{L}$
in the FW, FV and (where applicable) PV regimes are nearly coincident. This observation suggests that the suction-surface pressures of the wetted flow near
![]() ${\it\alpha}_{b}$
are only mildly sub-atmospheric, so that ventilation formation does not materially affect the magnitude of suction-surface pressures. Reinforcing this hypothesis, the intersection of the affine curve fits approximates the bifurcation angle (
${\it\alpha}_{b}$
are only mildly sub-atmospheric, so that ventilation formation does not materially affect the magnitude of suction-surface pressures. Reinforcing this hypothesis, the intersection of the affine curve fits approximates the bifurcation angle (
![]() ${\it\alpha}_{b}$
) at each value of
${\it\alpha}_{b}$
) at each value of
![]() $Fn_{h}$
.
$Fn_{h}$
.
The bifurcation is so named because above
![]() ${\it\alpha}_{b}$
, other alternate flow regimes become stable, forming characteristic branches in the plots of stable hydrodynamic load coefficients. The other critical angle is the stall angle (
${\it\alpha}_{b}$
, other alternate flow regimes become stable, forming characteristic branches in the plots of stable hydrodynamic load coefficients. The other critical angle is the stall angle (
![]() ${\it\alpha}_{s}$
), above which FW flow was never observed, and so named because large eddies were observed in the wake of the foil at
${\it\alpha}_{s}$
), above which FW flow was never observed, and so named because large eddies were observed in the wake of the foil at
![]() ${\it\alpha}>{\it\alpha}_{s}$
, indicating massive flow separation. For the present foil and for
${\it\alpha}>{\it\alpha}_{s}$
, indicating massive flow separation. For the present foil and for
![]() $AR_{h}=1$
, stall was observed at approximately
$AR_{h}=1$
, stall was observed at approximately
![]() ${\it\alpha}_{s}=14^{\circ }{-}15^{\circ }$
for all values of
${\it\alpha}_{s}=14^{\circ }{-}15^{\circ }$
for all values of
![]() $Fn_{h}$
tested. Smaller values of
$Fn_{h}$
tested. Smaller values of
![]() $AR_{h}$
were observed to increase the stall angle slightly (see appendix A). A range of bi-stable flow conditions exists for
$AR_{h}$
were observed to increase the stall angle slightly (see appendix A). A range of bi-stable flow conditions exists for
![]() ${\it\alpha}_{b}\leqslant {\it\alpha}\leqslant {\it\alpha}_{s}$
in figures 12–14, as well as in the overlap of the FW and FV surfaces in figure 15. Under such conditions, stable FW flow overlaps with PV or FV flow, and the flow can take on alternate stable configurations.
${\it\alpha}_{b}\leqslant {\it\alpha}\leqslant {\it\alpha}_{s}$
in figures 12–14, as well as in the overlap of the FW and FV surfaces in figure 15. Under such conditions, stable FW flow overlaps with PV or FV flow, and the flow can take on alternate stable configurations.
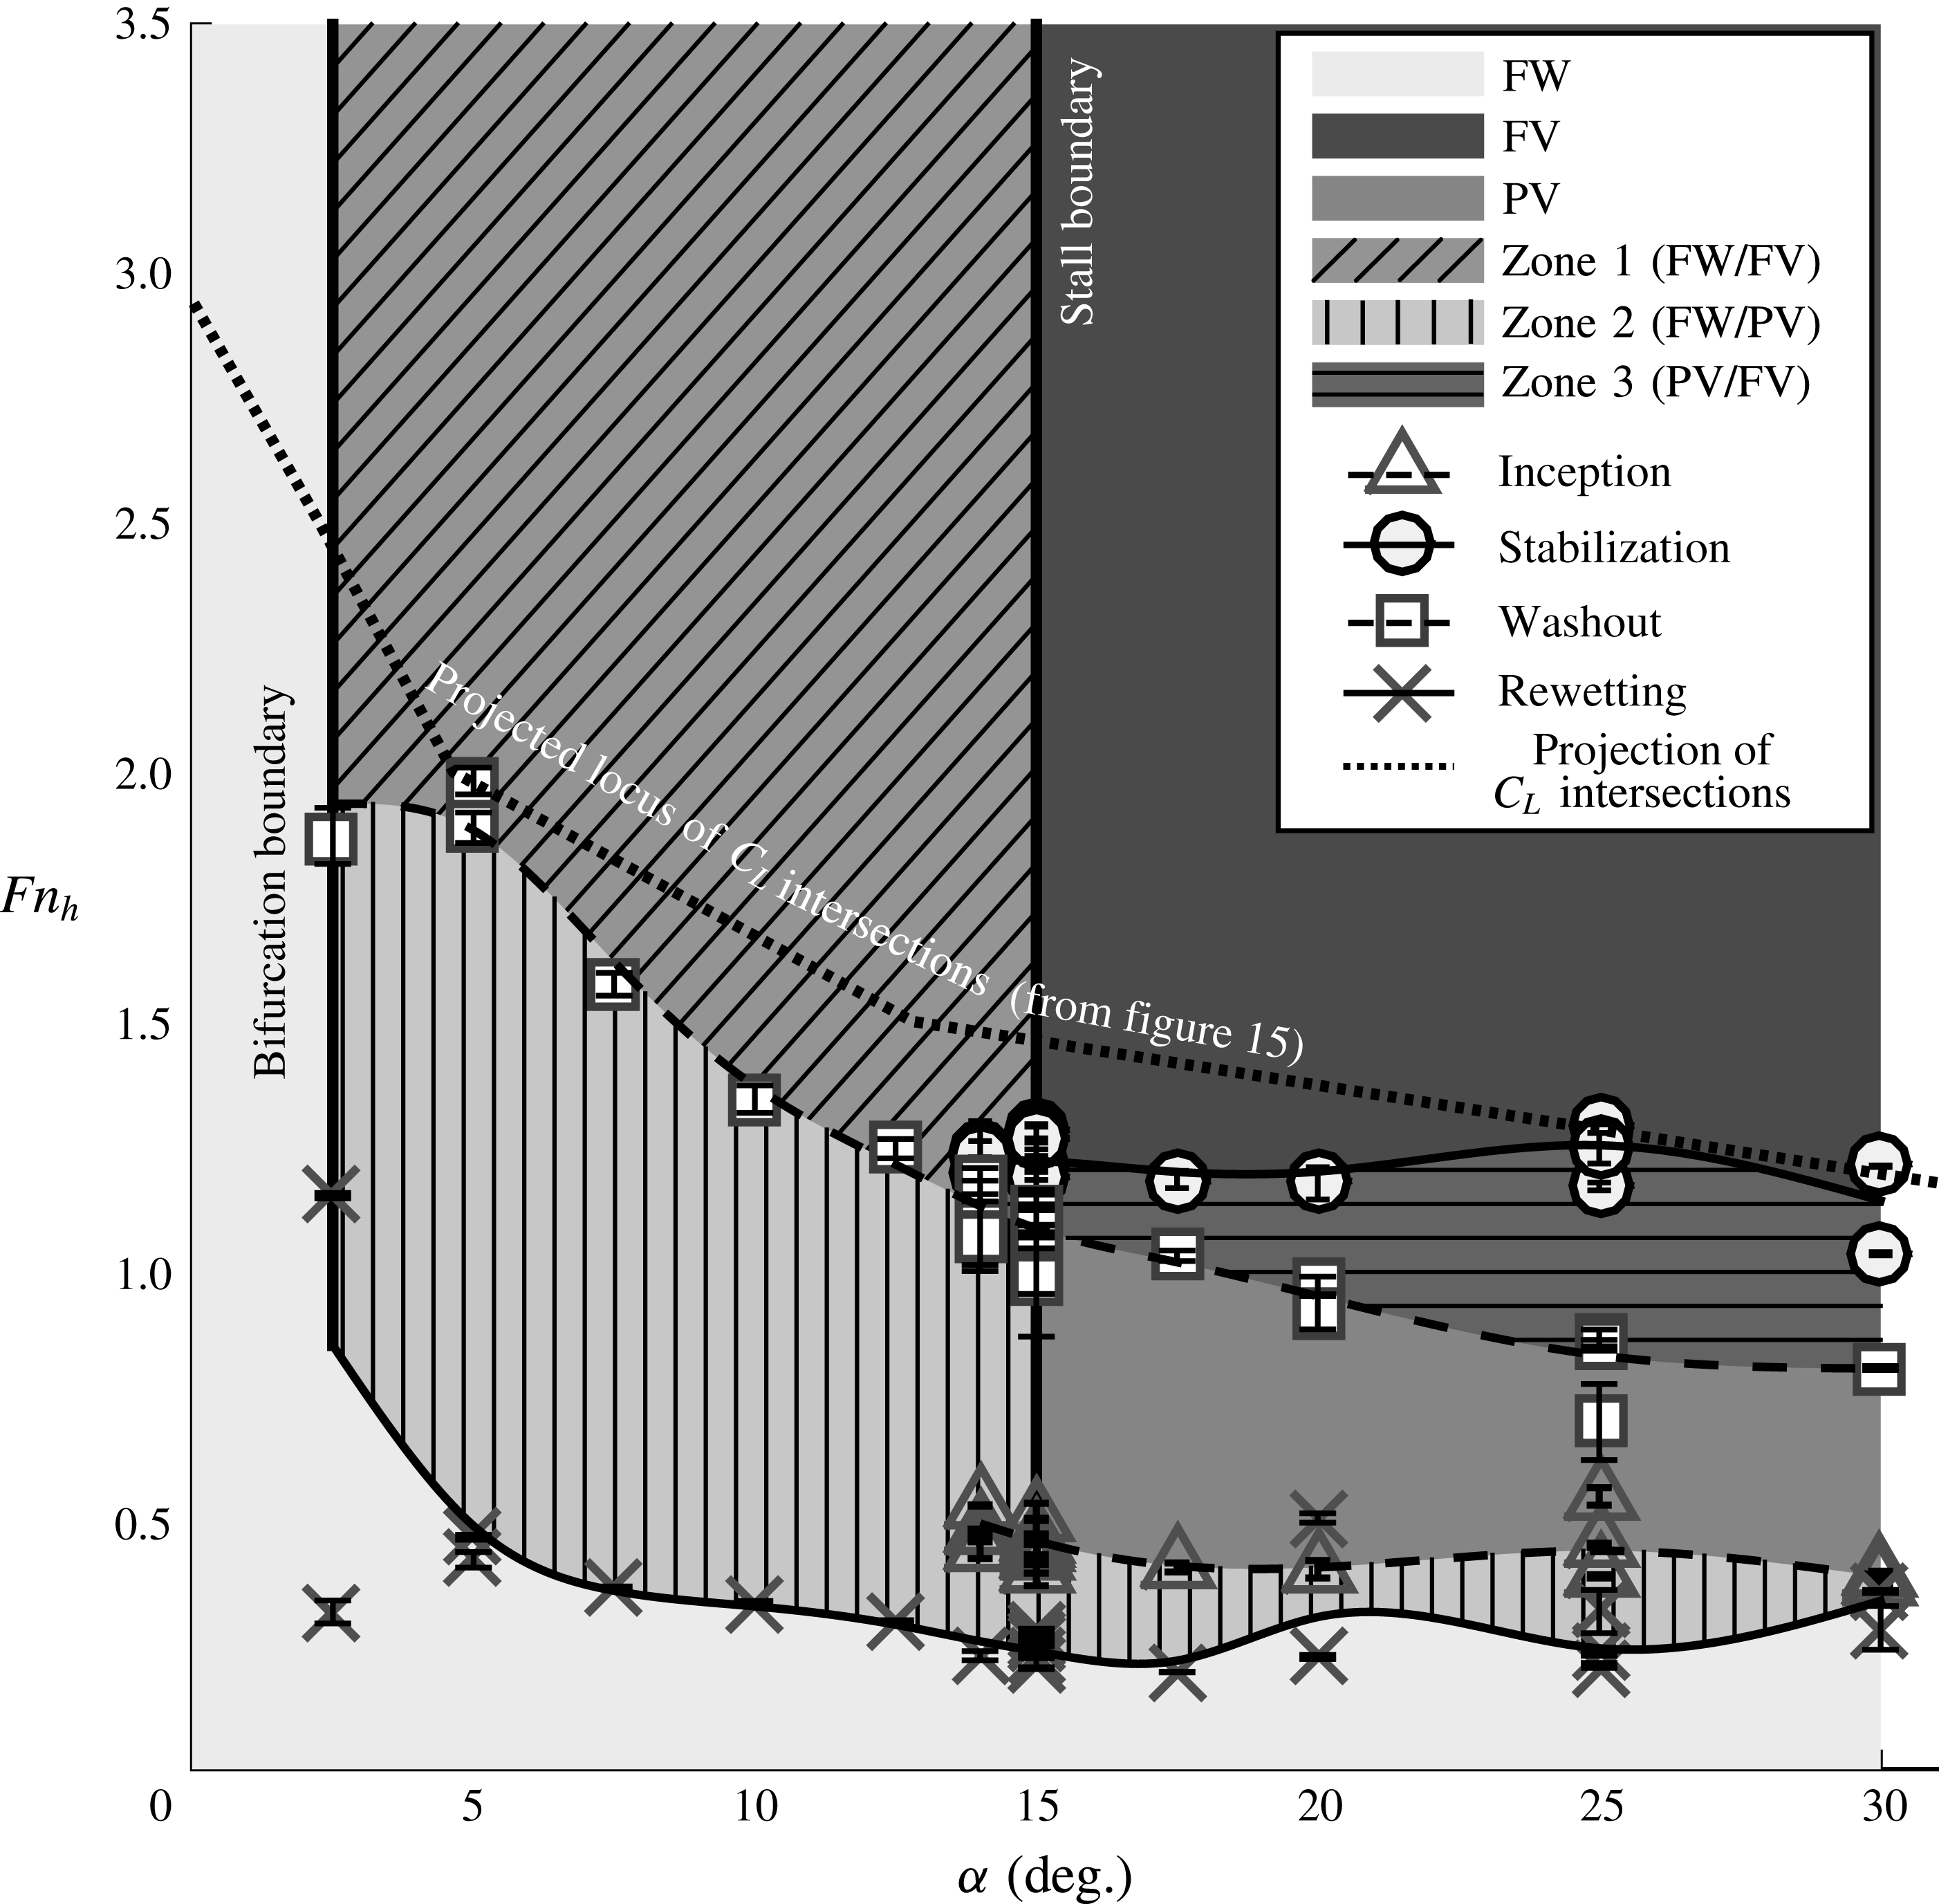
Figure 16. Steady flow regime map for the hydrofoil as a function of
![]() ${\it\alpha}$
and
${\it\alpha}$
and
![]() $Fn_{h}$
at a fixed aspect ratio of
$Fn_{h}$
at a fixed aspect ratio of
![]() $AR_{h}=1.0$
. Shaded regions indicate experimentally observed stable flow regimes. Overlapping zones (numbered 1 through 3) are denoted by hatching, and are indicative of bi-stable flow. Symbols indicate experimentally observed regime boundaries, through which are fitted approximate curves. Uncertainty bars indicate the range in which ventilation transition events were observed to occur. Heavy solid lines on the left and right indicate the bifurcation boundary (the locus of
$AR_{h}=1.0$
. Shaded regions indicate experimentally observed stable flow regimes. Overlapping zones (numbered 1 through 3) are denoted by hatching, and are indicative of bi-stable flow. Symbols indicate experimentally observed regime boundaries, through which are fitted approximate curves. Uncertainty bars indicate the range in which ventilation transition events were observed to occur. Heavy solid lines on the left and right indicate the bifurcation boundary (the locus of
![]() ${\it\alpha}_{b}$
, as shown in figure 15) and the stall boundary (the locus of maximum observed stall angles,
${\it\alpha}_{b}$
, as shown in figure 15) and the stall boundary (the locus of maximum observed stall angles,
![]() ${\it\alpha}_{s}\approx 15^{\circ }$
). The heavy dotted line is an orthographic projection of the locus of points marking the approximate intersection of
${\it\alpha}_{s}\approx 15^{\circ }$
). The heavy dotted line is an orthographic projection of the locus of points marking the approximate intersection of
![]() $C_{L}$
in the FW and FV flow regimes, also shown in figure 15.
$C_{L}$
in the FW and FV flow regimes, also shown in figure 15.
3.4 Stability regions of the three stable flow regimes
The FW, FV and PV flow regimes are mapped as functions of
![]() ${\it\alpha}$
and
${\it\alpha}$
and
![]() $Fn_{h}$
for an immersed aspect ratio of
$Fn_{h}$
for an immersed aspect ratio of
![]() $AR_{h}=1.0$
in figure 16. The experimentally observed flow regimes reveal three distinct stability regions (indicated by solid shading), which overlap in zones 1, 2 and 3 (indicated by hatching). The bifurcation boundary shown in figure 15 is drawn as a heavy solid line in figure 16. Below and to the left of this boundary, FW flow alone was observed. It should be noted that
$AR_{h}=1.0$
in figure 16. The experimentally observed flow regimes reveal three distinct stability regions (indicated by solid shading), which overlap in zones 1, 2 and 3 (indicated by hatching). The bifurcation boundary shown in figure 15 is drawn as a heavy solid line in figure 16. Below and to the left of this boundary, FW flow alone was observed. It should be noted that
![]() ${\it\alpha}=2.5^{\circ }$
was the smallest non-zero angle tested; the verticality of the bifurcation boundary is therefore probably a result of the testing resolution, and FV or PV flow might be attainable at
${\it\alpha}=2.5^{\circ }$
was the smallest non-zero angle tested; the verticality of the bifurcation boundary is therefore probably a result of the testing resolution, and FV or PV flow might be attainable at
![]() ${\it\alpha}<2.5^{\circ }$
for large
${\it\alpha}<2.5^{\circ }$
for large
![]() $Fn_{h}$
. The rightmost extent of the FW regime is indicated by the vertical stall boundary, formed by the collection of stall angles (
$Fn_{h}$
. The rightmost extent of the FW regime is indicated by the vertical stall boundary, formed by the collection of stall angles (
![]() ${\it\alpha}_{s}$
), which appears to be independent of
${\it\alpha}_{s}$
), which appears to be independent of
![]() $Fn_{h}$
. The regions of overlap indicate bi-stable flow conditions, where mutually stable flow regimes coincide. For example, the bi-stable range of
$Fn_{h}$
. The regions of overlap indicate bi-stable flow conditions, where mutually stable flow regimes coincide. For example, the bi-stable range of
![]() ${\it\alpha}$
shown in figures 12–14 corresponds to the overlap of FW and FV regions (in zone 1) along a horizontal cut through figure 16 at
${\it\alpha}$
shown in figures 12–14 corresponds to the overlap of FW and FV regions (in zone 1) along a horizontal cut through figure 16 at
![]() $Fn_{h}=2.5$
. In addition to overlap with respect to
$Fn_{h}=2.5$
. In addition to overlap with respect to
![]() ${\it\alpha}$
, the three regimes overlap their neighbours in the
${\it\alpha}$
, the three regimes overlap their neighbours in the
![]() $Fn_{h}$
direction as well, which has not previously been noted. The edges of the stability regions are populated with symbols, which denote experimentally observed processes that cause transition from one flow regime to another. These ventilation transition mechanisms will be described in § 4. The locus of intersection points between fitted values of
$Fn_{h}$
direction as well, which has not previously been noted. The edges of the stability regions are populated with symbols, which denote experimentally observed processes that cause transition from one flow regime to another. These ventilation transition mechanisms will be described in § 4. The locus of intersection points between fitted values of
![]() $C_{L}$
in the FW and FV regimes (from figure 15) has been orthographically projected onto the
$C_{L}$
in the FW and FV regimes (from figure 15) has been orthographically projected onto the
![]() ${\it\alpha}$
–
${\it\alpha}$
–
![]() $Fn_{h}$
plane, shown by the bold dotted line. The locus projection mimics the shape of the lower extent of FV flow, suggesting that near the boundary between the FV regime and the other two regimes, the lift coefficients in the three flow regimes do not strongly differ from one another.
$Fn_{h}$
plane, shown by the bold dotted line. The locus projection mimics the shape of the lower extent of FV flow, suggesting that near the boundary between the FV regime and the other two regimes, the lift coefficients in the three flow regimes do not strongly differ from one another.
3.5 Discussion: steady flow regimes
This section develops a few important ideas. First, it establishes that spanwise variation in the cavity length leads to re-entrant jet velocities that are well approximated by (3.2a
) and (3.2b
). Second, it verifies that the linearized slope of the cavity closure line (
![]() $\bar{{\it\Phi}}$
) is a suitable metric for predicting the presence of a destabilizing re-entrant jet. It should be recalled that the spanwise non-uniformities of the cavity are caused by combined 3D effects, gravity and nonlinear section forces, the gross effects of which are represented quite well by the nonlinear lifting-line model presented in § 1.2.2.
$\bar{{\it\Phi}}$
) is a suitable metric for predicting the presence of a destabilizing re-entrant jet. It should be recalled that the spanwise non-uniformities of the cavity are caused by combined 3D effects, gravity and nonlinear section forces, the gross effects of which are represented quite well by the nonlinear lifting-line model presented in § 1.2.2.
The division between the three flow regimes has been made on the basis of the stability of the flow. It should be noted that unsteadiness should not be confused with instability, as some stable flows (e.g. PV flow) may be inherently unsteady, even while locally or globally stable. A limitation applies to the flow-regime criteria developed in § 3.2. Callenaere et al. (Reference Callenaere, Franc, Michael and Riondet2001) and Franc & Michel (Reference Franc and Michel2006) point out that thin cavities (which occur at small attack angles) cause correspondingly thin re-entrant jets to develop. These jets are more severely affected by wall friction than are thicker jets; the thinness of the cavities means that the jets often collide with – and become re-entrained in – the external flow. Thus, for small angles of attack (
![]() ${\it\alpha}\lesssim 5^{\circ }$
), the thin jet is not sufficient to perturb the flow away from its locally stable configuration, so the
${\it\alpha}\lesssim 5^{\circ }$
), the thin jet is not sufficient to perturb the flow away from its locally stable configuration, so the
![]() $\bar{{\it\Phi}}=45^{\circ }$
condition is not expected to reflect the stability of the flow at such small attack angles. However, when small cavities with closure angles of
$\bar{{\it\Phi}}=45^{\circ }$
condition is not expected to reflect the stability of the flow at such small attack angles. However, when small cavities with closure angles of
![]() $\bar{{\it\Phi}}\approx 45^{\circ }$
were subjected to external perturbations (air injections, small ripples, spray sheet, etc.), the flow often underwent a transition to PV flow, from which FV flow did not resume. At such small attack angles,
$\bar{{\it\Phi}}\approx 45^{\circ }$
were subjected to external perturbations (air injections, small ripples, spray sheet, etc.), the flow often underwent a transition to PV flow, from which FV flow did not resume. At such small attack angles,
![]() $\bar{{\it\Phi}}=45^{\circ }$
is retained as the division between flow regimes – not because it necessarily signals instability caused by a re-entrant jet, but because it is a convenient and repeatable visual distinction which belies a tenuously stable flow configuration.
$\bar{{\it\Phi}}=45^{\circ }$
is retained as the division between flow regimes – not because it necessarily signals instability caused by a re-entrant jet, but because it is a convenient and repeatable visual distinction which belies a tenuously stable flow configuration.
The establishment of three ventilated flow regimes is important for two reasons. First, it standardizes the definitions under which ventilated flow may be discussed and results disseminated. Previous studies have used disparate terminology. Second, it lays a groundwork from which to begin investigating the mechanisms of transition between ventilation regimes. Finally, a systematic method of characterizing the flow regimes is also necessary for establishing scaling relations for stability boundaries, more of which will be discussed in § 4.2.1.
The overlapping zones in figure 16 are of interest because they represent bi-stable conditions, where the flow may take on either one of the locally stable regimes. Factors governing the regime of a given flow include hysteretic effects with movement through the parametric map (such as during flow acceleration and deceleration) or external perturbations to the flow. Transition between two locally stable regimes is possible wherever the stability regions of those respective regimes abut or overlap one another. Overlaps along the
![]() $Fn_{h}$
-axis are particularly interesting, and merit further investigation. The stability boundaries were measured in accelerating and decelerating conditions (described further in § 4), so there is the possibility that some inertial and wake-memory effects are present. All efforts were made, however, to minimize such effects when populating the boundaries of figure 16 (see appendix B), so the overlaps are thought to be indicators of true bi-stable flow conditions, and not just transient effects.
$Fn_{h}$
-axis are particularly interesting, and merit further investigation. The stability boundaries were measured in accelerating and decelerating conditions (described further in § 4), so there is the possibility that some inertial and wake-memory effects are present. All efforts were made, however, to minimize such effects when populating the boundaries of figure 16 (see appendix B), so the overlaps are thought to be indicators of true bi-stable flow conditions, and not just transient effects.
4 Results: ventilation formation and elimination
Ventilation transition mechanisms collectively describe the processes by which the flow moves between stable regimes, either by crossing stability boundaries (the edges of regions in figure 16) or by moving between two mutually stable regimes (in zones 1, 2 or 3 of figure 16). A hierarchy of ventilation transition mechanisms is shown in figure 17, illustrating how each mechanism links the steady flow regimes defined in § 3.2. The first distinction between transition mechanisms is made on the basis of the overall direction of the transition, dividing ventilation transition into ‘formation’ and ‘elimination’ mechanisms. Ventilation formation mechanisms are described in § 4.1 and elimination mechanisms are discussed in § 4.2. Movies of each of the processes are included in the online supplementary material available at http://dx.doi.org/10.1017/jfm.2016.373.

Figure 17. Process chart showing the hierarchy of ventilation transition mechanisms. The first level distinguishes the overall direction of transition. The second level identifies the individual stages of transition between the three steady flow regimes.
4.1 Ventilation formation
Formation mechanisms promote the growth and stability of a cavity, causing the flow to transition from an FW or PV regime to a PV or FV regime respectively (see figure 17). Formation mechanisms can be further decomposed into two sequential stages, as follows.
Inception is the transition from FW flow to PV flow, which marks the first stage in the formation of a ventilated cavity. The first visual evidence of persistent air entrainment is sufficient to classify inception. Triangular symbols along the upper boundary of the FW region for
![]() ${\it\alpha}\geqslant 14^{\circ }$
in figure 16 indicate spontaneous ventilation inception (§ 4.1.1). Ventilation inception may also occur in zones 1 and 2 of figure 16, where the FW regime overlaps the FV and PV regimes respectively (described in § 4.1.2).
${\it\alpha}\geqslant 14^{\circ }$
in figure 16 indicate spontaneous ventilation inception (§ 4.1.1). Ventilation inception may also occur in zones 1 and 2 of figure 16, where the FW regime overlaps the FV and PV regimes respectively (described in § 4.1.2).
Stabilization is the transition from PV flow to FV flow, which completes ventilation formation. Stabilization is said to occur when the flow satisfies the criteria established for FV flow in § 3.2. Circles along the upper boundary of the PV region in figure 16 denote spontaneous stabilization events. Stabilization also immediately follows inception in zone 1 of figure 16. Under suitable conditions, stabilization can occur in zone 3 as well.
The two stages of ventilation formation can occur on multiple time scales and through different physical processes. Spontaneous formation mechanisms occur by self-initiated features of the flow. Perturbation-induced formation mechanisms, on the other hand, occur when some external influence perturbs the flow away from its locally stable state.
4.1.1 Spontaneous formation
Spontaneous formation mechanisms were examined by accelerating the towing carriage (constituting an upward vertical trajectory through the space of figure 16). Inception and stabilization were recorded to form the respective boundaries.
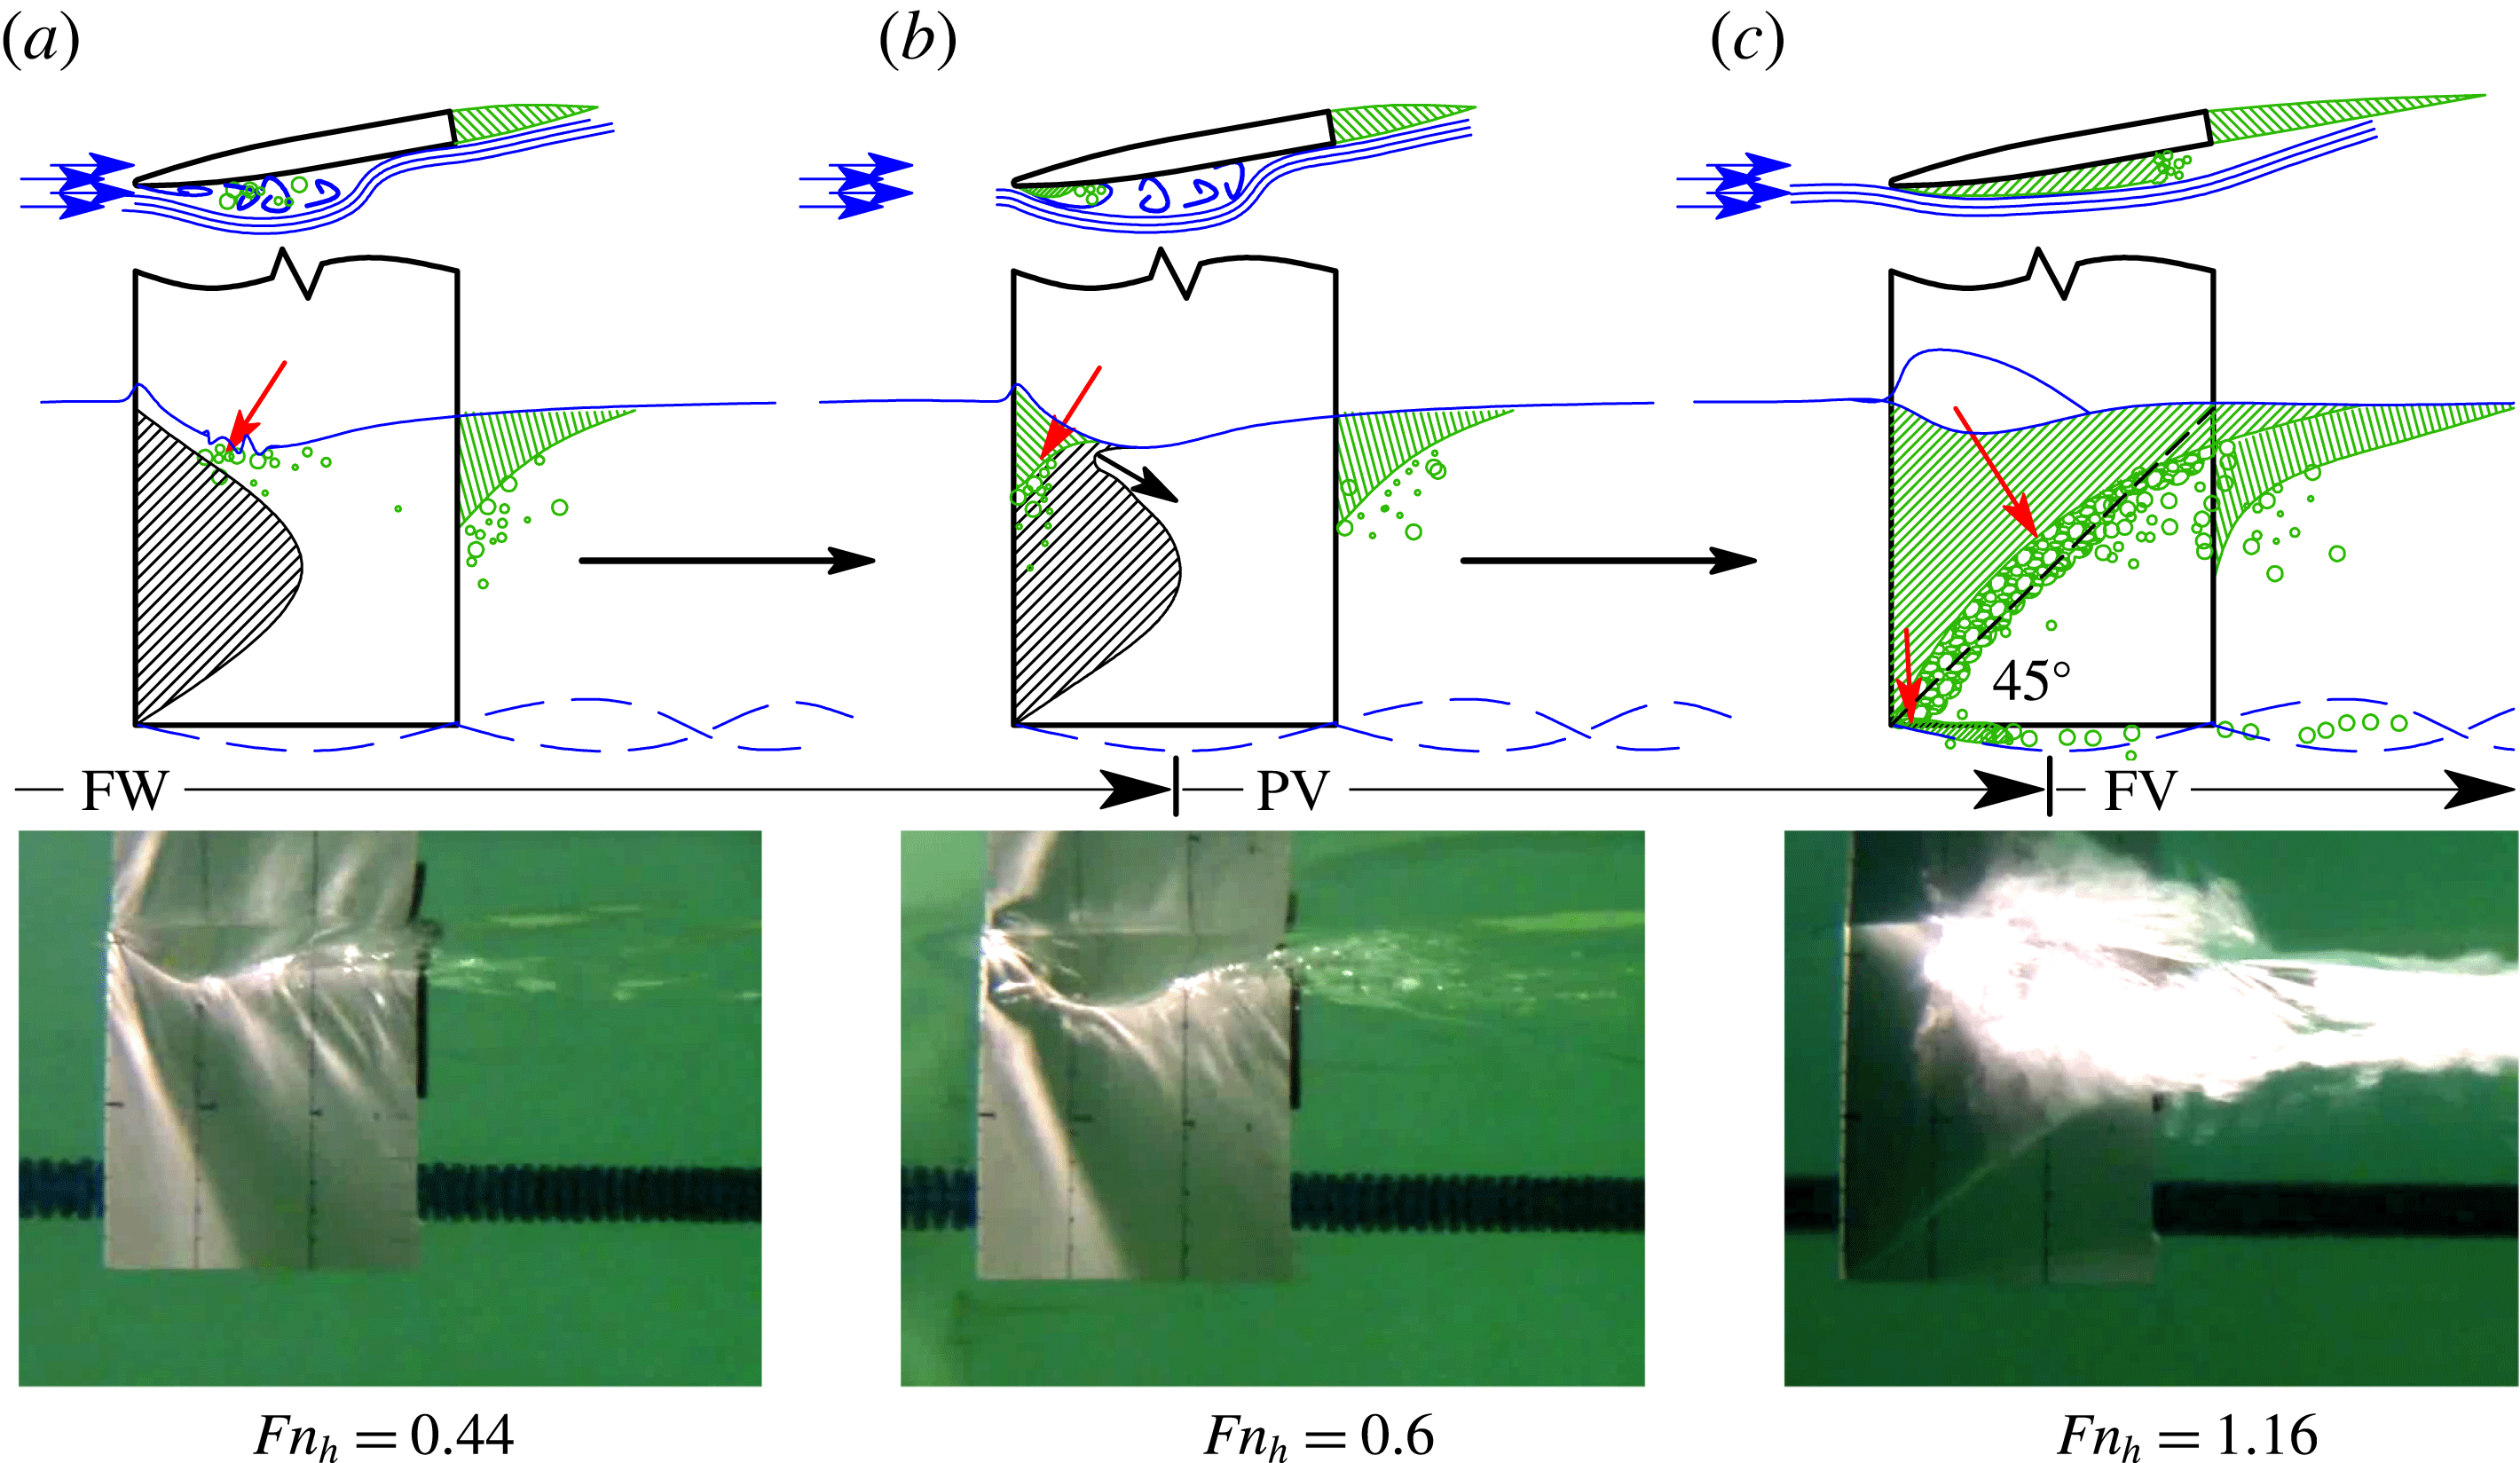
Figure 18. Spontaneous stall-induced ventilation formation occurring at
![]() ${\it\alpha}=15^{\circ }\approx {\it\alpha}_{s}$
,
${\it\alpha}=15^{\circ }\approx {\it\alpha}_{s}$
,
![]() $AR_{h}=1$
. Here,
$AR_{h}=1$
. Here,
![]() $Fn_{h}$
is given at the instant of each photograph. Blue lines denote streamlines, green lines and hatching indicate entrained air, black hatching indicates boundary layer separation and red arrows indicate air-ingress paths. A movie of this process is also included in the online supplementary material (movie 1).
$Fn_{h}$
is given at the instant of each photograph. Blue lines denote streamlines, green lines and hatching indicate entrained air, black hatching indicates boundary layer separation and red arrows indicate air-ingress paths. A movie of this process is also included in the online supplementary material (movie 1).
Stall-induced formation occurs when the angle of attack is set at or above the stall angle (
![]() ${\it\alpha}\geqslant {\it\alpha}_{s}$
). An example of the stall-induced ventilation formation process is depicted in figure 18, along with experimental photos of the hydrofoil suction surface. The flow begins in the FW regime. A large leading edge vortex creates a stagnant region of wetted separation, indicated by black hatching. In (a), the low pressures on the hydrofoil surface create a steep depression of the free surface, forcing proximity between the free surface (an air source) and the separated flow (ventilation-prone flow). At the same time, small vortical disturbances develop near the toe of the free-surface depression. Such vorticity development was noted in the waves generated by an unyawed surface-piercing hydrofoil by Pogozelski, Katz & Huang (Reference Pogozelski, Katz and Huang1997). The vortical structures at the free surface temporarily breach the surface seal, admitting air into the separated flow. If enough air is admitted, then it becomes stably entrained, constituting inception, shown in (b). After inception, the flow is classified as PV. As the flow velocity increases, the suction-side dynamic pressure negates the hydrostatic pressure to increasing depths and the sectional values of
${\it\alpha}\geqslant {\it\alpha}_{s}$
). An example of the stall-induced ventilation formation process is depicted in figure 18, along with experimental photos of the hydrofoil suction surface. The flow begins in the FW regime. A large leading edge vortex creates a stagnant region of wetted separation, indicated by black hatching. In (a), the low pressures on the hydrofoil surface create a steep depression of the free surface, forcing proximity between the free surface (an air source) and the separated flow (ventilation-prone flow). At the same time, small vortical disturbances develop near the toe of the free-surface depression. Such vorticity development was noted in the waves generated by an unyawed surface-piercing hydrofoil by Pogozelski, Katz & Huang (Reference Pogozelski, Katz and Huang1997). The vortical structures at the free surface temporarily breach the surface seal, admitting air into the separated flow. If enough air is admitted, then it becomes stably entrained, constituting inception, shown in (b). After inception, the flow is classified as PV. As the flow velocity increases, the suction-side dynamic pressure negates the hydrostatic pressure to increasing depths and the sectional values of
![]() ${\it\sigma}_{c}$
decrease, causing the cavity to grow in both length and depth. As the cavity grows, it modifies the local chordwise pressure gradients, causing the separated flow to propagate ahead of the cavity (Tassin-Leger & Ceccio Reference Tassin-Leger and Ceccio1998), creating a moving front of ventilation-prone flow. The instant when the cavity meets the conditions for FV flow given in § 3.2 (
${\it\sigma}_{c}$
decrease, causing the cavity to grow in both length and depth. As the cavity grows, it modifies the local chordwise pressure gradients, causing the separated flow to propagate ahead of the cavity (Tassin-Leger & Ceccio Reference Tassin-Leger and Ceccio1998), creating a moving front of ventilation-prone flow. The instant when the cavity meets the conditions for FV flow given in § 3.2 (
![]() $D=h$
and
$D=h$
and
![]() $\bar{{\it\Phi}}<45^{\circ }$
) is shown in (c). This constitutes stabilization, beyond which point the flow is classified as FV. Stall-induced formation is a quasi-steady process, wherein the flow takes on an evolving state of equilibrium as the speed, and hence the pressure distribution, changes. As a result, cavity formation takes place on a time scale governed by the acceleration of the hydrofoil.
$\bar{{\it\Phi}}<45^{\circ }$
) is shown in (c). This constitutes stabilization, beyond which point the flow is classified as FV. Stall-induced formation is a quasi-steady process, wherein the flow takes on an evolving state of equilibrium as the speed, and hence the pressure distribution, changes. As a result, cavity formation takes place on a time scale governed by the acceleration of the hydrofoil.
Another case of spontaneous ventilation formation occurs when air enters the tip vortex at a downstream location and is transported upstream through the aerated vortex core. ‘Tip vortex inception’ was observed by Breslin & Skalak (Reference Breslin and Skalak1959) and Swales et al. (Reference Swales, Wright, McGregor and Rothblum1974) only at large angles of attack and small immersion depths (described in § 1.1). In the present experiments, air entered the tip vortex through the bubbly wake of the blunt trailing edge of the foil. A process sketch and experimental photos are shown in figure 19. The flow begins in the FW regime, with a base-vented cavity attached to the blunt trailing edge. Eddies in the wake draw air bubbles into the low-pressure core of the tip vortex, where they coalesce into an aerated vortex core, shown in (a). The coalesced bubble migrates up the low-pressure core towards the leading edge of the foil, where it encounters a favourable pressure gradient, as shown in (b). In (c), the air reaches the region of separated flow and expands rapidly upwards and towards the foil trailing edge. Fully ventilated flow is attained in a fraction of a second, with no appreciable dwell in the PV regime. Tip-vortex-induced formation occurred only at
![]() $AR_{h}=1.0$
, at yaw angles very near the stall boundary (
$AR_{h}=1.0$
, at yaw angles very near the stall boundary (
![]() ${\it\alpha}\approx 15^{\circ }$
), and at
${\it\alpha}\approx 15^{\circ }$
), and at
![]() $Fn_{h}\approx 3.5$
.
$Fn_{h}\approx 3.5$
.

Figure 19. Tip vortex ventilation formation occurring at angles near stall,
![]() ${\it\alpha}=15^{\circ }\approx {\it\alpha}_{s}$
,
${\it\alpha}=15^{\circ }\approx {\it\alpha}_{s}$
,
![]() $AR_{h}=1$
. Here,
$AR_{h}=1$
. Here,
![]() $Fn_{h}$
is given at the instant of each photograph. Time is increasing from left to right at a constant Froude number for the case shown. The process may be seen in movie 2 of the online supplementary material.
$Fn_{h}$
is given at the instant of each photograph. Time is increasing from left to right at a constant Froude number for the case shown. The process may be seen in movie 2 of the online supplementary material.
Figure 20 depicts a surface-flow visualization at
![]() $Fn_{h}=2.5$
,
$Fn_{h}=2.5$
,
![]() ${\it\alpha}=14^{\circ }$
,
${\it\alpha}=14^{\circ }$
,
![]() $AR_{h}=1.0$
, corresponding to a location near the upper right corner of the FW stability region (in zone 1) in figure 16. A large separation bubble is clearly visible, indicated by the forward-swept paint streaks and black dashed outline. The separation bubble is conducive to both stall-induced formation and tip-vortex-induced formation. In the former case, air ingress occurs through disturbances in the thin layer of liquid between the separation bubble and the free surface, indicated by the free-surface profile and superimposed arrow in (a). In the latter case, air ingress occurs when a tip vortex develops of sufficient strength to transport air upstream to the separation bubble, shown in (b). Both stall-induced formation and tip-vortex-induced formation result when naturally occurring air paths reach the regions of flow separation.
$AR_{h}=1.0$
, corresponding to a location near the upper right corner of the FW stability region (in zone 1) in figure 16. A large separation bubble is clearly visible, indicated by the forward-swept paint streaks and black dashed outline. The separation bubble is conducive to both stall-induced formation and tip-vortex-induced formation. In the former case, air ingress occurs through disturbances in the thin layer of liquid between the separation bubble and the free surface, indicated by the free-surface profile and superimposed arrow in (a). In the latter case, air ingress occurs when a tip vortex develops of sufficient strength to transport air upstream to the separation bubble, shown in (b). Both stall-induced formation and tip-vortex-induced formation result when naturally occurring air paths reach the regions of flow separation.

Figure 20. Surface-flow visualization for
![]() ${\it\alpha}=14^{\circ }$
,
${\it\alpha}=14^{\circ }$
,
![]() $Fn_{h}=2.5$
,
$Fn_{h}=2.5$
,
![]() $AR_{h}=1.0$
, showing two possible mechanisms of ventilation inception (the first stage of ventilation formation). Red arrows indicate the respective ingress paths of air. (a) The free-surface profile immediately preceding spontaneous stall-induced inception. (b) The aerated tip vortex immediately preceding tip-vortex-induced inception.
$AR_{h}=1.0$
, showing two possible mechanisms of ventilation inception (the first stage of ventilation formation). Red arrows indicate the respective ingress paths of air. (a) The free-surface profile immediately preceding spontaneous stall-induced inception. (b) The aerated tip vortex immediately preceding tip-vortex-induced inception.
The time histories of instantaneous lift, drag and moment coefficients of the two trials pictured in figures 18 and 19 are plotted against the instantaneous Froude number in figure 21. It should be noted that at small
![]() $Fn_{h}$
, the denominators of (3.3) vanish, and fluid inertial forces are large relative to the quasi-steady (velocity-dependent) load. As a result,
$Fn_{h}$
, the denominators of (3.3) vanish, and fluid inertial forces are large relative to the quasi-steady (velocity-dependent) load. As a result,
![]() $C_{L}$
,
$C_{L}$
,
![]() $C_{D}$
and
$C_{D}$
and
![]() $C_{M}$
may not be representative of steady-state results for
$C_{M}$
may not be representative of steady-state results for
![]() $Fn_{h}<1$
. The grey and black traces describe two separate runs, each comprising an acceleration and deceleration cycle. Dashed arrows indicate the direction of the traces with increasing time. Symbols indicate steady-state force and moment coefficients. It should be noted that the steady-state data shown are projections of the same points shown in figures 12–15, plotted for a fixed
$Fn_{h}<1$
. The grey and black traces describe two separate runs, each comprising an acceleration and deceleration cycle. Dashed arrows indicate the direction of the traces with increasing time. Symbols indicate steady-state force and moment coefficients. It should be noted that the steady-state data shown are projections of the same points shown in figures 12–15, plotted for a fixed
![]() ${\it\alpha}$
at different values of
${\it\alpha}$
at different values of
![]() $Fn_{h}$
. The lettered markers indicate the corresponding panels in figures 18 and 19. The trace corresponding to stall-induced formation (solid black line in figure 21) follows the PV and FV markers during acceleration and deceleration, with the forces passing gradually through the inception and stabilization events at increasing values of
$Fn_{h}$
. The lettered markers indicate the corresponding panels in figures 18 and 19. The trace corresponding to stall-induced formation (solid black line in figure 21) follows the PV and FV markers during acceleration and deceleration, with the forces passing gradually through the inception and stabilization events at increasing values of
![]() $Fn_{h}$
. In the case of tip-vortex-induced formation (dashed grey line in figure 21), the loads pass through the FW points during the acceleration phase. At
$Fn_{h}$
. In the case of tip-vortex-induced formation (dashed grey line in figure 21), the loads pass through the FW points during the acceleration phase. At
![]() $Fn_{h}=3.5$
, inception and stabilization occur rapidly at a constant speed, indicated by a precipitous drop in
$Fn_{h}=3.5$
, inception and stabilization occur rapidly at a constant speed, indicated by a precipitous drop in
![]() $C_{L}$
and
$C_{L}$
and
![]() $C_{M}$
. During deceleration, the measured forces and moment follow the FV and PV points, overlapping with the deceleration section of the stall-induced formation case.
$C_{M}$
. During deceleration, the measured forces and moment follow the FV and PV points, overlapping with the deceleration section of the stall-induced formation case.

Figure 21. Time histories of lift, drag and moment coefficients for stall-induced (as depicted in figure 18) and tip-vortex-induced (as depicted in figure 19) ventilation formation at
![]() ${\it\alpha}=15^{\circ }$
,
${\it\alpha}=15^{\circ }$
,
![]() $AR_{h}=1$
. Dashed arrows indicate the acceleration and deceleration stages of the runs. Steady-state force/moment coefficients for all runs at
$AR_{h}=1$
. Dashed arrows indicate the acceleration and deceleration stages of the runs. Steady-state force/moment coefficients for all runs at
![]() ${\it\alpha}=15^{\circ }$
are plotted as open symbols, with measurement uncertainties and standard deviations indicated respectively by grey and black horizontal bars.
${\it\alpha}=15^{\circ }$
are plotted as open symbols, with measurement uncertainties and standard deviations indicated respectively by grey and black horizontal bars.
4.1.2 Perturbation-induced formation
In addition to the spontaneous formation processes observed at the boundaries of the stability regions, ventilation formation may be triggered by an external perturbation to an otherwise steady flow. When the parameters of a flow are inside one of the overlapping zones in figure 16, a suitable perturbation will destabilize the locally stable flow state and initiate a jump to a lower-energy state (FW to FV via inception and stabilization in zone 1, FW to PV via inception in zone 2, and PV to FV via stabilization in zone 3).
Figure 22 shows a sketch of a perturbation-induced ventilation formation process that would occur in zone 1. In (a), the flow is FW. Compared with the case of stall-induced formation, the leading edge separation bubble is small and the large Froude number means that the free surface is not so steeply deformed, so the free surface never approaches the boundary of flow separation. As a result, a thin layer of attached flow exists just below the free surface (indicated by a dashed line), sealing the ventilation-prone flow from the ingress of air. In (b), a high-pressure jet of air is injected at the junction of the leading edge and the free surface, introducing vorticity and bubbles into the flow at the free surface to break the surface seal. In (c), a small cavity is entrained and grows rapidly from the point of inception towards the immersed trailing edge until it reaches the lower-energy FV state. Entrainment and stabilization are nearly concurrent in this case, with little to no dwell in the PV regime. Fully ventilated flow can develop in approximately
![]() $1/10\text{th}$
of a second following perturbation.
$1/10\text{th}$
of a second following perturbation.
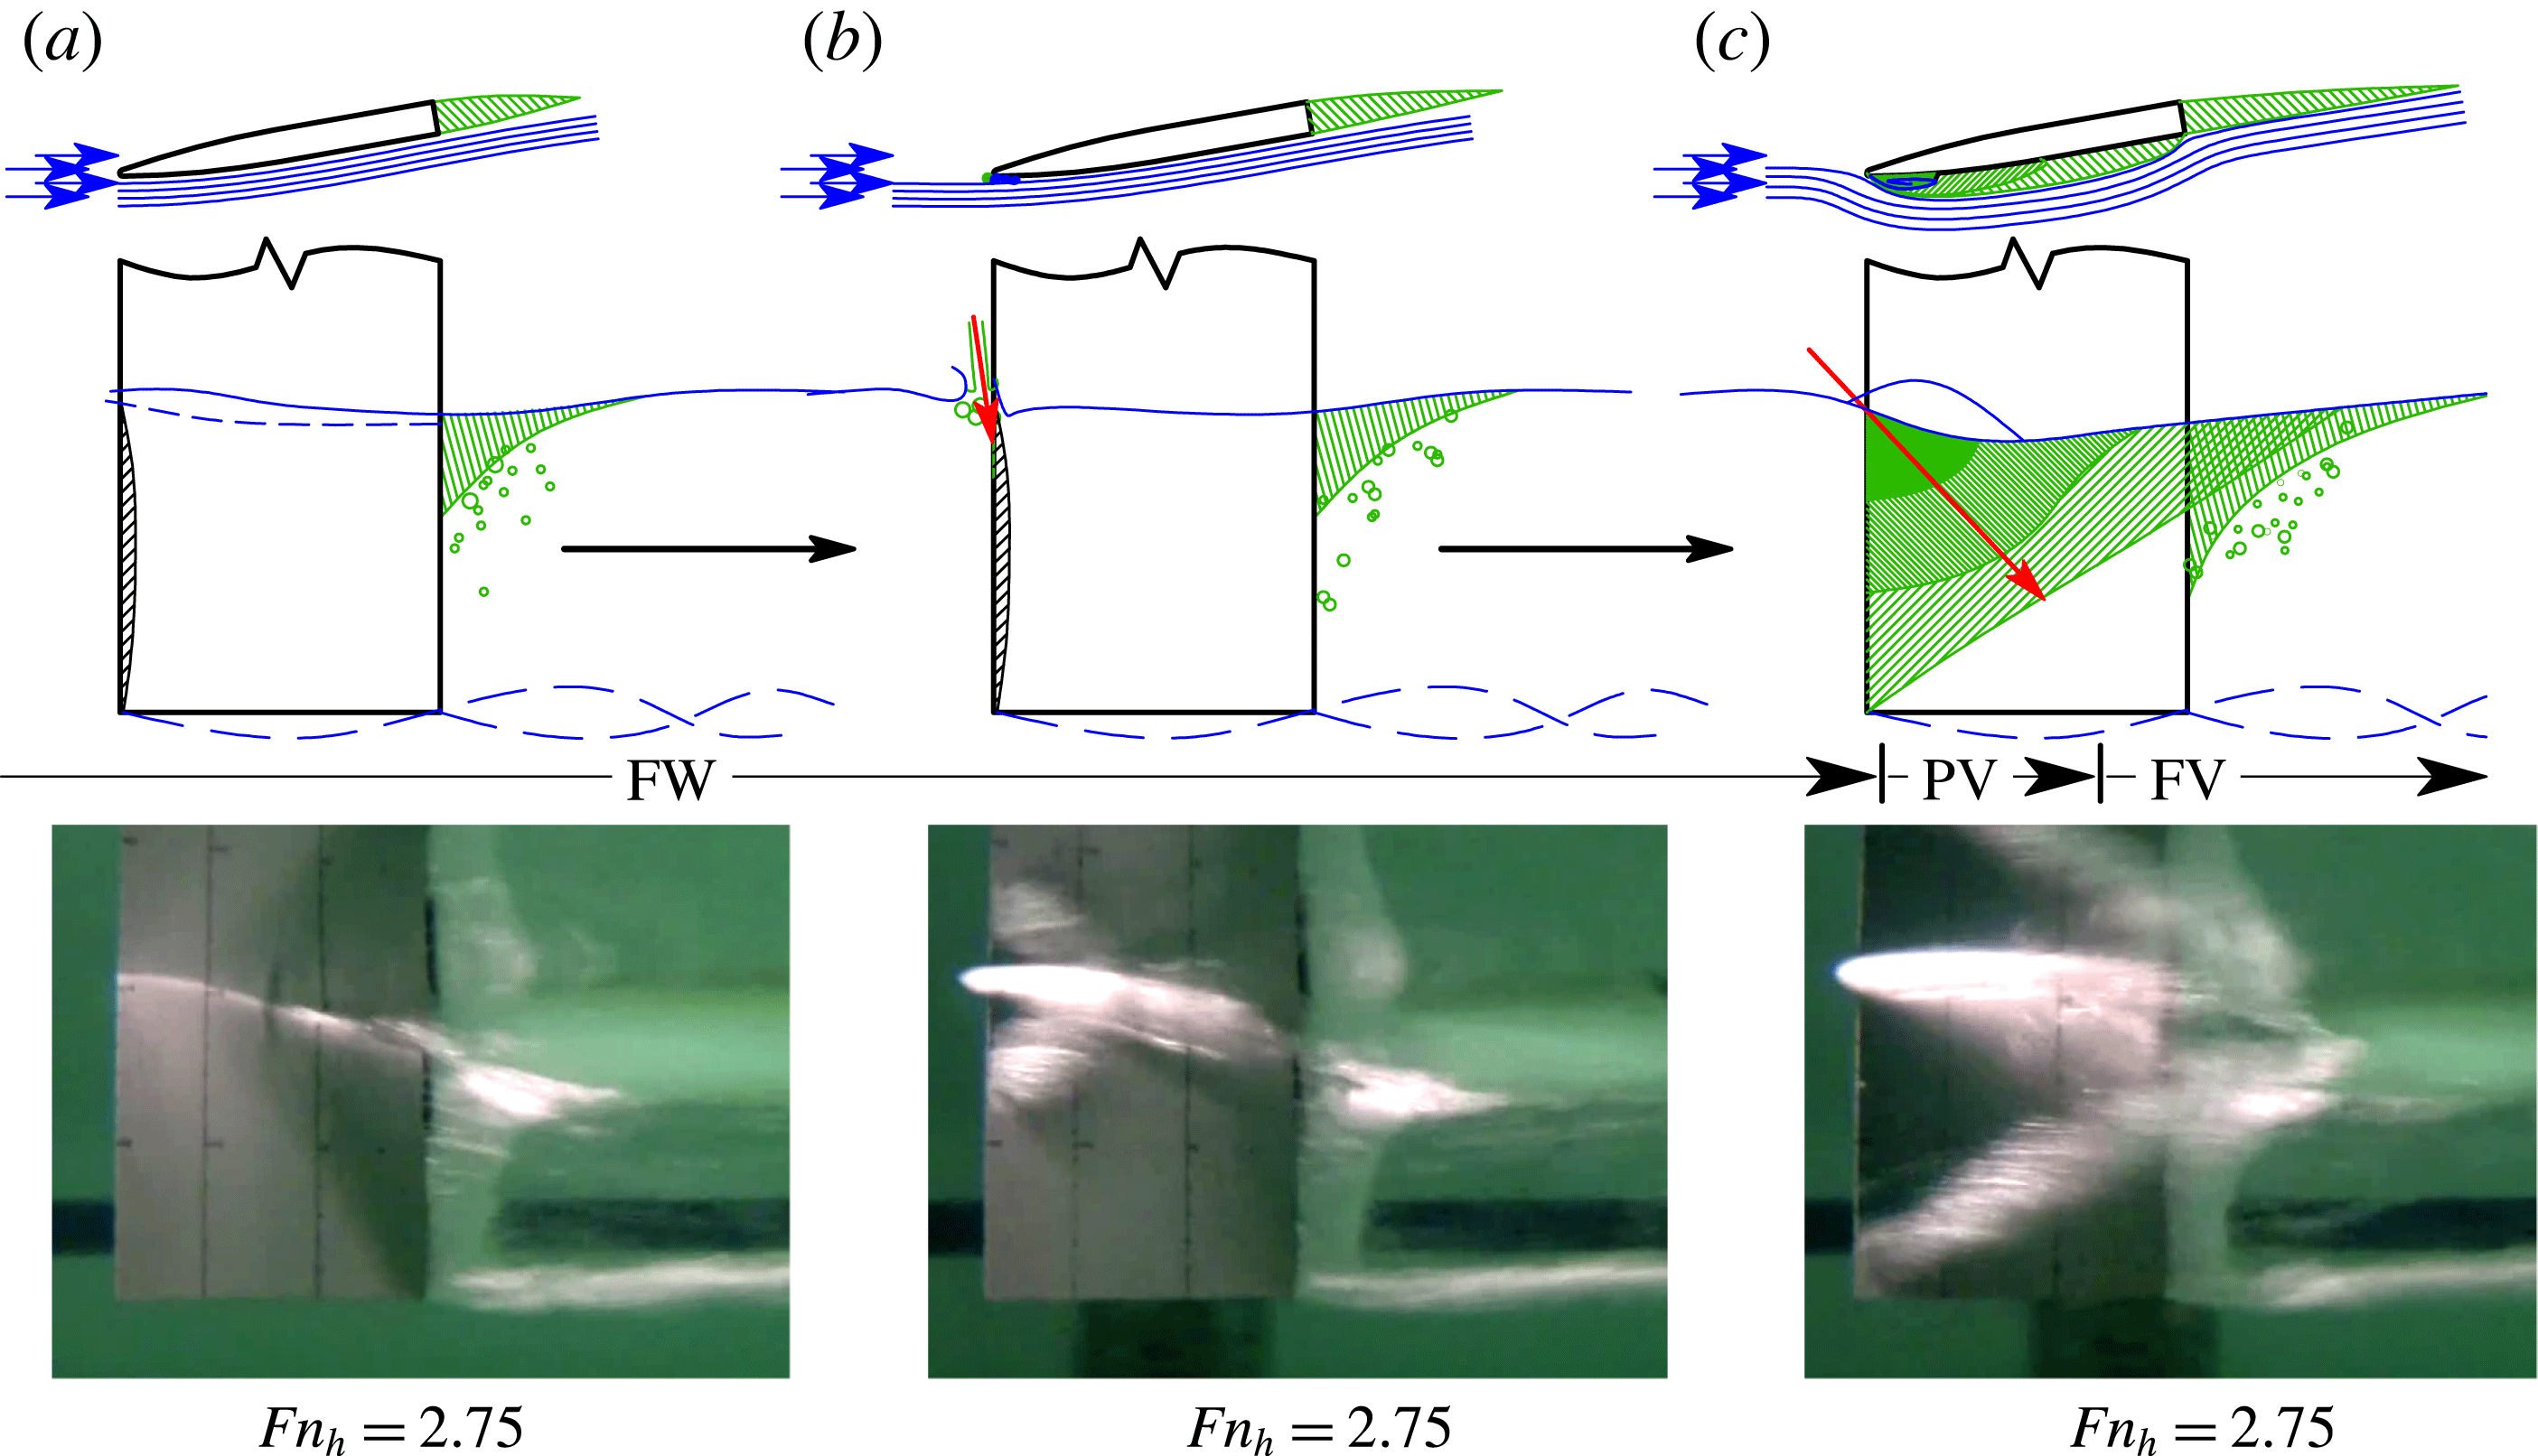
Figure 22. Perturbed ventilation formation occurring at sub-stall,
![]() ${\it\alpha}=10^{\circ }<{\it\alpha}_{s}$
,
${\it\alpha}=10^{\circ }<{\it\alpha}_{s}$
,
![]() $AR_{h}=1$
,
$AR_{h}=1$
,
![]() $Fn_{h}=2.75$
(inside zone 1 of figure 16). Blue lines denote streamlines, green lines and hatching indicate entrained air, black hatching indicates boundary layer separation, the blue dashed line indicates the free-surface seal and red arrows indicate air-ingress paths. The process may be seen in movie 3 of the online supplementary material.
$Fn_{h}=2.75$
(inside zone 1 of figure 16). Blue lines denote streamlines, green lines and hatching indicate entrained air, black hatching indicates boundary layer separation, the blue dashed line indicates the free-surface seal and red arrows indicate air-ingress paths. The process may be seen in movie 3 of the online supplementary material.
Figure 23 shows the surface-flow pattern at
![]() ${\it\alpha}=10^{\circ }$
,
${\it\alpha}=10^{\circ }$
,
![]() $Fn_{h}=2.5$
,
$Fn_{h}=2.5$
,
![]() $AR_{h}=1.0$
. The small yaw angle creates a short leading edge separation bubble, where flow reversal has swept several of the forwardmost columns of paint dots towards the leading edge. The free surface in the FW regime is superimposed as line (a). When air injection is initiated, the depression of the free surface permits air to enter the small bubble and expand, shown by line (b). Again, experimental observations support the hypothesis that inception occurs when an air supply is made available to ventilation-prone flow.
$AR_{h}=1.0$
. The small yaw angle creates a short leading edge separation bubble, where flow reversal has swept several of the forwardmost columns of paint dots towards the leading edge. The free surface in the FW regime is superimposed as line (a). When air injection is initiated, the depression of the free surface permits air to enter the small bubble and expand, shown by line (b). Again, experimental observations support the hypothesis that inception occurs when an air supply is made available to ventilation-prone flow.

Figure 23. Surface-flow visualization for
![]() ${\it\alpha}=10^{\circ }$
,
${\it\alpha}=10^{\circ }$
,
![]() $Fn_{h}=2.5$
,
$Fn_{h}=2.5$
,
![]() $AR_{h}=1.0$
. The dashed line depicts the leading edge separation bubble caused by thin-airfoil stall. (a) The free-surface profile prior to ventilation inception and (b) the air-filled depression created by the air-jet perturbation.
$AR_{h}=1.0$
. The dashed line depicts the leading edge separation bubble caused by thin-airfoil stall. (a) The free-surface profile prior to ventilation inception and (b) the air-filled depression created by the air-jet perturbation.
Time histories of the lift, drag and moment coefficients of the process pictured in figure 22 are plotted against the instantaneous Froude number in figure 24. The resulting hysteresis loop is similar to that created by tip-vortex-induced formation in the sense that large changes in hydrodynamic loading occur on a short time scale, and at otherwise steady flow conditions.
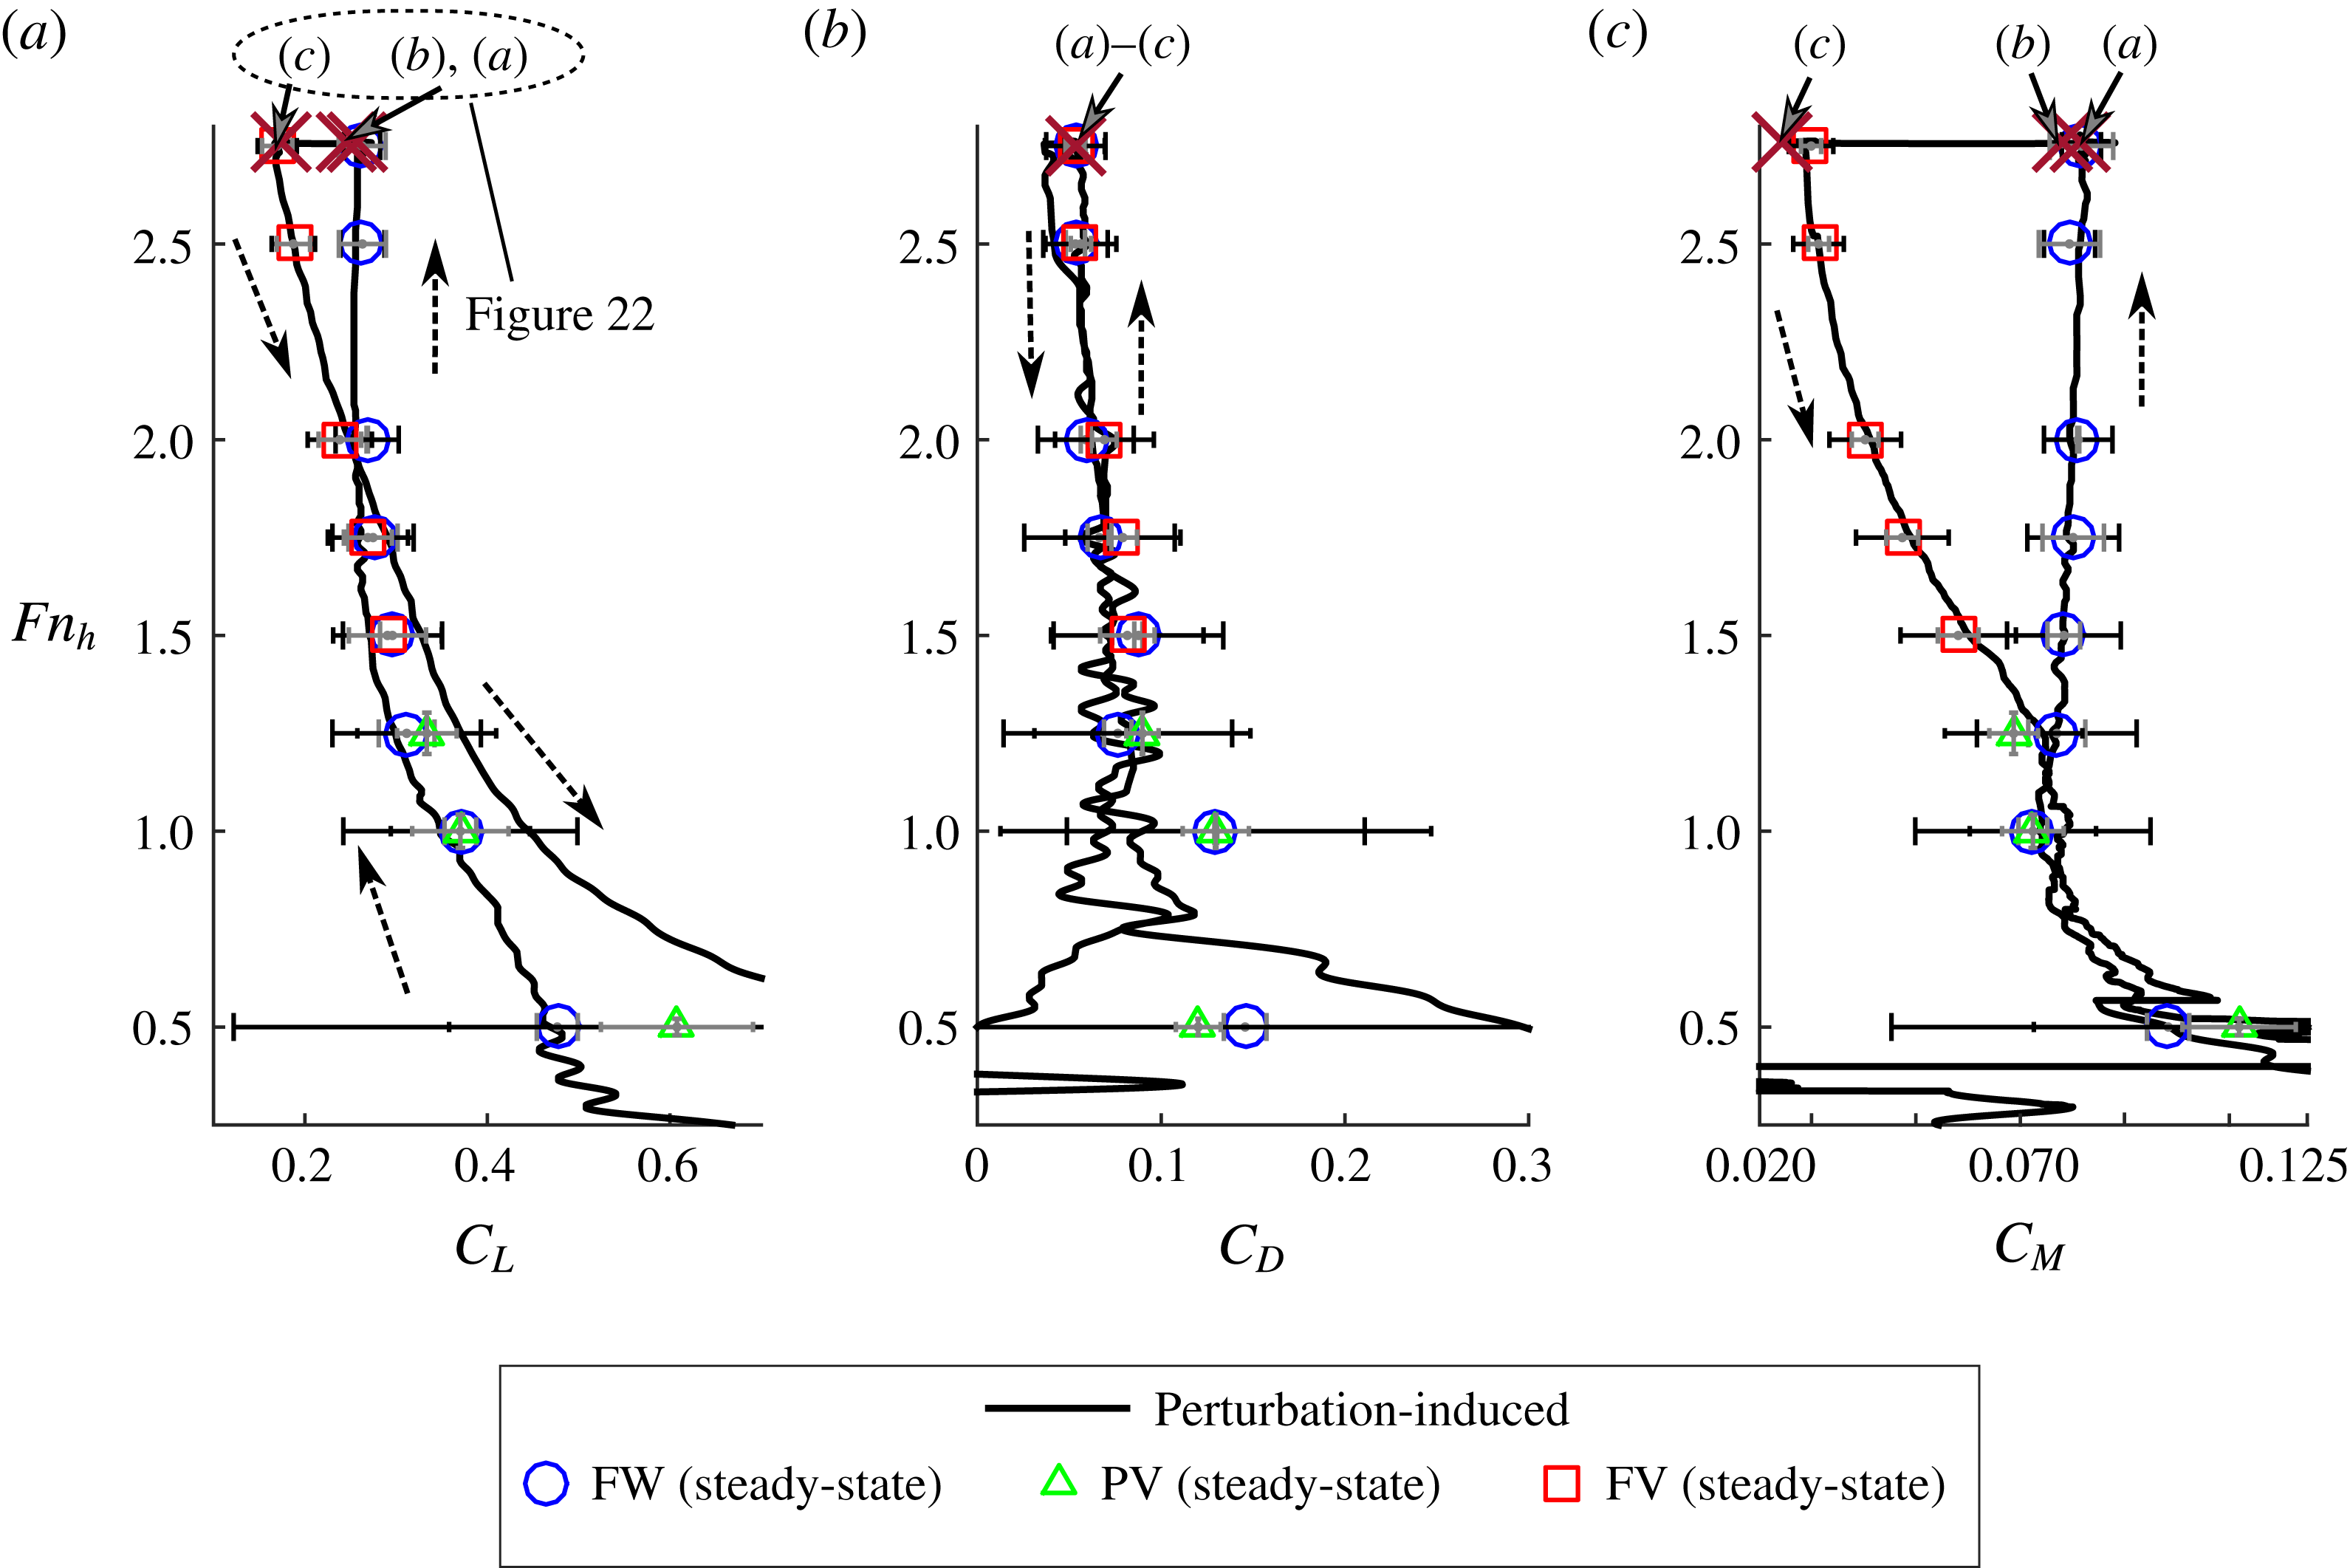
Figure 24. Time histories of lift, drag and moment coefficients for perturbation-induced ventilation formation at
![]() ${\it\alpha}=10^{\circ }$
,
${\it\alpha}=10^{\circ }$
,
![]() $AR_{h}=1$
. The lettered markers correspond to the panels in figure 22. Dashed arrows indicate the acceleration and deceleration stages. Steady-state force/moment coefficients for all runs at
$AR_{h}=1$
. The lettered markers correspond to the panels in figure 22. Dashed arrows indicate the acceleration and deceleration stages. Steady-state force/moment coefficients for all runs at
![]() ${\it\alpha}=10^{\circ }$
are plotted as open symbols, with measurement uncertainties and standard deviations indicated respectively by grey and black horizontal bars.
${\it\alpha}=10^{\circ }$
are plotted as open symbols, with measurement uncertainties and standard deviations indicated respectively by grey and black horizontal bars.
4.1.3 Discussion: ventilation formation
To summarize, ventilation inception is the first stage of formation, and it requires that air enters low-pressure and locally separated flow. Spontaneous inception occurs when some self-induced process of the flow admits air from a natural source. Perturbation-induced inception requires that an external source of air be provided, an example being the air jet used in the present study. Air can only become stably entrained where low pressure permits its ingress and separated flow permits its residence. It is hypothesized that the entrained air modifies the local pressure gradients, inducing further flow separation, as observed in vaporous cavitating flows by Tassin-Leger & Ceccio (Reference Tassin-Leger and Ceccio1998). If an air supply is continuously available, this will result in a cavity that expands by propagating flow separation ahead of it, and then occupying the newly separated flow in a continuous evolution. Equilibrium will be reached when the increasing hydrostatic pressures – and not the extent of flow separation – arrests the growth of the cavity. It is thought that this evolution of separation and propagation occurs very suddenly for short-time-scale formation processes such as tip-vortex-induced ventilation and perturbation-induced ventilation, and very gradually for stall-induced formation. Such a hypothesis requires further validation, but, if verified, it would be consistent with the idea that destabilization of a steady FW flow leads to the formation of an FV flow as a second stable flow state. The second stage of formation, stabilization, occurs when the cavity grows to satisfy the conditions for FV flow in § 3.2. Stall-induced ventilation formation is consistent with the description by Wetzel (Reference Wetzel1957) of ‘creeping’ ventilation, occurring at post-stall yaw angles. Both tip-vortex-induced ventilation formation and perturbation-induced ventilation formation are consistent with Wetzel’s description of ‘flash ventilation’, occurring at sub-stall yaw angles.
At high speeds, vaporous cavitation is often a precursor to atmospheric ventilation (Waid Reference Waid1968; Rothblum et al.
Reference Rothblum, Mayer and Wilburn1969; Hecker & Ober Reference Hecker and Ober1974). At the speeds achieved in the towing tank, however, the range of vaporous cavitation numbers given in table 2 is much too high (
![]() ${\it\sigma}_{v}\geqslant 5.4$
) to induce vaporization. Thus, the results presented here do not account for the influence of vaporous cavitation. The formation mechanism of ‘tail ventilation’ caused by Taylor instabilities (Rothblum et al.
Reference Rothblum, Mayer and Wilburn1969; Swales et al.
Reference Swales, Wright, McGregor and Rothblum1974) was never observed in the present experiments. One possible explanation lies in the section shape of the model. Previous studies have used models with sharp trailing edges and convex curvature on the afterbodies, while the present model has a blunt trailing edge with a rectangular afterbody. As a result, the adverse pressure gradient and wetted flow separation observed at the trailing edge of those models were not present on the current model, meaning that air ingress must occur near the leading edge in the present experiments. Moreover, base ventilation occurs in the present experiments where it was not observed in previous ones, providing an alternate air path (e.g. the location of vortex aeration in tip-vortex-induced formation) to those noted in the literature.
${\it\sigma}_{v}\geqslant 5.4$
) to induce vaporization. Thus, the results presented here do not account for the influence of vaporous cavitation. The formation mechanism of ‘tail ventilation’ caused by Taylor instabilities (Rothblum et al.
Reference Rothblum, Mayer and Wilburn1969; Swales et al.
Reference Swales, Wright, McGregor and Rothblum1974) was never observed in the present experiments. One possible explanation lies in the section shape of the model. Previous studies have used models with sharp trailing edges and convex curvature on the afterbodies, while the present model has a blunt trailing edge with a rectangular afterbody. As a result, the adverse pressure gradient and wetted flow separation observed at the trailing edge of those models were not present on the current model, meaning that air ingress must occur near the leading edge in the present experiments. Moreover, base ventilation occurs in the present experiments where it was not observed in previous ones, providing an alternate air path (e.g. the location of vortex aeration in tip-vortex-induced formation) to those noted in the literature.
Previous studies have also indicated an effect of Weber number and Reynolds number on ventilation formation boundaries, as most were conducted with small-scale models at lower Weber numbers and Reynolds numbers than the present tests. These effects influence the rupture of the free-surface seal and boundary layer separation respectively (Wetzel Reference Wetzel1957; Breslin & Skalak Reference Breslin and Skalak1959). However, the data of Wetzel (Reference Wetzel1957) showed that the effect of the Weber number was significant only when
![]() $We\lesssim 250$
, so surface tension becomes negligible at the present model scale, where
$We\lesssim 250$
, so surface tension becomes negligible at the present model scale, where
![]() $We\gtrsim 10^{4}$
. Moreover, the separation bubble indicated by the surface-flow visualizations is not thought to be a strong function of the Reynolds number. The works of Gault (Reference Gault1957), Chang (Reference Chang1960), Chang (Reference Chang1961) and Hecker & Ober (Reference Hecker and Ober1974) indicate that, for the sharp-nosed geometry used, separation is of the thin-airfoil type, and is primarily a function of the angle of attack. If a streamlined foil section were to be used, the size of the separation bubble would probably be more susceptible to Reynolds number effects.
$We\gtrsim 10^{4}$
. Moreover, the separation bubble indicated by the surface-flow visualizations is not thought to be a strong function of the Reynolds number. The works of Gault (Reference Gault1957), Chang (Reference Chang1960), Chang (Reference Chang1961) and Hecker & Ober (Reference Hecker and Ober1974) indicate that, for the sharp-nosed geometry used, separation is of the thin-airfoil type, and is primarily a function of the angle of attack. If a streamlined foil section were to be used, the size of the separation bubble would probably be more susceptible to Reynolds number effects.
4.2 Ventilation elimination
Elimination encompasses processes that detract from the size or stability of a ventilated cavity. They describe the movement from an FV or PV regime towards a PV or FW regime respectively (see figure 17). As with formation mechanisms, elimination mechanisms can be broken down into two stages, given as follows.
Washout marks the transition from FV flow to PV flow. Washout is said to occur when the criteria for fully ventilated flow given in § 3.2 are no longer satisfied. This typically corresponds to a large-scale shedding of the cavity, after which the cavity topology fluctuates visibly. Squares along the lower edge of the FV region in figure 16 denote the washout event.
Rewetting marks the termination of air entrainment. It was observed that air was frequently ejected from the flow by laminar/turbulent reattachment of the flow at low speeds and angles of attack. It is said to occur when there ceases to be any visual evidence of air entrainment on the suction or pressure surfaces; there may still be bubbly flow entrained in the separated wake of the blunt trailing edge. Typically, the connection between the cavity and the free surface is terminated as the shallowly immersed sections experience flow reattachment. Isolated pockets of air cling to the leading edge of the hydrofoil until widespread reattachment of the flow sweeps the bubbles away. The ‘X’ symbols at the lower edge of the PV region in figure 16 indicate observed rewetting events.

Figure 25. Ventilation elimination process. Flow speed is decreasing from (a) to (c). Here,
![]() $Fn_{h}$
is given at the instant of each photograph. Blue lines denote streamlines, green lines and hatching indicate entrained air, and red arrows indicate air egress paths. The process may be seen in movie 4 of the online supplementary material.
$Fn_{h}$
is given at the instant of each photograph. Blue lines denote streamlines, green lines and hatching indicate entrained air, and red arrows indicate air egress paths. The process may be seen in movie 4 of the online supplementary material.
Ventilation elimination was investigated by starting from an FV state and decelerating the hydrofoil, describing a downward trajectory in figure 16, during which washout and rewetting were recorded to form the stability boundaries. A sketch of ventilation elimination is shown in figure 25. The flow begins in an FV condition. In (a), a re-entrant jet develops on the deeply immersed hydrofoil section (shown by blue arrows). The cavity closure angle is shallow (
![]() $\bar{{\it\Phi}}<45^{\circ }$
), so the jet flow does not impinge on the upstream flow. As the hydrofoil decelerates, the cavity remains attached to the immersed tip, but reduces in its length, causing the angle of the cavity closure line to increase. In (b), the mean cavity closure angle just exceeds
$\bar{{\it\Phi}}<45^{\circ }$
), so the jet flow does not impinge on the upstream flow. As the hydrofoil decelerates, the cavity remains attached to the immersed tip, but reduces in its length, causing the angle of the cavity closure line to increase. In (b), the mean cavity closure angle just exceeds
![]() $45^{\circ }$
, imparting an upstream velocity component to the re-entrant jet, per (3.2). The jet pinches off a large portion of the cavity, causing it to be shed downstream (washout), leaving the flow in a PV state, from which FV flow does not resume. As the flow velocities decrease further in (c), the partial cavity is confined to a shrinking region near the leading edge of the foil and the free surface. Eventually, the remaining air is ejected by laminar/turbulent reattachment of the flow, constituting rewetting and the return to the FW regime.
$45^{\circ }$
, imparting an upstream velocity component to the re-entrant jet, per (3.2). The jet pinches off a large portion of the cavity, causing it to be shed downstream (washout), leaving the flow in a PV state, from which FV flow does not resume. As the flow velocities decrease further in (c), the partial cavity is confined to a shrinking region near the leading edge of the foil and the free surface. Eventually, the remaining air is ejected by laminar/turbulent reattachment of the flow, constituting rewetting and the return to the FW regime.
The time history of lift, drag and yawing moment coefficients can be observed during the deceleration stages of figure 26. Following ventilation formation (which occurred via external perturbation for the case shown), the instantaneous forces and moments pass through the steady-state FV points, but return to the PV or FW regime at very small values of
![]() $Fn_{h}$
. The yawing moment coefficient most clearly shows the measured
$Fn_{h}$
. The yawing moment coefficient most clearly shows the measured
![]() $C_{M}$
returning to the FW and/or PV values. It should be noted that when
$C_{M}$
returning to the FW and/or PV values. It should be noted that when
![]() $Fn_{h}<0.5$
, the denominators of (3.3) are vanishingly small, so any noise in the signal is amplified. For this reason, the return of the hydrodynamic forces and moments to the FW values at low speeds is not obvious in the time histories shown. It should also be noted that in the neighbourhood of washout, indicated by marker (b), the hydrodynamic force/moment coefficients in the FW, PV and FV regimes are nearly coincident; this corroborates the observations from figure 15 that the intersection of
$Fn_{h}<0.5$
, the denominators of (3.3) are vanishingly small, so any noise in the signal is amplified. For this reason, the return of the hydrodynamic forces and moments to the FW values at low speeds is not obvious in the time histories shown. It should also be noted that in the neighbourhood of washout, indicated by marker (b), the hydrodynamic force/moment coefficients in the FW, PV and FV regimes are nearly coincident; this corroborates the observations from figure 15 that the intersection of
![]() $C_{L}$
values between the FW and FV regimes follows the lower boundary of the FV flow regime.
$C_{L}$
values between the FW and FV regimes follows the lower boundary of the FV flow regime.

Figure 26. Time histories of lift, drag and moment coefficients for the ventilation elimination process at
![]() ${\it\alpha}=15^{\circ }$
,
${\it\alpha}=15^{\circ }$
,
![]() $AR_{h}=1$
. Dashed arrows indicate the acceleration and deceleration stages. The lettered markers correspond to the panels in figure 25. Perturbation-induced formation was used to achieve FV flow prior to deceleration. Steady-state force/moment coefficients for all runs at
$AR_{h}=1$
. Dashed arrows indicate the acceleration and deceleration stages. The lettered markers correspond to the panels in figure 25. Perturbation-induced formation was used to achieve FV flow prior to deceleration. Steady-state force/moment coefficients for all runs at
![]() ${\it\alpha}=15^{\circ }$
are plotted as open symbols, with measurement uncertainties and standard deviations indicated respectively by grey and black horizontal bars.
${\it\alpha}=15^{\circ }$
are plotted as open symbols, with measurement uncertainties and standard deviations indicated respectively by grey and black horizontal bars.
4.2.1 Scaling of washout stage
The experimentally observed washout boundaries from the present experiment are plotted as open symbols in figure 27 as functions of the instantaneous lift coefficient
![]() $C_{L}$
and
$C_{L}$
and
![]() $Fn_{h}$
for the three immersed aspect ratios (
$Fn_{h}$
for the three immersed aspect ratios (
![]() $AR_{h}=0.5,1,1.5$
). The plotted data denote the combination of
$AR_{h}=0.5,1,1.5$
). The plotted data denote the combination of
![]() $Fn_{h}$
and
$Fn_{h}$
and
![]() $C_{L}$
at the moment that washout was visually observed, e.g. in panel (b) of figure 25 and marker (b) in figure 26. Data from Breslin & Skalak (Reference Breslin and Skalak1959) for hydrofoils with circular-arc and cambered NACA sections at four immersed aspect ratios (
$C_{L}$
at the moment that washout was visually observed, e.g. in panel (b) of figure 25 and marker (b) in figure 26. Data from Breslin & Skalak (Reference Breslin and Skalak1959) for hydrofoils with circular-arc and cambered NACA sections at four immersed aspect ratios (
![]() $AR_{h}=0.5,1,1.5,2$
) are plotted as filled symbols. The points indicate the boundary at which Breslin & Skalak (Reference Breslin and Skalak1959) observed the elimination of ventilated cavities; the specific stage of elimination was not specified in the original report, but is judged from context to be the cessation of FV flow, which has been defined as washout in the present work. Equation (1.2), shown as the black dashed line, represents the lower bound on stable FV flow proposed by Breslin & Skalak (Reference Breslin and Skalak1959).
$AR_{h}=0.5,1,1.5,2$
) are plotted as filled symbols. The points indicate the boundary at which Breslin & Skalak (Reference Breslin and Skalak1959) observed the elimination of ventilated cavities; the specific stage of elimination was not specified in the original report, but is judged from context to be the cessation of FV flow, which has been defined as washout in the present work. Equation (1.2), shown as the black dashed line, represents the lower bound on stable FV flow proposed by Breslin & Skalak (Reference Breslin and Skalak1959).
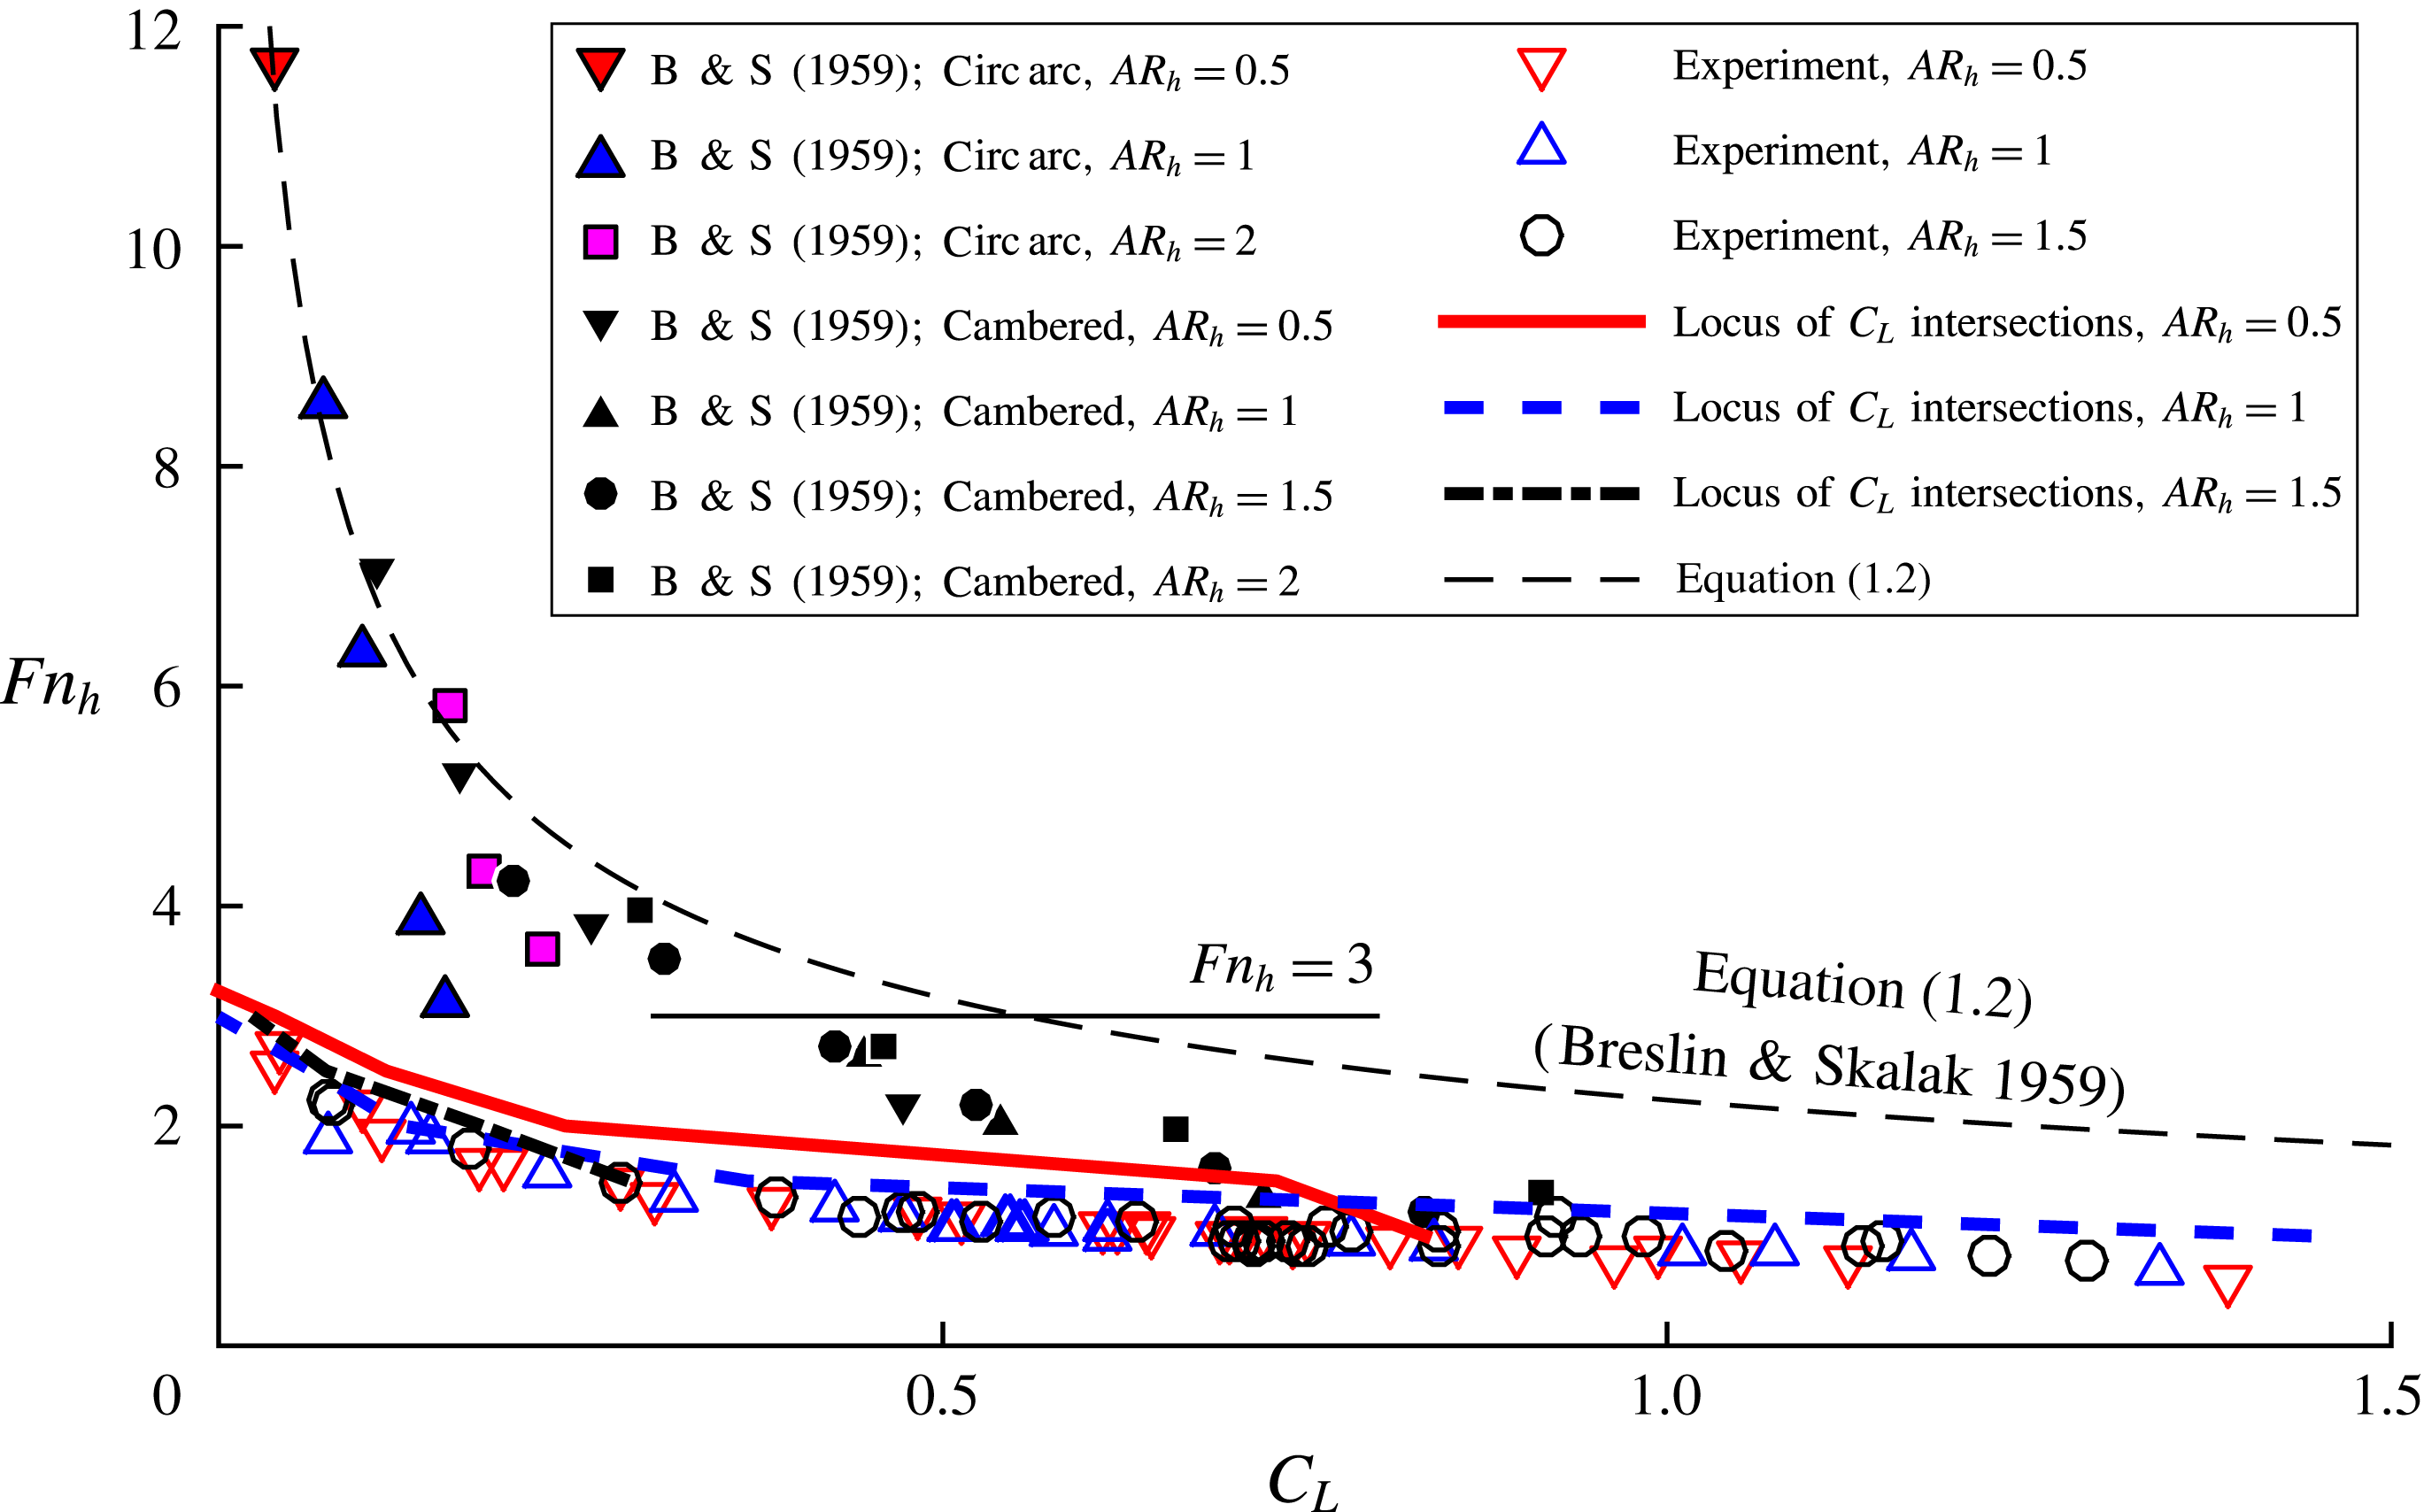
Figure 27. Scaled washout boundary in
![]() $C_{L}$
,
$C_{L}$
,
![]() $Fn_{h}$
space. Data from the present experiments at three immersed aspect ratios, plotted as open symbols, and the experimentally observed boundary from Breslin & Skalak (Reference Breslin and Skalak1959) for cambered and circular-arc hydrofoils at four immersed aspect ratios, plotted as filled symbols, are shown. Equation (1.2) overpredicts the washout Froude numbers from the present experiments. The projected loci of lift-intersection points closely match the washout boundaries, suggesting that the lift coefficient is similar between the three flow regimes at washout.
$Fn_{h}$
space. Data from the present experiments at three immersed aspect ratios, plotted as open symbols, and the experimentally observed boundary from Breslin & Skalak (Reference Breslin and Skalak1959) for cambered and circular-arc hydrofoils at four immersed aspect ratios, plotted as filled symbols, are shown. Equation (1.2) overpredicts the washout Froude numbers from the present experiments. The projected loci of lift-intersection points closely match the washout boundaries, suggesting that the lift coefficient is similar between the three flow regimes at washout.
It should be noted that the boundary given by (1.2) is valid only for
![]() $Fn_{h}\geqslant 3$
(Breslin Reference Breslin1958), above the horizontal line in figure 27. This restricts usage of the boundary to relatively low values of
$Fn_{h}\geqslant 3$
(Breslin Reference Breslin1958), above the horizontal line in figure 27. This restricts usage of the boundary to relatively low values of
![]() $C_{L}$
. It should be recalled also that Breslin & Skalak (Reference Breslin and Skalak1959) defined (1.2) such that
$C_{L}$
. It should be recalled also that Breslin & Skalak (Reference Breslin and Skalak1959) defined (1.2) such that
![]() $C_{L_{w}}$
is the instantaneous lift coefficient, measured when the hydrofoil is in an FW flow at the conditions under which ventilation elimination occurred. This makes (1.2) difficult to apply directly, because the lift coefficient may be unknown for FW flows at the combination of
$C_{L_{w}}$
is the instantaneous lift coefficient, measured when the hydrofoil is in an FW flow at the conditions under which ventilation elimination occurred. This makes (1.2) difficult to apply directly, because the lift coefficient may be unknown for FW flows at the combination of
![]() ${\it\alpha}$
and
${\it\alpha}$
and
![]() $Fn_{h}$
observed at the moment of washout. It should be recalled that in figure 15, the approximated intersection points between affine fits through the FV and FW lift coefficients formed a locus of intersection points. In order to justify the application of (1.2) to lift coefficients measured in the FV regime, the orthographic projections of these loci are plotted as bold lines in figure 27, where the lines closely follow the experimentally observed washout boundaries. This means that, at the conditions of washout, the lift coefficients in the FV, PV and FW regimes are approximately equal, so the measured
$Fn_{h}$
observed at the moment of washout. It should be recalled that in figure 15, the approximated intersection points between affine fits through the FV and FW lift coefficients formed a locus of intersection points. In order to justify the application of (1.2) to lift coefficients measured in the FV regime, the orthographic projections of these loci are plotted as bold lines in figure 27, where the lines closely follow the experimentally observed washout boundaries. This means that, at the conditions of washout, the lift coefficients in the FV, PV and FW regimes are approximately equal, so the measured
![]() $C_{L}$
at washout is a suitable approximation of
$C_{L}$
at washout is a suitable approximation of
![]() $C_{L_{w}}$
. As shown in figure 27, equation (1.2) overpredicts the washout
$C_{L_{w}}$
. As shown in figure 27, equation (1.2) overpredicts the washout
![]() $Fn_{h}$
for a given
$Fn_{h}$
for a given
![]() $C_{L}$
. In fact, it passes through only a few of the experimental points from Breslin & Skalak (Reference Breslin and Skalak1959), while washout was never observed at
$C_{L}$
. In fact, it passes through only a few of the experimental points from Breslin & Skalak (Reference Breslin and Skalak1959), while washout was never observed at
![]() $Fn_{h}>3$
in the present experiments.
$Fn_{h}>3$
in the present experiments.
There are several reasons why the experimentally observed washout boundaries would differ between the present study and that of Breslin & Skalak (Reference Breslin and Skalak1959). The first is the difference in section profiles. As mentioned in § 4.1.3, the present model has a rectangular section aft of mid-chord, while both of the models used by Breslin & Skalak (Reference Breslin and Skalak1959) had sharp trailing edges and convex curvature on the suction surfaces aft of mid-chord. As a result, washout may have occurred at higher Froude numbers for the latter model because the re-entrant jet was enhanced by an adverse pressure gradient developed on the wetted portion of the suction surface. Another factor is the difference in size between the two models. The present model is approximately 4–5 times as large as those used by Breslin & Skalak; the smaller model would be more susceptible to surface-tension effects (Wetzel Reference Wetzel1957), where spray sheets close and cut off the supply of air to the cavity in a process called cavity ‘choking’ (Elata Reference Elata1967). Equation (1.2) also overpredicts the washout boundary of Breslin & Skalak (Reference Breslin and Skalak1959) for
![]() $3<Fn_{h}<6$
. This occurs because (1.2) was derived from a linearized fit at very large
$3<Fn_{h}<6$
. This occurs because (1.2) was derived from a linearized fit at very large
![]() $Fn_{h}$
and vanishingly small
$Fn_{h}$
and vanishingly small
![]() $C_{L}$
. Equation (1.2) does form an upper bound on all other presented experimental data, so it is appropriate to consider it as a boundary above which FV flow is likely to be stable, but not a boundary below which full ventilation is necessarily unstable. To develop an improved washout scaling relation, the kinematic stability boundary on the cavity shape (
$C_{L}$
. Equation (1.2) does form an upper bound on all other presented experimental data, so it is appropriate to consider it as a boundary above which FV flow is likely to be stable, but not a boundary below which full ventilation is necessarily unstable. To develop an improved washout scaling relation, the kinematic stability boundary on the cavity shape (
![]() $\bar{{\it\Phi}}=45^{\circ }$
) can be used, along with models for the cavity length (
$\bar{{\it\Phi}}=45^{\circ }$
) can be used, along with models for the cavity length (
![]() $L_{c}$
), lift coefficient (
$L_{c}$
), lift coefficient (
![]() $C_{L}$
), Froude number (
$C_{L}$
), Froude number (
![]() $Fn_{h}$
), aspect ratio (
$Fn_{h}$
), aspect ratio (
![]() $AR_{h}$
) and angle of attack (
$AR_{h}$
) and angle of attack (
![]() ${\it\alpha}$
). An initial attempt was presented by Harwood et al. (Reference Harwood, Brucker, Miguel, Young and Ceccio2014), but an improved scaling approach was deemed necessary.
${\it\alpha}$
). An initial attempt was presented by Harwood et al. (Reference Harwood, Brucker, Miguel, Young and Ceccio2014), but an improved scaling approach was deemed necessary.
Figure 28 schematically depicts an FV cavity. A sectional cut is taken at a dimensionless depth of
![]() ${\it\kappa}=z^{\prime }/h$
and a linear approximation of the cavity closure angle is made between this section and the immersed tip – a distance of
${\it\kappa}=z^{\prime }/h$
and a linear approximation of the cavity closure angle is made between this section and the immersed tip – a distance of
![]() $(1-{\it\kappa})h$
. The stability limit of
$(1-{\it\kappa})h$
. The stability limit of
![]() $\bar{{\it\Phi}}=45^{\circ }$
is equivalent to a unity-slope condition on this linearization. To model the cavity length at the section in question, equation (1.8) is used, giving
$\bar{{\it\Phi}}=45^{\circ }$
is equivalent to a unity-slope condition on this linearization. To model the cavity length at the section in question, equation (1.8) is used, giving

Figure 28. Sketch of the cavity topology. The cavity stability criterion of § 3.2 is expressed using a two-point linearization of the cavity closure line. When the slope of the linearized cavity closure line approaches unity (
![]() $\bar{{\it\Phi}}=45^{\circ }$
), it is hypothesized that washout is imminent.
$\bar{{\it\Phi}}=45^{\circ }$
), it is hypothesized that washout is imminent.
The next step is to infer the sectional lift coefficient at the representative section from the 3D lift coefficient, which requires a priori knowledge of the distribution of lift along the span. A model such as the lifting-line model presented in § 1.2.2 could be used, but an analytical approximation is desirable in this case, in order to derive a closed-form scaling relation. An elliptical shape function may be applied to the lift distribution as a simple approximation for rectangular wings (Glauert Reference Glauert1943), and one that retains the salient features of the lift distribution shown in figure 3. The low aspect ratio is not a concern because the elliptical distribution can be scaled such that integration along the span yields the experimentally measured 3D lift coefficient. Thus, the sectional lift coefficient at the representative section is taken to be
The effective angle of attack can be found by substituting
![]() $L_{c}/c=(1-{\it\kappa})AR_{h}$
into (1.9) to find
$L_{c}/c=(1-{\it\kappa})AR_{h}$
into (1.9) to find
![]() $a_{0}$
, giving
$a_{0}$
, giving
 $$\begin{eqnarray}\displaystyle & & \displaystyle {\it\alpha}_{2D}(z^{\prime }={\it\kappa}h)=\arcsin \left(\frac{C_{l_{2D}}(z^{\prime }={\it\kappa}h)}{a_{0}(z^{\prime }={\it\kappa}h)}\right)\approx \frac{C_{l_{2D}}(z^{\prime }={\it\kappa}h)}{a_{0}(z^{\prime }={\it\kappa}h)}\nonumber\\ \displaystyle & & \displaystyle \quad =\frac{4C_{L}\sqrt{{\it\kappa}-{\it\kappa}^{2}}\{4{\rm\pi}[(1-{\it\kappa})AR_{h}]^{3}-4{\rm\pi}[(1-{\it\kappa})AR_{h}]^{2}+3{\rm\pi}[(1-{\it\kappa})AR_{h}]+2\}}{{\rm\pi}\{{\rm\pi}^{2}[(1-{\it\kappa})AR_{h}]^{3}-4{\rm\pi}[(1-{\it\kappa})AR_{h}]^{2}+9{\rm\pi}(1-{\it\kappa})AR_{h}+2{\rm\pi}\}}.\nonumber\\ \displaystyle & & \displaystyle\end{eqnarray}$$
It follows from (1.12) that
which may be substituted into (4.1), along with (4.3). The representative section of the hydrofoil is taken at mid-span (
![]() ${\it\kappa}=0.5$
), with the reasoning that any re-entrant jet posing a threat of destabilization to the flow is anticipated to be reflected about the deeply submerged portions of the cavity. Solving for
${\it\kappa}=0.5$
), with the reasoning that any re-entrant jet posing a threat of destabilization to the flow is anticipated to be reflected about the deeply submerged portions of the cavity. Solving for
![]() $Fn_{h}$
yields the semi-theoretical washout Froude number,
$Fn_{h}$
yields the semi-theoretical washout Froude number,
 $$\begin{eqnarray}Fn_{h}=\frac{{\rm\pi}}{4}\sqrt{\frac{{\displaystyle \frac{{\rm\pi}}{2}}AR_{h}^{4}-4AR_{h}^{3}+18AR_{h}^{2}+8AR_{h}}{2.31C_{L}({\rm\pi}AR_{h}^{3}-2{\rm\pi}AR_{h}^{2}+3{\rm\pi}AR_{h}+4)}}.\end{eqnarray}$$
The boundaries given by (4.5) are shown in figure 29, again with the data of Breslin & Skalak (Reference Breslin and Skalak1959) and (1.2). The present experimental washout boundary is captured very well by (4.5). The data of Breslin & Skalak (Reference Breslin and Skalak1959) are reasonably well approximated by the present theory for
![]() $Fn_{h}\leqslant 3$
, while (1.2) better approximates the points at very small values of
$Fn_{h}\leqslant 3$
, while (1.2) better approximates the points at very small values of
![]() $C_{L}$
and
$C_{L}$
and
![]() $Fn_{h}>3$
.
$Fn_{h}>3$
.

Figure 29. Scaled washout boundary in
![]() $C_{L}-Fn_{h}$
space. Data from the present experiments and from Breslin & Skalak (Reference Breslin and Skalak1959) are plotted. The stability boundary of Breslin & Skalak (Reference Breslin and Skalak1959) (1.2) overpredicts the washout Froude numbers, while the present semi-theoretical boundary (4.5) captures the present experimental data across the range of
$C_{L}-Fn_{h}$
space. Data from the present experiments and from Breslin & Skalak (Reference Breslin and Skalak1959) are plotted. The stability boundary of Breslin & Skalak (Reference Breslin and Skalak1959) (1.2) overpredicts the washout Froude numbers, while the present semi-theoretical boundary (4.5) captures the present experimental data across the range of
![]() $C_{L}$
, and captures the data of Breslin & Skalak (Reference Breslin and Skalak1959) for
$C_{L}$
, and captures the data of Breslin & Skalak (Reference Breslin and Skalak1959) for
![]() $C_{L}\gtrsim 0.6$
.
$C_{L}\gtrsim 0.6$
.
The value of
![]() $C_{L}$
is often not known a priori, requiring it to be inferred as well. Again, an approach such as the lifting-line model from § 1.2 may be used to predict
$C_{L}$
is often not known a priori, requiring it to be inferred as well. Again, an approach such as the lifting-line model from § 1.2 may be used to predict
![]() $C_{L}$
for given operating conditions. However, it is more convenient to implement an analytical model of
$C_{L}$
for given operating conditions. However, it is more convenient to implement an analytical model of
![]() $C_{L}$
as function of
$C_{L}$
as function of
![]() ${\it\alpha}$
,
${\it\alpha}$
,
![]() $AR_{h}$
and
$AR_{h}$
and
![]() $Fn_{h}$
, so that the washout boundary may be represented as a function of
$Fn_{h}$
, so that the washout boundary may be represented as a function of
![]() ${\it\alpha}$
and
${\it\alpha}$
and
![]() $Fn_{h}$
without the necessity of solving (1.19) for each condition. In § 4, it was shown that the instantaneous hydrodynamic load coefficients in unsteady flows did not differ materially from those measured in steady flows. A model that suitably predicts the steady-state lift coefficient at low
$Fn_{h}$
without the necessity of solving (1.19) for each condition. In § 4, it was shown that the instantaneous hydrodynamic load coefficients in unsteady flows did not differ materially from those measured in steady flows. A model that suitably predicts the steady-state lift coefficient at low
![]() $Fn_{h}$
may, as a result, be substituted into the
$Fn_{h}$
may, as a result, be substituted into the
![]() $C_{L}$
term in (4.5). It should be recalled that (1.20) may be used to model
$C_{L}$
term in (4.5). It should be recalled that (1.20) may be used to model
![]() $C_{L}$
by assuming a representative value of
$C_{L}$
by assuming a representative value of
![]() $a_{0}$
. Equation (1.22) can be used again to calculate the lift-weighted mean,
$a_{0}$
. Equation (1.22) can be used again to calculate the lift-weighted mean,
![]() $a_{0}^{\ast }$
, but doing so requires that the cavity length and lift distributions are known. The distribution of cavity lengths is constrained by the assumption of
$a_{0}^{\ast }$
, but doing so requires that the cavity length and lift distributions are known. The distribution of cavity lengths is constrained by the assumption of
![]() $\bar{{\it\Phi}}=45^{\circ }$
to be
$\bar{{\it\Phi}}=45^{\circ }$
to be
Equation (4.6) may be substituted into (1.9) to obtain
![]() $a_{0}({\it\kappa})$
. The assumed elliptical lift distribution is scaled to yield an integral of one, giving the shape function,
$a_{0}({\it\kappa})$
. The assumed elliptical lift distribution is scaled to yield an integral of one, giving the shape function,
By weighting
![]() $a_{0}({\it\kappa})$
with
$a_{0}({\it\kappa})$
with
![]() $E({\it\kappa})$
, equation (1.22) becomes, under a change of variables,
$E({\it\kappa})$
, equation (1.22) becomes, under a change of variables,
which is evaluated using numerical integration. The lift-weighted mean value
![]() $a_{0}^{\ast }$
is substituted into (1.20), and the predicted
$a_{0}^{\ast }$
is substituted into (1.20), and the predicted
![]() $C_{L}$
is in turn substituted into (4.5). Doing so yields a function of
$C_{L}$
is in turn substituted into (4.5). Doing so yields a function of
![]() $Fn_{h}$
,
$Fn_{h}$
,
![]() ${\it\alpha}$
and
${\it\alpha}$
and
![]() $AR_{h}$
. As before, solving for
$AR_{h}$
. As before, solving for
![]() $Fn_{h}$
results in a washout Froude number, plotted in figure 30 as a boundary in
$Fn_{h}$
results in a washout Froude number, plotted in figure 30 as a boundary in
![]() ${\it\alpha}$
–
${\it\alpha}$
–
![]() $Fn_{h}$
space. A value of
$Fn_{h}$
space. A value of
![]() ${\it\kappa}=0.5$
is again assumed. The boundaries from the present experiments at three aspect ratios (
${\it\kappa}=0.5$
is again assumed. The boundaries from the present experiments at three aspect ratios (
![]() $AR_{h}=0.5,1,1.5$
) are shown as open symbols. Experimental points from Breslin & Skalak (Reference Breslin and Skalak1959) (circular-arc hydrofoil at
$AR_{h}=0.5,1,1.5$
) are shown as open symbols. Experimental points from Breslin & Skalak (Reference Breslin and Skalak1959) (circular-arc hydrofoil at
![]() $AR_{h}=0.5$
, 1, 1.5 and 2) and Swales et al. (Reference Swales, Wright, McGregor and Rothblum1974) (biogival hydrofoil at
$AR_{h}=0.5$
, 1, 1.5 and 2) and Swales et al. (Reference Swales, Wright, McGregor and Rothblum1974) (biogival hydrofoil at
![]() $AR_{h}=2$
) are shown for comparison. The two sets of data shown for Swales et al. (Reference Swales, Wright, McGregor and Rothblum1974) are from tests conducted in a towing tank at atmospheric pressure and tests in a variable-pressure water tunnel under reduced ambient pressure. The experimental data represent a very diverse range of operating conditions, model sizes and model geometries (see table 1), which are in good general agreement with the semi-theoretical washout boundary.
$AR_{h}=2$
) are shown for comparison. The two sets of data shown for Swales et al. (Reference Swales, Wright, McGregor and Rothblum1974) are from tests conducted in a towing tank at atmospheric pressure and tests in a variable-pressure water tunnel under reduced ambient pressure. The experimental data represent a very diverse range of operating conditions, model sizes and model geometries (see table 1), which are in good general agreement with the semi-theoretical washout boundary.

Figure 30. Scaled washout boundary in
![]() ${\it\alpha}$
–
${\it\alpha}$
–
![]() $Fn_{h}$
space. Data from the present experiments and previous experiments are plotted as symbols. B & S, Breslin & Skalak (Reference Breslin and Skalak1959); S & W, Swales et al. (Reference Swales, Wright, McGregor and Rothblum1974) experiments in a variable-pressure water tunnel; 1, tests conducted at atmospheric pressure; 2, tests conducted at a reduced pressure of 4.67 kPa.
$Fn_{h}$
space. Data from the present experiments and previous experiments are plotted as symbols. B & S, Breslin & Skalak (Reference Breslin and Skalak1959); S & W, Swales et al. (Reference Swales, Wright, McGregor and Rothblum1974) experiments in a variable-pressure water tunnel; 1, tests conducted at atmospheric pressure; 2, tests conducted at a reduced pressure of 4.67 kPa.
4.2.2 Discussion: ventilation elimination
Ventilation elimination appears to be strongly tied to the potential of the re-entrant jet for destabilization of the flow. The derived scaling relationship approximates the present data much better than does (1.2) for
![]() $Fn_{h}\leqslant 3$
. When
$Fn_{h}\leqslant 3$
. When
![]() $Fn_{h}>3$
, washout appears to occur at vanishingly small angles of attack. The scaling relation is not expected to yield satisfactory results at such small angles of attack because the re-entrant jet may be too thin at such angles to destabilize the cavity (Franc & Michel Reference Franc and Michel2006), as mentioned in § 3.5. Additionally, washout may occur at higher Froude numbers than those predicted by the derived scaling relation for streamlined sections as a result of adverse pressure gradients developed over the afterbody of sections with zero trailing edge thickness. It is also possible that the data from Breslin & Skalak (Reference Breslin and Skalak1959) shown in figures 27 and 29 do not represent washout as it has been defined in this work: if the data denote a stage of elimination other than washout, the scaling approach cannot be expected to adequately capture the respective boundary.
$Fn_{h}>3$
, washout appears to occur at vanishingly small angles of attack. The scaling relation is not expected to yield satisfactory results at such small angles of attack because the re-entrant jet may be too thin at such angles to destabilize the cavity (Franc & Michel Reference Franc and Michel2006), as mentioned in § 3.5. Additionally, washout may occur at higher Froude numbers than those predicted by the derived scaling relation for streamlined sections as a result of adverse pressure gradients developed over the afterbody of sections with zero trailing edge thickness. It is also possible that the data from Breslin & Skalak (Reference Breslin and Skalak1959) shown in figures 27 and 29 do not represent washout as it has been defined in this work: if the data denote a stage of elimination other than washout, the scaling approach cannot be expected to adequately capture the respective boundary.
The scaling relationship is based on an assumed elliptical shape function governing the lift distribution. An alternate lift distribution more appropriate to low-aspect-ratio lifting surfaces might yield better results. The use of
![]() $C_{L}$
as an independent variable is useful for cases when instantaneous forces are available. Further modelling of
$C_{L}$
as an independent variable is useful for cases when instantaneous forces are available. Further modelling of
![]() $C_{L}$
as a function of
$C_{L}$
as a function of
![]() ${\it\alpha}$
is useful for predicting the washout boundary when force measurements are unavailable, but the attitude of the hydrofoil is known. As shown in figure 29, equation (1.2) overpredicts the washout Froude numbers of the present experiments, while the proposed semi-theoretical washout boundary describes the experimental data of Breslin & Skalak (Reference Breslin and Skalak1959) quite well in
${\it\alpha}$
is useful for predicting the washout boundary when force measurements are unavailable, but the attitude of the hydrofoil is known. As shown in figure 29, equation (1.2) overpredicts the washout Froude numbers of the present experiments, while the proposed semi-theoretical washout boundary describes the experimental data of Breslin & Skalak (Reference Breslin and Skalak1959) quite well in
![]() ${\it\alpha}$
–
${\it\alpha}$
–
![]() $Fn_{h}$
space. Equation (1.2) uses
$Fn_{h}$
space. Equation (1.2) uses
![]() $C_{L_{w}}$
, or the lift coefficient of wetted flow at the conditions of ventilation washout. Unfortunately, lift in the FW regime may be unknown, and FW flow cannot be sustained for
$C_{L_{w}}$
, or the lift coefficient of wetted flow at the conditions of ventilation washout. Unfortunately, lift in the FW regime may be unknown, and FW flow cannot be sustained for
![]() ${\it\alpha}>{\it\alpha}_{s}$
. Consequently, equation (1.2) is not valid for post-stall angles of attack.
${\it\alpha}>{\it\alpha}_{s}$
. Consequently, equation (1.2) is not valid for post-stall angles of attack.
It is also worth noting that the experimental washout boundary of Breslin & Skalak (Reference Breslin and Skalak1959) in figures 27, 29 and 30 deviates from the present semi-theoretical and experimental boundaries quite severely at immersed aspect ratios of
![]() $AR_{h}=0.5$
and 2.0. This is a result of a distinct bucket shape in the minimum ventilated yaw angle plotted against
$AR_{h}=0.5$
and 2.0. This is a result of a distinct bucket shape in the minimum ventilated yaw angle plotted against
![]() $AR_{h}$
in the results from Breslin & Skalak (Reference Breslin and Skalak1959). The reasons for the non-monotonic behaviour are not discussed in the original report, but may be a result of surface-tension effects, given the smaller model scale used.
$AR_{h}$
in the results from Breslin & Skalak (Reference Breslin and Skalak1959). The reasons for the non-monotonic behaviour are not discussed in the original report, but may be a result of surface-tension effects, given the smaller model scale used.
5 Conclusions
A systematic study has been conducted to examine atmospheric ventilation on a surface-piercing hydrofoil. The authors have endeavoured to standardize disparate terminology used to discuss ventilation and to classify the attending processes. The salient flow features of FW, PV and FV flow regimes were described and illustrated. Consideration of the trajectory of the re-entrant jet led to a stability condition on the cavity topology. The condition requires that the mean angle of the cavity closure line from the horizontal plane does not exceed
![]() $\bar{{\it\Phi}}=45^{\circ }$
. By augmenting the flow-regime descriptions in the literature with the new condition, a strengthened set of criteria were defined, under which 3D flows may be unequivocally categorized into the three flow regimes.
$\bar{{\it\Phi}}=45^{\circ }$
. By augmenting the flow-regime descriptions in the literature with the new condition, a strengthened set of criteria were defined, under which 3D flows may be unequivocally categorized into the three flow regimes.
The realizable steady-state lift was found to be much lower in the FV regime than in the FW regime. Drag was not strongly affected by ventilation, and the change in yawing moment indicated a progressive movement of the centre of pressure towards mid-chord with the onset of ventilation. The steady-state lift in the FV regime was shown to decrease monotonically with increasing Froude number. These observations were consistent with previous studies. The FW and FV flow regimes overlap one another, constituting a bi-stable range of
![]() ${\it\alpha}$
, also consistent with past work. The bi-stable range of operating conditions is bounded by the bifurcation boundary and the stall boundary (respective loci of bifurcation angles
${\it\alpha}$
, also consistent with past work. The bi-stable range of operating conditions is bounded by the bifurcation boundary and the stall boundary (respective loci of bifurcation angles
![]() ${\it\alpha}_{b}$
and stall angles
${\it\alpha}_{b}$
and stall angles
![]() ${\it\alpha}_{s}$
). The experimentally observed flow regimes were mapped as functions of
${\it\alpha}_{s}$
). The experimentally observed flow regimes were mapped as functions of
![]() ${\it\alpha}$
and
${\it\alpha}$
and
![]() $Fn_{h}$
, revealing three distinct stability regions. Near the boundary between FV and FW flows, the steady lift coefficients are nearly the same in all three steady-state flow regimes.
$Fn_{h}$
, revealing three distinct stability regions. Near the boundary between FV and FW flows, the steady lift coefficients are nearly the same in all three steady-state flow regimes.
Ventilation transition mechanisms were classified as ‘formation’ or ‘elimination’ mechanisms for processes that respectively enhance or detract from the size and/or stability of a ventilated cavity. Formation was further decomposed into ‘inception’ and ‘stabilization’ events. Elimination was likewise decomposed into ‘washout’ and ‘rewetting’. The individual stages of formation and elimination separate the three steady-state flow regimes. The transition between stable steady-state flow regimes was shown to occur where stability regions overlapped or abutted one another. Ventilation transition events either occurred spontaneously at the boundary of a stability region or occurred as the result of external perturbation when the flow was in a bi-stable condition.
In the present experiments, ventilation formation was preceded in all cases by leading edge flow separation, indicated by surface-flow visualizations. At sub-stall angles of attack
![]() ${\it\alpha}_{b}\leqslant {\it\alpha}<{\it\alpha}_{s}$
, ventilation formation occurred when air was introduced from an external source (a high-pressure blower) into a stable separation bubble at the leading edge. Near the stall boundary (
${\it\alpha}_{b}\leqslant {\it\alpha}<{\it\alpha}_{s}$
, ventilation formation occurred when air was introduced from an external source (a high-pressure blower) into a stable separation bubble at the leading edge. Near the stall boundary (
![]() ${\it\alpha}\approx {\it\alpha}_{s}$
) for
${\it\alpha}\approx {\it\alpha}_{s}$
) for
![]() $AR_{h}=1$
only, air entered through the low-pressure core of the tip vortex. At post-stall angles of attack (
$AR_{h}=1$
only, air entered through the low-pressure core of the tip vortex. At post-stall angles of attack (
![]() ${\it\alpha}\geqslant {\it\alpha}_{s}$
), vortical structures in the eddying stalled wake disrupted the free-surface seal at all immersed aspect ratios, allowing air to enter the large separation bubble. The stall angle
${\it\alpha}\geqslant {\it\alpha}_{s}$
), vortical structures in the eddying stalled wake disrupted the free-surface seal at all immersed aspect ratios, allowing air to enter the large separation bubble. The stall angle
![]() ${\it\alpha}_{s}$
was found to be approximately
${\it\alpha}_{s}$
was found to be approximately
![]() $14^{\circ }$
–
$14^{\circ }$
–
![]() $15^{\circ }$
for all Froude numbers at
$15^{\circ }$
for all Froude numbers at
![]() $AR_{h}=1$
and
$AR_{h}=1$
and
![]() $AR_{h}=1.5$
. Smaller immersed aspect ratios yielded slightly larger values of
$AR_{h}=1.5$
. Smaller immersed aspect ratios yielded slightly larger values of
![]() ${\it\alpha}_{s}$
.
${\it\alpha}_{s}$
.
Ventilation washout (the first stage of elimination) occurs when an FV cavity is destabilized by the re-entrant jet at moderate to large
![]() ${\it\alpha}$
(
${\it\alpha}$
(
![]() ${\it\alpha}\geqslant 5^{\circ }$
). A destabilizing re-entrant jet develops when the angle of the cavity closure is
${\it\alpha}\geqslant 5^{\circ }$
). A destabilizing re-entrant jet develops when the angle of the cavity closure is
![]() $\bar{{\it\Phi}}\geqslant 45^{\circ }$
, violating the stability condition established for FV flows. At lower angles of attack, other washout mechanisms may be expected to dominate, including choking or gradual turbulent reattachment of the flow, dependent upon the section shape, the scale of the model and the speed. The lower stability boundary for FV flow proposed by Breslin & Skalak (Reference Breslin and Skalak1959) is confined to small values of
$\bar{{\it\Phi}}\geqslant 45^{\circ }$
, violating the stability condition established for FV flows. At lower angles of attack, other washout mechanisms may be expected to dominate, including choking or gradual turbulent reattachment of the flow, dependent upon the section shape, the scale of the model and the speed. The lower stability boundary for FV flow proposed by Breslin & Skalak (Reference Breslin and Skalak1959) is confined to small values of
![]() $C_{L}$
and large values of
$C_{L}$
and large values of
![]() $Fn_{h}$
(
$Fn_{h}$
(
![]() $C_{L}<0.5;Fn_{h}>3$
). A new scaling relationship was developed that adequately describes the experimentally observed washout boundary from the present experiments across the entire range of
$C_{L}<0.5;Fn_{h}>3$
). A new scaling relationship was developed that adequately describes the experimentally observed washout boundary from the present experiments across the entire range of
![]() $C_{L}$
,
$C_{L}$
,
![]() ${\it\alpha}$
and
${\it\alpha}$
and
![]() $Fn_{h}$
. The new scaling relation also captures the washout boundaries from experiments by Breslin & Skalak (Reference Breslin and Skalak1959) at moderate to large
$Fn_{h}$
. The new scaling relation also captures the washout boundaries from experiments by Breslin & Skalak (Reference Breslin and Skalak1959) at moderate to large
![]() $C_{L}$
and
$C_{L}$
and
![]() ${\it\alpha}$
(
${\it\alpha}$
(
![]() $C_{L}\gtrsim 0.5$
;
$C_{L}\gtrsim 0.5$
;
![]() ${\it\alpha}\gtrsim 5^{\circ }$
) and experiments by Swales et al. (Reference Swales, Wright, McGregor and Rothblum1974) across a wide range of
${\it\alpha}\gtrsim 5^{\circ }$
) and experiments by Swales et al. (Reference Swales, Wright, McGregor and Rothblum1974) across a wide range of
![]() ${\it\alpha}$
and
${\it\alpha}$
and
![]() ${\it\sigma}_{v}$
.
${\it\sigma}_{v}$
.
The lifting-line model presented in this work is intended to qualitatively, rather than quantitatively, describe the effects of the dominant physics. The model yields surprisingly good predictions of the 3D lift and moment coefficients, cavity topologies and re-entrant jet trajectories, considering that the lifting line is classically relegated to very high aspect ratios. However, it is not anticipated that the modelling approaches based on lifting-line and elliptical lift distributions would yield good results for very small aspect ratios (
![]() $AR_{h}<0.5$
). Additionally, it has been found (though not shown) that the lifting-line model only qualitatively describes the behaviour of hydrodynamic forces with respect to varying
$AR_{h}<0.5$
). Additionally, it has been found (though not shown) that the lifting-line model only qualitatively describes the behaviour of hydrodynamic forces with respect to varying
![]() $Fn_{h}$
. The results presented in this work are applicable to moderate Froude numbers (
$Fn_{h}$
. The results presented in this work are applicable to moderate Froude numbers (
![]() $1\lesssim Fn_{h}\lesssim 4$
), where hydrostatic and dynamic pressures are of the same order of magnitude. In this work, and in the literature, it has been observed that the Froude number ceases to be a dominant parameter for
$1\lesssim Fn_{h}\lesssim 4$
), where hydrostatic and dynamic pressures are of the same order of magnitude. In this work, and in the literature, it has been observed that the Froude number ceases to be a dominant parameter for
![]() $Fn_{h}>4$
. At higher speeds, vaporous cavitation may also be a dominant factor, as indicated by Waid (Reference Waid1968) and Rothblum et al. (Reference Rothblum, Mayer and Wilburn1969).
$Fn_{h}>4$
. At higher speeds, vaporous cavitation may also be a dominant factor, as indicated by Waid (Reference Waid1968) and Rothblum et al. (Reference Rothblum, Mayer and Wilburn1969).
Acknowledgements
This material is based upon work supported by the National Science Foundation Graduate Student Research Fellowship under grant no. DGE 1256260 and by the Naval Engineering Education Center (Award no. N65540-10-C-003), with support from Dr T. Fu of the Naval Surface Warfare Center, Carderock Division.
Supplementary movies
Supplementary movies are available at http://dx.doi.org/10.1017/jfm.2016.373.
Appendix A. Plots of hydrodynamic load coefficients
In this appendix, the coefficients of lift, drag and moment are illustrated for various values of
![]() $Fn_{h}$
,
$Fn_{h}$
,
![]() ${\it\alpha}$
and
${\it\alpha}$
and
![]() $AR_{h}$
. The dashed lines indicate affine fits through the mean values. Grey bars indicate the uncertainty (from table 3), and black bars indicate
$AR_{h}$
. The dashed lines indicate affine fits through the mean values. Grey bars indicate the uncertainty (from table 3), and black bars indicate
![]() $\pm$
one standard deviation of the respective time series data.
$\pm$
one standard deviation of the respective time series data.

Figure 31. Hydrodynamic load coefficients as functions of
![]() ${\it\alpha}$
and
${\it\alpha}$
and
![]() $Fn_{h}$
for
$Fn_{h}$
for
![]() $AR_{h}=0.5$
.
$AR_{h}=0.5$
.

Figure 32. Hydrodynamic load coefficients as functions of
![]() ${\it\alpha}$
and
${\it\alpha}$
and
![]() $Fn_{h}$
for
$Fn_{h}$
for
![]() $AR_{h}=1$
.
$AR_{h}=1$
.

Figure 33. Hydrodynamic load coefficients as functions of
![]() ${\it\alpha}$
and
${\it\alpha}$
and
![]() $Fn_{h}$
for
$Fn_{h}$
for
![]() $AR_{h}=1.5$
.
$AR_{h}=1.5$
.
Appendix B. Order-of-magnitude analysis of added mass
Consider a representative section of the hydrofoil as a 2D flat plate at an angle of attack
![]() ${\it\alpha}$
, in an infinite domain, with an instantaneous inflow velocity of
${\it\alpha}$
, in an infinite domain, with an instantaneous inflow velocity of
![]() $u={\dot{X}}$
, and accelerating at a constant rate of
$u={\dot{X}}$
, and accelerating at a constant rate of
![]() $\ddot{X}=a$
. The lift and drag on the plate are
$\ddot{X}=a$
. The lift and drag on the plate are
The unsteady forces are limited to the inertial influence of the fluid as the body accelerates. Potential flow gives the inertial component in the
![]() $Y$
direction due to accelerations in
$Y$
direction due to accelerations in
![]() $X$
as
$X$
as
 $$\begin{eqnarray}\displaystyle L_{unsteady} & = & \displaystyle \unicode[STIX]{x1D62E}_{21}\ddot{X}\nonumber\\ \displaystyle & = & \displaystyle \frac{1}{2}{\rm\pi}{\it\rho}\left(\frac{c}{2}\right)^{2}\sin (2{\it\alpha})\ddot{X}.\end{eqnarray}$$
The inertial component in the
![]() $X$
direction is
$X$
direction is
 $$\begin{eqnarray}\displaystyle D_{unsteady} & = & \displaystyle \unicode[STIX]{x1D62E}_{11}\ddot{X}\nonumber\\ \displaystyle & = & \displaystyle {\rm\pi}{\it\rho}\left(\frac{c}{2}\right)^{2}\sin ^{2}({\it\alpha})\ddot{X},\end{eqnarray}$$
where
![]() $\unicode[STIX]{x1D62E}_{21}$
and
$\unicode[STIX]{x1D62E}_{21}$
and
![]() $\unicode[STIX]{x1D62E}_{11}$
are components of the added-mass tensor
$\unicode[STIX]{x1D62E}_{11}$
are components of the added-mass tensor
![]() $\unicode[STIX]{x1D662}$
. Equation (B 1) becomes
$\unicode[STIX]{x1D662}$
. Equation (B 1) becomes
 $$\begin{eqnarray}\left.\begin{array}{@{}c@{}}\displaystyle L=\frac{{\rm\pi}}{2}{\it\rho}\left(\frac{c}{2}\right)^{2}\sin (2{\it\alpha})\ddot{X}+C_{L}\frac{1}{2}{\it\rho}{\dot{X}}^{2}c,\\ \displaystyle D={\rm\pi}{\it\rho}\left(\frac{c}{2}\right)^{2}\sin ^{2}({\it\alpha})\ddot{X}+C_{D}\frac{1}{2}{\it\rho}{\dot{X}}^{2}c.\end{array}\right\}\end{eqnarray}$$
Given that
![]() $Fn_{h}={\dot{X}}/\sqrt{gh}$
, the ratio of unsteady to steady lift can be expressed as
$Fn_{h}={\dot{X}}/\sqrt{gh}$
, the ratio of unsteady to steady lift can be expressed as
The ratio of unsteady to steady drag is written as
The quantities of (B 5) and (B 6) are estimated by order of magnitude as follows:
-
(1)
 $\sin ^{2}({\it\alpha})=O(10^{-1})$
for
 ${\it\alpha}<30^{\circ }$
;
 -
(2)
 $\sin (2{\it\alpha})=O(1)$
for
 ${\it\alpha}<30^{\circ }$
;
 -
(3)
 $\ddot{X}/g=O(10^{-2})$
, assuming
 $\ddot{X}=a\approx O(1)~\text{ft}~\text{s}^{-2}$
;
 -
(4)
 $AR_{h}=O(1)$
;
 -
(5)
 $C_{L}=O(1)$
;
 -
(6)
 $C_{D}=O(10^{-1})$
.
The resulting ratios become, after simplification,
This result suggests that for
![]() $Fn_{h}\ll 1$
only, the inertial forces are of the same order as the steady lift and drag. The relative magnitude of the inertial components vanishes quickly as the speed, and
$Fn_{h}\ll 1$
only, the inertial forces are of the same order as the steady lift and drag. The relative magnitude of the inertial components vanishes quickly as the speed, and
![]() $Fn_{h}$
, increase, and may be neglected for
$Fn_{h}$
, increase, and may be neglected for
![]() $Fn_{h}>1$
.
$Fn_{h}>1$
.


