


Introduction
Although anxiety disorders pose a tremendous public health burden (Kessler et al. Reference Kessler, Aguilar-Gaxiola, Alonso, Chatterji, Lee, Ormel, Ustun and Wang2009), their etiology is not well understood. Obesity is hypothesized to have adverse mental health consequences (Bjerkeset et al. Reference Bjerkeset, Romundstad, Evans and Gunnell2008; Bodenlos et al. Reference Bodenlos, Lemon, Schneider, August and Pagoto2011). Possible pathways include stigmatization and discrimination processes (Cairney et al. Reference Cairney, Corna, Veldhuizen, Kurdyak and Streiner2008), in addition to the negative health consequences associated with obesity that impact quality of life and cause distress (Sareen et al. Reference Sareen, Cox, Clara and Asmundson2005). Direct negative health consequences of obesity on brain function might act through inflammation processes and deregulation of the hypothalamic–pituitary–adrenal (HPA) axis (Nousen et al. Reference Nousen, Franco and Sullivan2013). Most, but not all, research reports that obesity or body mass index (BMI) predicts worse anxiety symptoms and higher risk of anxiety disorder (Gariepy et al. Reference Gariepy, Nitka and Schmitz2010). These non-experimental studies are inconclusive, however, because of potential confounding from unobserved common causes of adiposity and anxiety or reverse causation from anxiety to weight gain.
To address these limitations, the Mendelian randomization study design uses genetic polymorphisms that increase adiposity to mimic a ‘natural experiment’. Because genetic information is determined at conception, this approach, also known as the genetic instrumental variable (IV) approach, avoids confounding and reverse causation. The genetic IV approach can be used to identify the effect of BMI on anxiety symptoms, provided the genes influencing BMI do not have direct effects on anxiety; to date, no genetic determinants for anxiety have been conclusively established (Smoller, Reference Smoller2011). Any genetic polymorphisms that directly influence anxiety are not valid candidates for the genetic IV analysis, but because of the paucity of evidence on the genetics of anxiety, such a polymorphism would be of compelling interest.
Previous investigations have used a genetic IV approach to evaluate the relationship between adiposity and common mental disorders (Kivimaki et al. Reference Kivimaki, Jokela, Hamer, Geddes, Ebmeier, Kumari, Singh-Manoux, Hingorani and Batty2011; Lawlor et al. Reference Lawlor, Harbord, Tybjaerg Hansen, Palmer, Zacho, Benn, Timpson, Davey Smith and Nordestgaard2011; Jokela et al. Reference Jokela, Elovainio, Keltikangas-Järvinen, David Batty, Hintsanen, Seppälä, Kähönen, Viikari, Raitakari and Lehtimäki2012). No prior study has used a genetic IV approach to estimate the effects of BMI on anxiety symptoms specifically. In this study we focused on phobic anxiety, as prior work from family and twin studies suggests that there is significant shared genetic risk across all forms of anxiety disorders (Hettema et al. Reference Hettema, Neale and Kendler2001, Reference Hettema, Prescott, Myers, Neale and Kendler2005; Smoller et al. Reference Smoller, Gardner-Schuster and Covino2008).
We constructed a polygenic score for BMI based on findings from previously published meta-analyses of genetic determinants of BMI in more than 250 000 participants (Speliotes et al. Reference Speliotes, Willer, Berndt, Monda, Thorleifsson, Jackson, Allen, Lindgren, Luan and Mägi2010). We used this score to conduct genetic IV analyses and estimate the effects of BMI on symptoms of phobic anxiety, based on women in the Nurses' Health Study (NHS) and men in the Health Professionals Follow-Up Study (HPFS) cohorts. We also estimated the conventional observational prospective association between BMI and symptoms of phobic anxiety, but because of the potential for confounding and reverse causation, we anticipated that this effect estimate would be biased upwards. We further compared IV and conventional effect estimates to evaluate the bias of the conventional effect estimate. We assessed the validity of the genetic IV approach by evaluating whether there was evidence that genotypes associated with BMI directly influenced symptoms of phobic anxiety, independently of the BMI pathway. Finally, we evaluated the assumptions inherent to genetic IV analysis by examining the possibility that the effects of BMI on symptoms of phobic anxiety differ depending on the physiologic mechanism linking the genetic polymorphisms and BMI.
Method
Population
All data are drawn from seven nested case–control genome-wide association studies (GWAS) within the NHS and HPFS cohorts.
The NHS
The NHS was established in 1976 when 121 700 female registered nurses aged 30–55 years and residing in 11 large US states completed a mailed questionnaire on medical history and lifestyle characteristics (Colditz & Hankinson, Reference Colditz and Hankinson2005). Blood was collected from 32 826 participants between 1989 and 1990. DNA was extracted from white blood cells using the QIAmp™ (QIAGEN Inc., USA) blood protocol and all samples were processed in the same laboratory. Genome-wide scans were obtained from four independent GWAS of the cohort, initially designed to examine type 2 diabetes (T2D, n = 3286), coronary heart disease (CHD, n = 1146), breast cancer (BrCa, n = 2287) and kidney stone (KS, n = 504) disease.
The HPFS
The HPFS was initiated in 1986 when 51 529 male health professionals between ages 40 and 75 years and residing in the USA completed a questionnaire on lifestyle and medical history. Participants have been followed with repeated questionnaires on lifestyle and health every 2 years.
Between 1993 and 1996, a blood sample was requested from all active participants and collected from 18 225 men (Chu et al. Reference Chu, Stampfer, Spiegelman, Rifai, Hotamisligil and Rimm2001). DNA was extracted from white blood cells using the QIAmp™ blood protocol; all samples were processed in the same laboratory. Genome-wide scans were obtained from three independent GWAS of the cohort, initially designed to examine T2D (n = 2487), CHD (n = 1313) and KS (n = 553) disease.
Exact genotyping, quality control (QC) and imputation protocols varied by sample set (Supplementary Tables S1 and S2). Principal components analyses were conducted to exclude self-reported white individuals who had substantial similarity to non-European reference samples (Price et al. Reference Price, Patterson, Plenge, Weinblatt, Shadick and Reich2006). Each study imputed up to 2.5 million autosomal single nucleotide polymorphisms (SNPs) with National Center for Biotechnology Information (NCBI) build 36 of Phase II HapMap CEU data (release 22) as the reference panel using MACH. Imputation results summarized as allele calls (0, 1, 2) were used for analysis.
Considering QC and available information on phobic anxiety, a total of 5911 genotyped participants were available from the NHS (T2D = 2628, CHD = 883, BrCa = 1931, KS = 469) and 3697 participants from the HPFS (T2D = 2055, CHD = 1113, KS = 529).
Ethics statement
The NHS and the HPFS were approved by the Human Subjects Committee of Brigham and Women's Hospital, Boston, MA. All participants in this study provided written informed consent. All procedures contributing to this work comply with the ethical standards of the relevant national and institutional committees on human experimentation and with the Helsinki Declaration of 1975, as revised in 2008.
Genetic instrument
The genetic IVs were based on 32 SNPs established as genome-wide significant predictors of BMI, based on the largest currently available meta-analysis (Speliotes et al. Reference Speliotes, Willer, Berndt, Monda, Thorleifsson, Jackson, Allen, Lindgren, Luan and Mägi2010). First, we examined the two individual genes previously used in genetic IV analyses for the effect of adiposity on mental health: the fat mass and obesity-associated (FTO) gene, rs 1 558 902, risk allele A, and the melanocortin 4 receptor (MC4R) gene, rs 571 312, risk allele A (Kivimaki et al. Reference Kivimaki, Jokela, Hamer, Geddes, Ebmeier, Kumari, Singh-Manoux, Hingorani and Batty2011; Lawlor et al. Reference Lawlor, Harbord, Tybjaerg Hansen, Palmer, Zacho, Benn, Timpson, Davey Smith and Nordestgaard2011). For each polymorphism, we constructed an IV as the sum of the number of risk alleles multiplied by the estimated effect of the risk allele on BMI. The estimated effect was based on the β estimates from the GWAS meta-analysis (Speliotes et al. Reference Speliotes, Willer, Berndt, Monda, Thorleifsson, Jackson, Allen, Lindgren, Luan and Mägi2010).
Second, we combined information on all 32 SNPs (including polymorphisms in FTO and MC4R) confirmed as genome-wide significant predictors of BMI to construct a genetic risk score (GRS). We calculated the GRS for each individual in our study sample as a weighted sum of risk alleles (i.e. BMI-increasing alleles), with each SNP weighted by the β estimate from the previous meta-analysis (Purcell et al. Reference Purcell, Wray, Stone, Visscher, O'Donovan, Sullivan, Sklar, Ruderfer, McQuillin and Morris2009; Speliotes et al. Reference Speliotes, Willer, Berndt, Monda, Thorleifsson, Jackson, Allen, Lindgren, Luan and Mägi2010). The β weights used for each polymorphism are shown in Supplementary Table S3.
This GRS provides the most powerful genetic IV available as it combines the strongest known genetic predictors of BMI. We also constructed a GRS without including FTO (GRSexFTO) because of recent evidence suggesting a direct pathway from FTO to depression, which is highly co-morbid with anxiety (Samaan et al. Reference Samaan, Anand, Zhang, Desai, Rivera, Pare, Thabane, Xie, Gerstein, Engert, Craig, Cohen-Woods, Mohan, Diaz, Wang, Liu, Corre, Preisig, Kutalik, Bergmann, Vollenweider, Waeber, Yusuf and Meyre2013).
We performed a search in PubMed and Google Scholar databases for peer-reviewed publications identifying the functions of the 32 SNPs established as genome-wide significant predictors of BMI; the NCBI Gene database was used as additional reference if published journal articles regarding SNP functions were not available. After SNP functions were identified to the extent possible, SNPs were categorized by key words and overall function into the following three mechanistic domains through which they are likely to influence BMI: appetite, adipogenesis and cardiopulmonary function. SNPs that could not be categorized by these known domains were grouped into a category identified as other/unknown. We then created a GRS for each domain, based on the above protocol but restricted only to SNPs associated with the respective mechanisms (detailed in Supplementary Table S3).
Phenotype
BMI was calculated as kg/m2. Height was self-reported as part of the baseline questionnaire (NHS: 1976, HPFS: 1988). Weight in pounds was self-reported at each biennial interview, converted to kg and summarized as the mean of all measurements prior to the assessment of anxiety in 2004 for NHS and in 2000 for HPFS (NHS: 14 measurements between 1976 and 2002; HPFS: six measurements between 1988 and 1998). In prior work with these cohorts, self-reported weight was validated by study staff in a subsample of 263 men and women and was highly correlated to measured weight in the NHS and HPFS (r = 0.97) (Rimm et al. Reference Rimm, Stampfer, Colditz, Chute, Litin and Willett1990).
Outcome
Symptoms of phobic anxiety were assessed in men in the year 2000 and in women in 2004 using the validated phobic anxiety subscale of the Crown Crisp Index (CCI). Previous research demonstrates that the CCI discriminates individuals with diagnosable anxiety disorders from healthy individuals (Crown & Crisp, Reference Crown and Crisp1966), correlates reasonably with other measures of anxiety from the Middlesex Hospital Questionnaire (free-floating anxiety ρ = 0.48, obsessional ρ = 0.45, somatic ρ = 0.42, depressive ρ = 0.27) (Crown & Crisp, Reference Crown and Crisp1966), has high intraclass correlation in monozygotic twins (0.60) and high heritability (0.64) (Young et al. Reference Young, Fenton and Lader1971), and is associated with heart disease in both men and women (Haines et al. Reference Haines, Imeson and Meade1987; Kawachi et al. Reference Kawachi, Colditz, Ascherio, Rimm, Giovannucci, Stampfer and Willett1994; Albert et al. Reference Albert, Chae, Rexrode, Manson and Kawachi2005). The measure continues to be used in ongoing research to evaluate the effectiveness of cognitive behavior therapy (Irvine et al. Reference Irvine, Firestone, Ong, Cribbie, Dorian, Harris, Ritvo, Katz, Newman and Cameron2011) and in evaluations examining the association of phobic anxiety with a range of outcomes, including child behavior problems (Leis et al. Reference Leis, Heron, Stuart and Mendelson2014) and health-related quality of life (Oldroyd et al. Reference Oldroyd, Cyril, Wijayatilaka, O'Neil, McKenzie, Zavarsek, Sanderson, Hare, Fisher, Forbes, Barr Taylor, Clarke, Meredith and Oldenburg2013).
The scale includes eight questions assessing fear of crowds, heights, enclosed spaces, going out alone, and worrying; items have two or three response (see Supplementary Table S4 for a detailed description of the items). Following prior work with this measure (Albert et al. Reference Albert, Chae, Rexrode, Manson and Kawachi2005), items with three response options were scored as no (0), moderate (1) or high (2); items with two response options were coded as no symptoms (0) or high (2) symptom level. To create the outcome for our analyses, we summed across items, resulting in an overall continuous score ranging from 0 to 16, with higher scores indicating higher levels of phobic anxiety. For those with missing items, the total score was divided by the fraction of questions answered and then rounded to the nearest whole number, so the possible range of total scores was consistent across all individuals. The score ranged from 0 to 15 in men and from 0 to 16 in women. Early work with the CCI among psychiatric patients suggested a mean score of 9 to discriminate phobic disorders from other diagnostic disorders (Crisp et al. Reference Crisp, Jones and Slater1978; Mavissakalian & Michelson, Reference Mavissakalian and Michelson1981); in healthier (non-psychiatric) populations a cut-off of ⩾4 has been used to indicate individuals higher on the spectrum of phobic anxiety symptoms (Albert et al. Reference Albert, Chae, Rexrode, Manson and Kawachi2005).
Analyses
We use χ 2 and ANOVA for bivariate analyses. For all linear regression models, we applied weights based on the inverse of the probability that each individual was selected from the original cohort into the genotyped samples, to reconstruct the original cohort from the nested case–control genetic samples and thereby circumvent the bias of selective sampling in this population (Bowden & Vansteelandt, Reference Bowden and Vansteelandt2011; Tchetgen Tchetgen et al. Reference Tchetgen Tchetgen, Walter and Glymour2013). For comparison with the primary IV models, we first report conventional, prospective, observational linear regression estimates (b OLS) of the effects of self-reported average BMI (prior to when phobic anxiety was assessed) on symptoms of phobic anxiety.
Genetic IV analyses estimate the effect of BMI on symptoms of phobic anxiety under a set of assumptions illustrated in the causal diagram in Fig. 1 (Glymour et al. Reference Glymour, Tchetgen Tchetgen and Robins2012; VanderWeele, Reference VanderWeele2012): (1) the genetic IV is associated with BMI; (2) there are no unmeasured common causes of the genetic IV and symptoms of phobic anxiety; and (3) every pathway originating from the genetic IV influences symptoms of phobic anxiety only through its influence on BMI. Under these assumptions, an individual's genotype can be used to estimate the effect of BMI on symptoms of phobic anxiety, at the same time establishing an (indirect) genetic risk factor. If, however, the genotype has a direct effect on symptoms of phobic anxiety, not mediated by BMI, the IV assumptions are not met and the IV-based effect estimate is biased away from the causal effect of BMI on symptoms of phobic anxiety.

Fig. 1. Causal diagram representing the assumptions for genetic instrumental variable (IV) analyses to estimate the effect of body mass index (BMI) on anxiety. The causal diagram follows the rules for directed acyclic graphs (DAGs) and describes the assumed causal structure motivating the IV analyses. Key assumptions represented in this diagram are: (1) the genotype affects BMI; (2) the genetic instrumental variables do not influence anxiety except through BMI; and (3) there are no common causes of genotype and anxiety. Under these assumptions, the genotype can be used as an IV to estimate the effect of BMI on phobic anxiety, even when there are unmeasured confounders of BMI and anxiety.
The IV analysis was executed using split-sample IV analyses, which is preferable to conventional two-stage least squares models because split-sample approaches avoid the potential for weak-instruments bias (Angrist & Krueger, Reference Angrist and Krueger1994, Reference Angrist and Krueger1995). In our split-sample IV model, we used first-stage estimates from a previous meta-analysis of the genetic determinants of BMI. This was accomplished by applying the meta-analyzed GWAS β weights from Speliotes et al. (Reference Speliotes, Willer, Berndt, Monda, Thorleifsson, Jackson, Allen, Lindgren, Luan and Mägi2010) when constructing the genetic IVs, as described above. In the second stage of the split-sample IV, we regressed the continuous phobic anxiety symptom score on the genetic IV, using a linear model with inverse probability weighting (IPW) to correctly reweight the case–control samples to the respective source population from the NHS or the HPFS. Under the IV assumptions encoded in Fig. 1, the coefficients (b IV) in this second-stage model are interpretable as the effect of BMI on the continuous phobic anxiety symptom score. More specifically, under the IV assumptions, the resulting effect estimate may be interpreted as the causal effect of a unit increase in BMI on phobic anxiety. This interpretation is premised on the assumption that BMI is a meaningful exposure, and the effect of a unit increase in BMI is the same regardless of the mechanism by which BMI was changed. Because of prior literature calling into question the phenotype of BMI, we also estimated separate IV models for each of the mechanism-related GRS IVs (appetite, adipogenesis, cardiopulmonary function and other/unknown) to validate the IV model.
For inference, sandwich estimators were used to account for heteroskedasticity and the IPWs. All analyses were adjusted for age and age-squared at the time of anxiety assessment, and for the first three genetic eigenvectors to control for population substructure unless otherwise indicated. Because this study uses data from different, sex-specific cohorts, we present sex-specific results and gender-pooled results using meta-analysis. Results were based on two-sided tests and p < 0.05 was considered statistically significant.
To test the necessity of IV models, or whether conventional models would have been appropriate, we adapted the standard Wu–Hausman tests. These tests contrast the estimate obtained from observational linear regression to the IV estimates. If there is no confounding of the observed association between BMI and phobic anxiety, both the observational estimate and the IV estimate are consistent, but the IV estimate is less efficient. If the Wu–Hausman test is rejected, it is typically interpreted as evidence that the observational estimate is biased and the IV estimate should be preferred. We used two approaches to evaluate the IV assumptions. First, we used the mechanism-related categories of GRSs to conduct over-identification tests, by testing the null that the IV estimates from each of the genetic risk scores were identical. Second, we assessed whether the association between the genetic IVs and the continuous phobic anxiety symptom score was attenuated by adjustment for BMI; as would be expected if BMI mediates the effect of the genes on anxiety.
Results
Consistent with prior findings in nationally representative samples (Kessler et al. Reference Kessler, Berglund, Demler, Jin, Merikangas and Walters2005), the average phobic anxiety symptom score was 43% higher in women than men (Table 1). When applying a threshold of 9 points, 1.3% of male participants and 2.8% of female participants were classified as suffering from clinical phobic anxiety. When using a threshold of ⩾4 to indicate individuals higher on the spectrum of phobic anxiety symptoms, we obtained a prevalence of 18.2% for men and 30.5% for women, slightly lower than the national average reported by Kessler et al. (Reference Kessler, Petukhova, Sampson, Zaslavsky and Wittchen2012). Among men, the first (1986) and last (1998) measures of BMI taken prior to anxiety assessment were correlated at r = 0.84 (Cronbach's α using the six assessments = 0.91); in women, the first (1976) and last (2002) measures of BMI were correlated with r = 0.68 (Cronbach's α using the 14 assessments = 0.81).
Table 1. Descriptive statistics for male and female study participants

HPFS, Health Professional Follow-up Study; NHS, Nurses' Health Study; BMI, body mass index; FTO, fat mass and obesity-associated gene; MC4R, melanocortin 4 receptor gene; s.d., standard deviation.
a Anxiety assessed in men (2000) and women (2004).
b Crown Crisp Index (CCI; phobic anxiety) measured in 2000 (HPFS) and 2004 (NHS). Items from eight questions related to fear of crowds, heights, enclosed spaces, going out alone, and worrying were summed resulting in an overall score ranging from 0 to 16. Higher scores indicate a higher level of phobic anxiety.
c BMI was assessed as mean of all measurements available prior to the assessment of anxiety. NHS: 1976–2002 (14 measurements), HPFS: 1988–1998 (six measurements).
d Weighted sum of the number of alleles (0, 1, or 2) with its published effect estimate for all 32 SNPs that were significantly associated with obesity published by Speliotes et al. (Reference Speliotes, Willer, Berndt, Monda, Thorleifsson, Jackson, Allen, Lindgren, Luan and Mägi2010).
In observational analysis, average self-reported BMI predicted a higher average anxiety symptom score among both men [β per unit increase in BMI: 0.044 units, 95% confidence interval (CI) 0.016–0.071] and women (β = 0.049, 95% CI 0.030–0.068). In the meta-analysis combining results from men and women, the effect estimate was 0.047 (95% CI 0.032–0.063).
The genetic instrument based on FTO was strongly associated with average self-reported BMI in men (F = 17.11) and women (F = 10.30) and explained 0.85% and 0.75% of the variance in BMI respectively (Table 2). MC4R predicted BMI in men (F = 12.2, R 2 = 0.02%) but not in women (F = 3.43, R 2 = 0.09%). The GRS was strongly associated with BMI in both men (F = 18.73, R 2 = 1.07%) and women (F = 31.48, R 2 = 2.73%). When the GRS was recalculated excluding FTO (the strongest SNP), the overall score remained strongly associated with BMI.
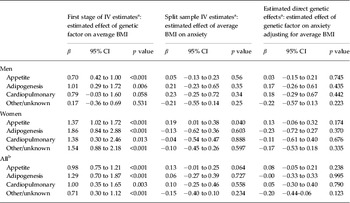
Table 2. First stage and genetic IV estimates of the effect of BMI on phobic anxiety, comparing alternative genetic IVs

IV, Instrumental variable; BMI, body mass index; FTO, fat mass and obesity-associated gene; MC4R, melanocortin 4 receptor gene; GRS, genetic risk score; CI, confidence interval.
a Additionally adjusted for age, age-squared and the top three eigenvectors to increase precision.
b p value from the Wu–Hausman test for equality between ordinary least squares (OLS) and IV estimates.
c Results from inverse-variance weighted meta-analysis.
Table 2 also shows the results from the IV analyses. The IV effects derived using FTO as an instrument were large and statistically significant among men (b IV,men = 0.32, 95% CI 0.00–0.64) and women (b IV,women = 0.31, 95% CI 0.01–0.62), and when male and female samples were pooled (b IV = 0.32, 95% CI 0.10–0.54). The FTO-based IV effect estimates were substantially larger than the corresponding observational effect estimates. The IV effect estimate based on the GRS was similar to the observational effect estimate (b IV = 0.060, 95% CI −0.04 to 0.16) and not statistically significant (p = 0.26). The IV effect estimate based on GRS excluding FTO was close to the null (b IV = − 0.03, 95% CI −0.15 to 0.10). For each of the IV effect estimates, we performed Wu–Hausman tests comparing the IV estimate to the estimate obtained from observational linear regression models. This test indicated that IV effect estimates based on FTO alleles in the meta-analyzed sample of men and women differed significantly from the observational effect estimate (p = 0.02, Table 2). None of the other IV effect estimates were significantly different from the conventional observational effect estimate (p < 0.05 for all, Table 2).
Testing assumptions
To assess the validity of the IV assumptions, we next compared the IV estimates from each of the ‘functional’ GRS IVs. All four scores were significantly associated with BMI among men and women, with the exception of the ‘other/unknown’ mechanism score, which was not significantly related to BMI among men (Table 3). The IV estimates showed considerable heterogeneity across mechanism-related GRS. For example, BMI differences induced by genes regulating appetite were significantly associated with elevated anxiety in women (b = 0.19, 95% CI 0.01–0.38) but not in men. However, the over-identification test failed to reject (NHS p = 0.08, HPFS p = 0.21), indicating that differences in the IV effect estimates for the four alternative GRSs may be due to sampling variability. To consider a potential direct effect of FTO on anxiety, as suggested by Samaan et al. (Reference Samaan, Anand, Zhang, Desai, Rivera, Pare, Thabane, Xie, Gerstein, Engert, Craig, Cohen-Woods, Mohan, Diaz, Wang, Liu, Corre, Preisig, Kutalik, Bergmann, Vollenweider, Waeber, Yusuf and Meyre2013), we compared the b IV based on FTO to the b IV based on the GRS excluding FTO. This test rejected the null hypothesis in both men (HPFS p = 0.01) and women (NHS p = 0.02), providing evidence that FTO influences anxiety by a mechanism distinct from any possible effect of the other 31 obesity-associated SNPs.
Table 3. First stage and genetic IV estimates of the effect of BMI on phobic anxiety, comparing mechanism-specific genetic IVs
IV, Instrumental variable; BMI, body mass index; CI, confidence interval.
a Additionally adjusted of age, age-squared and the top three eigenvectors to increase precision.
b Results from inverse-variance weighted meta-analysis.
Appetite rs10150332 (NRXN3), rs10767664 (BDNF), rs1558902 (FTO), rs2815752 (NEGR1), rs2867125 (TMEM18), rs543874 (SEC16B), rs571312 (MC4R), rs7359397 (SH2B1), rs9816226 (ETV5); Adiposity rs12444979 (GPRC5B), rs1555543 (PTBP2), rs2890652 (LRP1B), rs3817334 (MTCH2), rs4929949 (RPL27A), rs7138803 (FAIM2), rs987237 (TFAP2B); Cardiopulmonary factors rs10938397 (GNPDA2), rs11847697 (PRKD1), rs13107325 (SLC39A8), rs1514175 (TNNI3 K); Others rs10968576 (LRRN6C), rs13078807 (CADM2), rs206936 (NUDT3), rs2112347 (FLJ35779), rs2241423 (MAP2K5), rs2287019 (QPCTL), rs29941 (KCTD15), rs3810291 (TMEM160), rs4771122 (MTIF3), rs4836133 (ZNF608), rs713586 (RBJ), rs887912 (FANCL).
To further test the validity of the IV, we next adjusted the regressions of anxiety on each genetic IV for self-reported average BMI. If BMI fully mediated the effects of the genetic IV on phobic anxiety, this adjustment should completely attenuate and possibly reverse the sign of the associations (Glymour et al. Reference Glymour, Tchetgen Tchetgen and Robins2012). Indeed, we found that adjustment for BMI attenuated the associations between the genetic risk scores and symptoms of phobic anxiety (Tables 2 and 3). When pooling men and women, the FTO-based gene score significantly predicted phobic anxiety even after adjustment for average self-reported BMI (p = 0.02). Furthermore, we found no evidence for statistical interaction between the mediator and the direct pathway (results not shown).
Discussion
In our large sample of adult men and women, we found that the FTO genotype was associated with phobic anxiety. Although FTO is known to influence BMI throughout life, the association between FTO and phobic anxiety was not completely mediated by BMI. This independent association of the FTO genotype and phobic anxiety may suggest a direct effect, not mediated through BMI, of FTO on phobic anxiety, similar to the effect recently suggested between FTO and depression (Samaan et al. Reference Samaan, Anand, Zhang, Desai, Rivera, Pare, Thabane, Xie, Gerstein, Engert, Craig, Cohen-Woods, Mohan, Diaz, Wang, Liu, Corre, Preisig, Kutalik, Bergmann, Vollenweider, Waeber, Yusuf and Meyre2013). This leads to concerns about the validity of FTO as a genetic instrument in this study.
Our study is the first to provide genetic IV-based estimates of the effect of BMI on phobic anxiety; previous studies have examined composite phenotypes of mental distress or depression. Kivimaki et al. (Reference Kivimaki, Jokela, Hamer, Geddes, Ebmeier, Kumari, Singh-Manoux, Hingorani and Batty2011) used the FTO genotype as an IV for BMI and overweight/obesity and estimated that increases in BMI induced a substantial increase in common mental disorder. We found similar results using FTO alone and, like Kivimaki et al. (Reference Kivimaki, Jokela, Hamer, Geddes, Ebmeier, Kumari, Singh-Manoux, Hingorani and Batty2011), also found evidence that this effect was not fully mediated by BMI. However, our measure of BMI is substantially more robust than that used in the Kivimaki study; we used mid-life BMI averaged over multiple successive interview waves. The finding that even this high-quality measure of BMI did not eliminate the association between FTO and anxiety further supports the suggestion that FTO has a direct effect on phobic anxiety. Lawlor et al. (Reference Lawlor, Harbord, Tybjaerg Hansen, Palmer, Zacho, Benn, Timpson, Davey Smith and Nordestgaard2011) used FTO and MC4R as IVs to estimate the effect of BMI with regard to three questions assessing levels of psychological distress and the use of antidepressants separately; they reported the surprising finding that genetic factors associated with increases in BMI predicted better mental health. We do not find any evidence of a similar pattern when using FTO and MC4R as IVs, but we do find some suggestive evidence that at least some genetically induced differences in BMI are associated with lower symptoms of anxiety. We found this most pronounced in gene scores associated with BMI through other/unknown mechanisms, not used in the analysis (Lawlor et al. Reference Lawlor, Harbord, Tybjaerg Hansen, Palmer, Zacho, Benn, Timpson, Davey Smith and Nordestgaard2011). More recently, Jokela et al. (Reference Jokela, Elovainio, Keltikangas-Järvinen, David Batty, Hintsanen, Seppälä, Kähönen, Viikari, Raitakari and Lehtimäki2012) used the same genetic loci as in our analyses, and also found a positive association when investigating the effect of BMI on depression using the Modified Beck Depression Inventory.
The suggestion that some genes, such as FTO, may have direct effects on phobic anxiety is intriguing, given the paucity of evidence on the genetic determinants of anxiety. In this study, Wu–Hausman specification tests indicated that IV effect estimates based on FTO alleles in the meta-analyzed sample of men and women differed significantly from the observational effect estimate (p = 0.02, Table 2), arguing in favor of using IV models in comparison to standard ordinary least squares (OLS). However, the IV effect estimates based on the GRSexFTO did not (p = 0.38). This casts doubt on the validity of FTO as an IV.
Recently, a candidate gene study suggested protective effects of the rs9939609 A variant, a proxy SNP for FTO in high linkage disequilibrium with the SNP used in this study (rs1558902, R 2 = 0.90), on depression in a multi-ethnic sample (Samaan et al. Reference Samaan, Anand, Zhang, Desai, Rivera, Pare, Thabane, Xie, Gerstein, Engert, Craig, Cohen-Woods, Mohan, Diaz, Wang, Liu, Corre, Preisig, Kutalik, Bergmann, Vollenweider, Waeber, Yusuf and Meyre2013). Because the genetics of anxiety and depression are thought to be similar (Domschke & Reif, Reference Domschke and Reif2012), it is difficult to explain the harmful effect of FTO on phobic anxiety in our study as compared to the protective effect of FTO on depression reported in the Samaan et al. (Reference Samaan, Anand, Zhang, Desai, Rivera, Pare, Thabane, Xie, Gerstein, Engert, Craig, Cohen-Woods, Mohan, Diaz, Wang, Liu, Corre, Preisig, Kutalik, Bergmann, Vollenweider, Waeber, Yusuf and Meyre2013) investigation. It is possible that there are differences between ethnic populations as the study of Samaan et al. (Reference Samaan, Anand, Zhang, Desai, Rivera, Pare, Thabane, Xie, Gerstein, Engert, Craig, Cohen-Woods, Mohan, Diaz, Wang, Liu, Corre, Preisig, Kutalik, Bergmann, Vollenweider, Waeber, Yusuf and Meyre2013) failed to provide a significant effect when analyzing the white population only. Inflation of type I error rates due to multiple testing is a persistent concern in genetic research, particularly genome-wide studies with hundreds of thousands of comparisons. By contrast, we tested a relatively small number of comparisons. Our findings may nonetheless reflect chance and should be replicated in other, preferably larger, cohorts given the small effects of FTO on anxiety. In addition, biasing pathways possibly through an effect of FTO on depression and subsequent co-morbid anxiety merit investigation.
The current analyses should be interpreted in light of the strong assumptions under which IV estimates correspond with causal effects. We argue that violations of these assumptions are illuminating, especially when the genetic determinants of the outcome are not well understood. The IV assumptions can be falsified with several approaches, and we implemented two of the most powerful assessments: leveraging assumptions about the direction of confounding of the BMI–anxiety association and comparing effect estimates across alternative genetic IVs. We assumed net positive confounding between BMI and symptoms of phobic anxiety; that is, that the observational effect estimate would be larger than the true causal effect. Our results suggest that the FTO genotype is unlikely to provide a valid IV because the IV effect estimate using FTO is larger than the observational estimate (Glymour et al. Reference Glymour, Tchetgen Tchetgen and Robins2012). Over-identification tests comparing effect estimates from different IVs further support the inference that FTO is not a valid IV for the effects of BMI per se, but rather has some direct effects on phobic anxiety.
Beyond the challenges common to genetic IV studies, the limitations of our single, brief assessment of phobic anxiety should be recognized. Rather than assessing all anxiety phenotypes, the CCI measures phobic anxiety only. However, thus far no conclusive evidence has linked a specific genetic marker with any form of anxiety, nor has evidence suggested that any one form of anxiety disorder has a stronger genetic basis than any other. Furthermore, the CCI is well validated and seems to perform well in this population. However, our findings will need to be replicated in more diverse populations and evaluated for other anxiety disorders. It is also of interest to note that we observed a gender difference in the performance of the GRS when explaining BMI. Although the GRS was calculated using common SNP weights obtained from a gender-heterogeneous sample, the GRS explained 1.07% of the variation in BMI among men and 2.73% among women. Although this does not invalidate our study results, it highlights the potential for gender-specific SNP effects and the potential to improve these types of analyses if gender-specific SNP effects were available.
In conclusion, our findings provide little evidence that adiposity influences phobic anxiety but, perhaps more importantly, we find that a genetic locus known to influence adiposity is likely to have direct effects on phobic anxiety. In other words, adiposity and phobic anxiety share common genetic determinants. It is important to extend these findings in larger and more diverse samples, especially given the mixed pattern of results from different cohorts.
Supplementary material
For supplementary material accompanying this paper visit http://dx.doi.org/10.1017/S0033291714001226.
Acknowledgments
We thank the Channing Division of Network Medicine, Department of Medicine, Brigham and Women's Hospital and Harvard Medical School for the effort in initiating and maintaining the NHS (P01 CA87969) and HPFS (UM1 CA167552) cohorts with the support of infrastructure grants. We also gratefully acknowledge funding from the National Institutes of Health (NIH) and the National Institute of Mental Health (NIMH) (MH092707-01).
Declaration of Interest
None.


