


Introduction
The genus Frankliniella is one of the highly evolved groups of thrips (Hansen et al., Reference Hansen, Funderburk, Reitz, Ramachandran, Eger and McAuslane2003) inhabiting tropical and temperate areas of the world (Mound, Reference Mound and Lewis1997). In Florida, Frankliniella consists of a huge complex of species (Salguero-Navas et al., Reference Salguero-Navas, Funderburk, Beshear, Olson and Mack1991; Chellemi et al., Reference Chellemi, Funderburk and Hall1994; Puche et al., Reference Puche, Berger and Funderburk1995), many of which are polyphagous, feeding mainly on the contents of plant cells including fruits, leaves, inflorescence tissues and pollen of various vegetables, fruits and ornamental crops (Kendall & Capinera, Reference Kendall and Capinera1987).
Within the genus Frankliniella, F. schultzei (Trybom) is emerging as a vegetable pest in south Florida. Frankliniella schultzei earlier known to make irregular visits in flowers of cucurbits (Frantz & Fasulo, Reference Frantz and Fasulo1997) and ornamental plants (Funderburk et al., Reference Funderburk, Diffie, Sharma, Hodges and Osborne2007) in south Florida has been sampled regularly all year round from both insecticide-treated and non-treated commercial fields of cucurbits since 2008 (D.R. Seal, unpublished data). It is a polyphagous pest with a wide host range and has been reported as a key pest in tomato and cucumber fields in South America (Monterio et al., Reference Monteiro, Mound and Zucchi2001; Jones, Reference Jones2005). Frankliniella schultzei has a broad distribution range and is mainly found in tropical and subtropical areas throughout the world (Vierbergen & Mantel, Reference Vierbergen and Mantel1991).
The two colour morphs (pale and dark) of F. schultzei are known to cause direct damage to the crop by feeding and oviposition (Sakimura, Reference Sakimura1969; Amin & Palmer, Reference Amin and Palmer1985). The only morph found in Florida during this study period was the darker form, which is also a virulent strain between the two morphs, known to transmit at least four different plant viral diseases, including Tomato Spotted Wilt Virus (TSWV) (Sakimura, Reference Sakimura1969), Tomato Chlorotic Spot Virus (TCSV), Groundnut Ring Spot Virus (GRSV) and Chrysanthemum Stem Necrosis Virus (CSNV) (Nagata & de Avila, Reference Nagata and De Avila2000). While the majority of Frankliniella species are considered as anthophilous, F. schultzei have been observed feeding on both tomato and apple leaves (Jacobson, Reference Jacobson and Lewis1997; Pinent & Carvalho, Reference Pinent and Carvalho1998; Leite et al., Reference Leite, Picanco, Jham and Ecole2002) other than flowers of its host plant (Milne et al., Reference Milne, Walter, Kaonga and Sabio1996). The small size and thigmotactic behaviour is an advantage to thrips, helping them acquire the microhabitats in the field and escape from monitoring during initial stages of infestation. Thus, it is important to determine the feeding preference of this pest on different parts of a host to select an appropriate sampling unit in a field for monitoring.
In general, insect populations can be random, clumped or uniformly distributed. The distribution of insects is often influenced by its density in a field. Lower numbers of insects in a field leading to low capture rate during sampling suggests a random distribution of insects in a field (Southwood, Reference Southwood1978). Conversely, an aggregated pattern is usually expected for a high-density population in a field. However, regardless of the clumped, regular or random distribution pattern of insects, traditionally, insecticides are applied uniformly to fields (Weisz et al., Reference Weisz, Fleischer and Smilowitz1996), aggravating ecological, environmental and economic damage. Consequently, such disturbances to the natural system inaugurate the need of within-field distribution study of a pest. The distribution patterns of insects affect the number of samples required and the reliability of data to be used for thrips population estimation in a field. Thus, it is equally important to validate the minimum number of samples required from an area to reduce the variability of the data to an acceptable level.
Considering the lack of information on distribution patterns of this new pest in the region, and to develop appropriate management programs, within-field distribution of F. schultzei was determined. Another objective of this study was to investigate and determine the sample size required for estimation of F. schultzei population in a field. Furthermore, within-plant distribution of F. schultzei and its abundance was studied during cucumber growing seasons in south Florida.
Materials and methods
Cultural practices
Studies were conducted in 2008 and 2009 at commercial cucumber fields located in Homestead, FL, USA. The soil type for all experimental fields in this study was Krome gravelly loam, consisting of about 33% soil and 67% limestone pebbles (>2 mm). Cucumber, Cucumis sativus L. var. 'Vlaspek’, was directly seeded on a flat ground at all the experimental sites using standard cultural practices (Olson & Santos, Reference Olson and Santos2010). Seeds were sown 15.2 cm apart within the row and 91.4 cm apart between rows, and the crops were irrigated twice a week using overhead sprinklers. Fertilizer 4-0-8 (N-P-K) at a rate of 2.2 kg ha–1 was used once a week as an in-furrow band in all the fields, and its use was initiated three weeks after planting. Bacillus thuringiensis based insecticides, Dipel DF® (var. kurstaki) at 1.1 kg ha–1 and Xentari DF® (var. kustaki) at 1.2 l.ha–1 (Valent Biosciences Corporation, Libertyville, IL, USA) were used to control melon worms, Diaphania hyalinata (L.), and pickle worms, D. nitidalis (Stoll) (Lepidoptera: Pyralidae), in the field. No other insecticides were applied during these studies.
Within-plant distribution
Within-plant distribution of F. schultzei on cucumber was studied during three cropping seasons, autumn 2008, spring 2009 and autumn 2009 in two study areas (A and B) each season. Study areas for autumn 2008 and spring 2009 were distantly located. However, the two study areas A and B in autumn 2009 were part of the same commercial field. The size of different study areas within a commercial field ranged from 0.05–0.5 hectares (ha). Selection of these study areas at various sites was to extract information on the distribution of F. schultzei in a wider area. Figure 1 illustrates the geographical coordinates of the study areas used in different studies during various seasons.

Fig. 1. Schematic representation showing study areas used for the studies during three seasons. Boxes represent the study area used for three studies. Boxes with similar pattern and geographic coordinates suggest that the same site was used for the two studies conducted in the same season. 1The within-plant, within-field and seasonal abundance studies in autumn 2009 were conducted in the same study area. The three study areas A, B and C were part of the same commercial field. 2Study area A and B used for seasonal abundance study autumn 2009 were part of the same commercial field.
Before the sampling initiation, each study area was divided into equal-sized plots for the ease of sampling and to ensure samples were collected from the entire study area. Ten plants from each plot were randomly selected and visually stratified into three sections: a freshly emerged terminal leaf bud (2–5 days old), a middle leaf (5th leaf from the top), a bottom leaf (8th fully grown leaf from the top) and a flower with no preference for the site of flowers to be picked. Thus, from each plant, a newly emerged leaf bud, two leaves and a flower were collected at the time of sampling. The samples belonging to a stratum of a plant collected from one plot were placed in one Ziplock® bag marked with the date, plot number and sample type. All samples were transported to the Vegetable IPM laboratory, TREC, Homestead, FL, where samples were placed in a one-liter plastic cup with 75% ethanol for 30 min to dislodge various life stages of thrips. The samples were carefully taken out of the cup, leaving thrips in alcohol. The contents in alcohol were sieved using a 25 μm grating, USA Standard Testing Sieve (W.S. Tyler, Inc., Mentor, OH, USA) as per Seal & Baranowski (Reference Seal and Baranowski1992). The residue in the sieve was washed off with 75% alcohol into a Petri dish and checked under a dissecting microscope at 12× to record various life stages of thrips. Sampling was done once in fourth and fifth week after planting for the season autumn (2008) and spring (2009). However, the two study areas during autumn (2009) were sampled once in a week for five weeks beginning the fourth week after planting.
Data were analyzed independently for each field and growing season. Data on the abundance of larvae and adults from each field was averaged for all the samplings. To determine the preferred plant parts by larvae and adult, the mean number of larvae and adults per ten crown, middle leaf, bottom leaf and flower per field was analyzed using one way analysis of variance (ANOVA) (PROC GLM: SAS Institute Inc., 2003). Data were transformed by log10(x+1) to comply with model assumptions before analysis. Untransformed means and standard errors are reported in figures. Differences among means of larvae and adult on various plant parts were separated using Tukey's HSD (Honestly significant difference) test (P<0.05).
Within-field distribution
Within-field distribution of F. schultzei was studied during the autumn cropping seasons of 2008 and 2009. Each season, three study areas within commercial fields were employed to conduct these studies. `Vlaspek’ cucumber was directly seeded on flat ground and fields were managed following standard cultural practices as described above.
Season 1 (autumn 2008)
The study area A measuring 0.24 ha was divided into 64 plots. From each of these plots, measuring 37 m2, ten flowers (one flower per plant) were randomly collected and processed as described in the previous study to record thrips count. These plots were later pooled for analysis in various combinations forming variable sized plots for the study, i.e. 74 m2, 148 m2, 296 m2 and 592 m2 corresponding to 2, 4, 8 and 16 combined plots. The second study was conducted at the study area B of within-plant distribution study in autumn season (2008). The site was divided into 42 equal-sized plots of 23.33 m2. Ten flowers (one flower per plant) were randomly collected and processed as discussed above. Plots were pooled for analysis in a combination of 3, 7 and 14 plots forming bigger plots of size 70 m2, 180 m2 and 360 m2, respectively. The third study was conducted at study area A of within-plant distribution study in the autumn of 2008. The field was divided into 40 equal-sized plots of 100 m2 and sampled as above. The plots were pooled in sets of 2, 4 and 10 forming plots of size 200, 400 and 1000 m2 area for analysis.
Season 2 (autumn 2009)
In autumn 2009, study was conducted at three sites, adjacent to each other within the same commercial field. The three sites were equal in size measuring 0.27 ha and each site was divided into 28 equal-sized plots starting from the edge of the site. Each plot was sampled, and the obtained samples (ten flowers per plot) were processed as described earlier. The plots were pooled in sets of 7 and 14, forming plots of size 630 and 1260 m2 area for analysis. Study areas A and B were also used for within-plant distribution study during autumn 2009 (field A and B), although only flowers were used for the present study and samples were collected from onset until conclusion of flowers in the crop.
Within-field distribution was determined separately for larvae and adults on flowers for each sampling using Taylor's power law (Taylor, Reference Taylor1961) and Iwao's patchiness regression (Iwao, Reference Iwao1968). In season 2008, the field was sampled once during the season. While in the second season (autumn 2009), sampling was conducted once every week for 4–5 weeks. Taylors's power law determines the relationship between variance (s2) and mean density of larvae and adults per sample by means of linear regression model:
where, slope (b) signifies degree of aggregation and log a, is a sampling factor related to variability in sampling size (Southwood, Reference Southwood1978). Iwao's patchiness regression expressed as:
is analogous to Taylors's power law, where m* (mean crowding index)=![]() , and s2 and
, and s2 and ![]() are the sample variance and mean, respectively. The mean crowding index was given by Lloyd (Reference Lloyd1967) to express the degree of crowding by mobile animals, and it was used by Iwao to derive the Iwao patchiness regression model. The intercept (α) is an index of basic contagion, which measures the tendency of insects towards crowding, and the slope (β) is the density contagiousness coefficient and is analogous to the b value in Taylor's power law. The ‘b’ and ‘β’ value in Taylor's power law and Iwao patchiness regression model, respectively, when greater than 1.0 represent an aggregated distribution of population. While, b and β values significantly<1.0 and not significantly >1.0, indicate a uniform and random distribution, respectively. Regression parameters were estimated using general linear regression model (PROC GLM) of Statistical Analysis System (SAS Institute Inc., 2003). The goodness of fit of data set from each field to both the linear models was evaluated by the r2 value. Student t-test was used to determine whether slope (b and β) values of these two models were significantly different from 1.0. Morista (Reference Morista1962) suggested that the distribution changes from aggregated to random with the change in the size of area occupied by insects. To address this, we determined within-field distribution of different sized plots in each of the experimental fields. These plots were formed by adding up small sub-plots at each field in different combinations, forming a range of different sized plots for analysis.
are the sample variance and mean, respectively. The mean crowding index was given by Lloyd (Reference Lloyd1967) to express the degree of crowding by mobile animals, and it was used by Iwao to derive the Iwao patchiness regression model. The intercept (α) is an index of basic contagion, which measures the tendency of insects towards crowding, and the slope (β) is the density contagiousness coefficient and is analogous to the b value in Taylor's power law. The ‘b’ and ‘β’ value in Taylor's power law and Iwao patchiness regression model, respectively, when greater than 1.0 represent an aggregated distribution of population. While, b and β values significantly<1.0 and not significantly >1.0, indicate a uniform and random distribution, respectively. Regression parameters were estimated using general linear regression model (PROC GLM) of Statistical Analysis System (SAS Institute Inc., 2003). The goodness of fit of data set from each field to both the linear models was evaluated by the r2 value. Student t-test was used to determine whether slope (b and β) values of these two models were significantly different from 1.0. Morista (Reference Morista1962) suggested that the distribution changes from aggregated to random with the change in the size of area occupied by insects. To address this, we determined within-field distribution of different sized plots in each of the experimental fields. These plots were formed by adding up small sub-plots at each field in different combinations, forming a range of different sized plots for analysis.
Sample size requirements
Sample numbers were evaluated at three levels of precision (0.10, 0.20 and 0.40) using Seal et al. (Reference Seal, Ciomperlik, Richards and Klassen2006) equation, given as:
where, a and b are coefficients from Taylor's power law regression, c is the reliability, n=sample size, t is student t-value at n–1 degree of freedom and ![]() is the mean density.
is the mean density.
The sample size was estimated for average cumulative thrips numbers from three experimental fields under study in autumn 2009. Estimates were made for three levels of density of F. schultzei larvae (![]() =0.5, 2 and 5) per sample. The density (two larvae per flower) was determined based on various samples collected in three plots during the period of study. The number of samples required at two levels of predetermined pest density (0.5 and 5 larvae per flower) was also calculated. Estimation of sample size at three levels of thrips density will help scouting personnel or growers to collect the right number of samples at different levels of infestation in the field and, thus, to apply control measures accordingly.
=0.5, 2 and 5) per sample. The density (two larvae per flower) was determined based on various samples collected in three plots during the period of study. The number of samples required at two levels of predetermined pest density (0.5 and 5 larvae per flower) was also calculated. Estimation of sample size at three levels of thrips density will help scouting personnel or growers to collect the right number of samples at different levels of infestation in the field and, thus, to apply control measures accordingly.
Seasonal abundance
Study on seasonal abundance of F. schultzei on cucumber was conducted for autumn cropping season in years 2008 and 2009. In both years, the study was conducted at two commercial fields, where all the designated study areas ranged between 0.25 and 0.5 ha. `Vlaspek’ cucumber seeds were planted in each field on different dates following standard cultural practices as described earlier.
The first trial was conducted in autumn (2008) at two sites adjacent to each other within a same commercial field. For sampling, each site of size ∼0.4 ha was divided into 56 equal-sized plots. In each plot, ten flowers (one flower per plot) were randomly collected and processed as discussed above. Since flower was the sampling unit in the study, sampling was initiated at the onset till conclusion of flowering. Samples were collected once per week for six weeks during the period of study. The second trial, to study seasonal abundance of F. schultzei, was conducted in autumn 2009 at the two study areas also used for within-field distribution study during autumn 2009 (field A and B). Data from within-field distribution study was used to determine seasonal abundance.
Data were analyzed independently for each year. However, the number of adults and larvae from two fields in each year (2008, 2009) was averaged over various sampling dates. The data was transformed using the square-root of (X+0.25) to stabilize error variance prior to analysis of variance. The average number of larvae and adults per sampling over two seasons in each year was analyzed by one way analysis of variance (ANOVA) (PROC GLM: SAS Institute Inc., 2003). Differences between means of larvae and adult count for all the sampling dates were separated using the Tukey's HSD test (α<0.05) using SAS Institute Inc. (2003).
Results and discussion
Within-plant distribution
The number of larvae and adults captured on flowers was significantly higher than the leaves sampled from various sections of a plant at study area A in 2008 (F=224.45; df=2, 117; P<0.001 for larvae, and F=186.57; df=2, 117; P<0.001 for adults) (fig. 2a). Similar results were obtained for study area B in 2008 (fig. 2b). Leite et al. (Reference Leite, Picanco, Jham and Ecole2002) reported that F. schultzei prefers to feed on the upper leaves to middle and lower leaves of tomato plants. Similarly, Pinent & Carvalho (Reference Pinent and Carvalho1998) reported on studies where they fed F. schultzei on tomato leaflets to study its biology and life cycle. Surprisingly, we did not find F. schultzei feeding on tomato leaves during the past two years in Homestead. Gonzalez et al. (Reference Gonzalez, Zayas, Cruz and Aviles2001), while sampling cucumber leaves to monitor Thrips palmi (Karny), found F. schultzei on leaf samples collected in Cuba, which was contradictory to our results. In order to confirm these reports, the study was repeated in spring 2009 and autumn 2009. At the two fields sampled in spring 2009, the mean number of F. schultzei was significantly higher in flowers than the other plant parts (fig. 2c, d). Similar results have been documented from the studies conducted at two sites in autumn 2009, where the number of F. schultzei adults and larvae were significantly higher in flower than other plant parts (fig. 2e, f).

Fig. 2. Mean number of larvae and adults in various plant parts sampled in autumn 2008 spring 2009 and autumn 2009. (* and ** indicates significant difference in mean number of larvae and adults collected from various plant parts using ANOVA at α=0.05). (a) Larvae: F=224.45; df=2, 117; P<0.001; adults: F=186.57; df=2, 117; P<0.001. (b) Larvae: F=117.30; df=3, 164; P<0.001; adults: F=67.90; df=3, 164; P<0.001. (c) Larvae: F=50.79; df=3, 28; P<0.001; adults: F=22.33; df=3, 28; P<0.001. (d) Larvae: F=64.8; df=3, 60; P<0.001; adults: F=173.82; df=3, 60; P<0.001. (e) Larvae: F=76.43; df=3, 108; P<0.001; adults: F=45.17; df=3, 108; P<0.001. (f) Larvae: F=108.54; df=3, 108; P<0.001; adults: F=34.96; df=3, 108; P<0.001 (![]() , Larvae;
, Larvae; ![]() , Adult).
, Adult).
In addition to F. schultzei, T. palmi was captured on cucumber plants during the study. The majority of T. palmi was found infesting leaves of cucumber plants, and the number of T. palmi on flower samples was low. Leaves of cucumber plants sampled at all the plots during the three-season study were heavily infested with T. palmi.
Within-field distribution
Study area A and B (2008)
At the two sites, larvae of F. schultzei exhibited an aggregated distribution. The slope (b and β) value from two linear regression models for the entire plot sizes were significantly >1 (P<0.05, table 1). Similar results were obtained for adults’ distribution in study area A, where slope values for Taylor's power law and Iwao's patchiness regression (b and β), ranging from 1.33 to 2.65 and 1.10 to 1.29, respectively, were significantly >1 (P<0.05) (table 2). The distribution pattern of adults in the smallest plot of study area A from two regression models were not in agreement with each other, where Iwao's patchiness regression model with higher r2 value provided a better fit to the data. The coefficient of determinant (r 2) for Taylor's power law for adults sampled in bigger plots of study area A and study area B was also lower than the coefficients of determinants for Iwao's patchiness regression model. The high r2 value suggests that Iwao's patchiness regression gave better fit than Taylor's power law to the data and was more appropriate in explaining the distribution of F. schultzei (tables 1 and 2). However, the two models were in agreement with each other, confirming an aggregated distribution of larvae and adult populations of F. schultzei in study area A and B. Milne et al. (Reference Milne, Walter and Milne2002) also observed such aggregated behaviour of F. schultzei in his study. He suggested that males of F. schultzei aggregates on plant parts to attract conspecifics for mating, possibly by release of sex pheromones. In addition, there are several reports suggesting the clumped distribution of other thrips species of family Thripidae, including, T. flavus Schrank, T. major Uzel, T. atratus Haliday, F. occidentalis (Pergande) and a group of flower thrips (Morison, Reference Morison1957; Kirk, Reference Kirk1985; Terry, Reference Terry, Parker, Skinner and Lewis1995; Terry & Dyreson, Reference Terry and Dyreson1996; Arevalo & Liburd, Reference Arevalo and Liburd2007) on various plant parts. Besides reproduction as a factor inducing clumping of F. schultzei population, there is not much information available on factors responsible for the aggregates forming behaviour of various thrips species. We speculate that aggregations in the area could be under the influence of plant phenology, flower aggregates, temperature, fertilizer, presence of natural enemies, reproduction, low dispersal by larvae, thigmotactic behaviour, etc. Lack of information on these aspects is an open challenge to researchers working on thrips and any knowledge on the interplay of these factors influencing distribution will open new prospects to exploit thrips biology for developing a sound management program.
Table 1. Taylor's power law and Iwao's patchiness regression parameters for distribution of F. schultzei larvae sampled in autumn 2008.

* N, number of plots pooled; Agg, aggregated distribution; b significantly (P≤0.05) >1. Reg, regular distribution; b significantly <1 (P≤0.05). Ran, random distribution; b not significantly different from 1 (P>0.05).
Table 2. Taylor's power law and Iwao's patchiness regression parameters for distribution of F. schultzei adult sampled in autumn 2008.

* N, number of plots pooled; Agg, aggregated distribution; b significantly (P≤0.05) >1. Reg, regular distribution; b significantly <1 (P≤0.05). Ran, random distribution; b not significantly different from 1 (P>0.05).
Study area C (2008)
Dispersion pattern of F. schultzei was different from the other two fields. Lower b and β values (not significantly >1 (P<0.05)) for larvae and adults’ distribution, suggested a random to regular distribution of the pest in the field (tables 1 and 2). The Iwao's patchiness regression, with r2 values ranging from 0.1 to 0.97 for larvae and adults’ distribution, provided a moderate to good fit to the data (tables 1 and 2). Such varied distribution pattern of F. schultzei in various fields is in agreement with other published studies on thrips species. Seal et al. (Reference Seal, Ciomperlik, Richards and Klassen2006), in their study, reported variability in the distribution pattern of chilli thrips in two fields sampled at the same time. The reason for fluctuating distribution pattern for thrips between fields in the same season is not known, given that F. schultzei infestation in field cucumber starts at onset of flowering in the fourth week after planting. We assume that, while we sampled the field in the seventh week after planting, thrips invading the field had enough time to infest the whole area and establish during the course of time. Thus, with increasing competition amongst conspecifics for food and space, there could have been local dispersion by various life stages leading to a more random distribution of the pest in the infested area. In addition, we observed that there was no effect of plot size on the distribution pattern of F. schultzei in three study areas (A, B and C) which could be due to the established thrips population in the field at the time of sampling. However, these assumptions were made based on single sampling done in each of the three study areas. Thus, in year 2009, we sampled another three cucumber fields, beginning at flower initiation until conclusion. Plots in each of the three study areas were pooled in a combination of seven and 14.
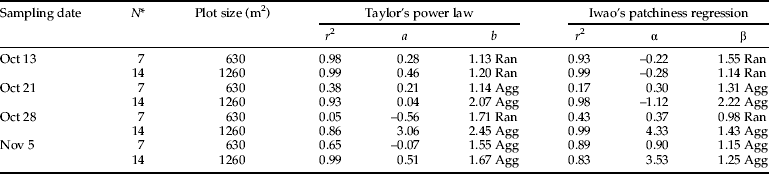
Study area A (2009)
Given that Taylor's power law did not provide good fit to the data of autumn 2008, the results and conclusions were made based on Iwao's patchiness regression model for autumn 2009 data. Results from the first sampling suggested an aggregated distribution of larvae and adults in larger plots (1260 m2) of the field. The slope (β) value for larvae and adults, from Iwao's patchiness regression model, was β=1.50 and 5.51, respectively (tables 3 and 4). Frankliniella schultzei infestation began from the edges of a field, with gradual dispersal inside the field. Thus, the aggregation observed in our plots during the first sampling could be due to the presence of thrips in the outer edges of the field. The slope value (β) for larvae during the next three samplings were not significantly >1 (P<0.05), indicating a random to regular distribution pattern (table 3). The r2 value from Iwao's patchiness regression ranged from 0.82 to 0.89, indicating a good fit to the data collected from larger plots during these sampling. However, the coefficient of determination (r2) for data from smaller plots for the two models was low, suggesting poor fit to the data (table 3). The random distribution during three weeks could be attributed to the low thrips density in the field that reduced the chances of thrips captured during samplings as per Southwood (Reference Southwood1978).
Table 3. Taylor's power law and Iwao's patchiness regression parameters for distribution of F. schultzei larvae sampled in autumn 2009 at study area A on various sampling dates.

* N, number of plots pooled; Agg, aggregated distribution; b significantly (P≤0.05) >1. Reg, regular distribution; b significantly <1 (P≤0.05). Ran, random distribution; b not significantly different from 1 (P>0.05).
Table 4. Taylor's power law and Iwao's patchiness regression parameters for distribution of F. schultzei adult sampled in autumn 2009 at study area A on various sampling dates.

* N, number of plots pooled; Agg, aggregated distribution; b significantly (P≤0.05) >1. Reg, regular distribution; b significantly <1 (P≤0.05). Ran, random distribution; b not significantly different from 1 (P>0.05).
High slope value (β) from samples collected during the fifth week suggested an aggregation of thrips larvae in the field, while thrips population was at peak during this time of the cropping season. We assume that the aggregation of thrips larvae is due to the increase in population density of thrips in the area, which concurs with Morista (Reference Morista1962). The author from his study suggested that any change in distribution from random to aggregate or vice versa could result from change in the thrips density. Correspondingly, the distribution pattern of adults was also clumped in larger plots (1260 m2) for successive samplings except fourth and sixth sampling during the study. The regular distribution of adults in the matured crop during last sampling was due to low density of adults in the field. The low population density could be due to the movement of adults to neighbouring plots planted later in the season, offering more food resources.
Study area B (2009)
The low coefficient of determinant (r2) during the first week of sampling suggested that the model did not fit well to larvae data. This could be due to low thrips density in the field, which was at initial stage of infestation (table 5). However, in the next week with increase in larvae population, the Iwao's patchiness model gave a comparatively better fit to the data and slope values indicated a regular distribution of larvae (table 5). Similarly, adults in the first week of sampling were aggregated, owing to large thrips density at the edges of the field and became randomly distributed in the next week (table 6). Both larvae and adults, during the subsequent weeks, showed fluctuation in distribution pattern that could be due to the environmental conditions, which affected thrips population density in the season.
Table 5. Taylor's power law and Iwao's patchiness regression parameters for distribution of F. schultzei larvae sampled in autumn 2009 at study area B on various sampling dates.

* N, number of plots pooled; Agg, aggregated distribution; b significantly (P≤0.05) >1. Reg, regular distribution; b significantly <1 (P≤0.05). Ran, random distribution; b not significantly different from 1 (P>0.05).
Table 6. Taylor's power law and Iwao's patchiness regression parameters for distribution of F. schultzei adult sampled in autumn 2009 at study area B on various sampling dates.

* N, number of plots pooled; Agg, aggregated distribution; b significantly (P≤0.05) >1. Reg, regular distribution; b significantly <1 (P≤0.05). Ran, random distribution; b not significantly different from 1 (P>0.05).
Study area C (2009)
Slope value for larvae (β=1.14) during the first week were not significantly >1 (P<0.05), suggesting a random distribution of larvae in the field (table 7). Conversely, on comparing the adults distribution we found that slope value (β=1.25) was significantly >1 (P<0.05) describing an aggregated distribution of adults. The aggregated distribution could be due to high adults count on the edges of the field. During the subsequent weeks (2nd and 3rd) with an increase in thrips density, both larvae and adults were aggregated in the field, supported by high r2 value for the regression model (tables 7 and 8).
Table 7. Taylor's power law and Iwao's patchiness regression parameters distribution of F. schultzei larvae sampled in autumn 2009 at study area C on various sampling dates.
* N, number of plots pooled; Agg, aggregated distribution; b significantly (P≤0.05) >1. Reg, regular distribution; b significantly <1 (P≤0.05). Ran, random distribution; b not significantly different from 1 (P>0.05).
Table 8. Taylor's power law and Iwao's patchiness regression parameters for distribution of F. schultzei adult sampled in autumn 2009 at study area C on various sampling dates.

* N, number of plots pooled; Agg, aggregated distribution; b significantly (P≤0.05) >1. Reg, regular distribution; b significantly <1 (P≤0.05). Ran, random distribution; b not significantly different from 1 (P>0.05).
On comparing the overall pattern of F. schultzei between different fields in two years of study, we conclude that, depending on thrips density, F. schultzei exhibited varied distribution patterns. During peak population densities, F. schultzei was found to be aggregated at all the fields, forming hot spots in the entire area under infestation. Between the two linear models used to estimate population distribution, high r2 for Iwao's patchiness suggested a better fit to the data using this model than Taylor's power law. This information will help to determine the distribution pattern of F. schultzei in a field relative to its population density and response of various models to species specific data to conduct selective management practices.
Sample size requirement
The results for estimation of sample size based on various population densities are given in table 9. We observed that the sample size increased with increase in levels of precision, ranging from 0.30 to 0.20. At an average number of two larvae per flower in a 0.27-ha field, the number of samples required were 35, 51 and 79 for 0.30, 0.25 and 0.20 precision levels, respectively. The number of samples required at this density for three levels of precision to inspect an infestation in a field is economical and practical. However, the large sample sizes, such as 273, required at 0.20 precision level when the predetermined population density was 0.5, is time consuming and economically unsound. Southwood (Reference Southwood1978) suggested 0.25 as the recommended precision level to assess the population density, damage inflicted and control studies. Thus, at 0.25 precision level when pest density was 0.5 larvae per flower, we determined 175 as the sample size to be collected in a 0.27-ha field, which is feasible and non-destructive to the crop in the field. The estimates made on sample sizes for three levels of infestation will help growers and scouting personnel collect minimum and adequate samples required to determine the correct threshold level of pest in fields.
Table 9. Number of samples required for estimation of population density at three levels of Precision.

* ![]() , mean number of larvae.
, mean number of larvae.
Seasonal abundance
In autumn 2008, we found that the density of adults and larvae during the growing season was inconsistent. Frankliniella schultzei is a flower thrips, and thus the infestation in the field began in a week after the flower initiation (table 10).The adult populations peaked during the third (Oct. 8) and fifth (Oct. 22) week of sampling. The highest number of adults was reported during the fifth week with average number of 34 adults per ten flowers. The larvae population varied during the season. It grew rapidly in the second week of sampling and was highest during the fourth (Oct. 15) and fifth (Oct. 22) week of sampling. Both larvae and adult counts gradually decreased in the sixth week as the crop begins to senesce. Similarly, in autumn 2009, the adult population increased with increase in flower number on plants. The population peak for adults was observed during the fifth week (Oct. 25) of sampling, with an average number of 25 adults per ten flowers (table 10). The larvae number also increased with the progression of time during the cropping season, where the highest number of larvae was recovered during the fifth week.
Table 10. Abundance of larvae and adults on cucumber flowers sampled at two fields in 2008 and 2009.

Means within a column followed by the same letter are not significantly different (α=0.05) by LSD test. Autumn 2008 (larvae: F=74.23; df=5, 162; adults: F=79.45; df=5, 162); autumn 2009 (larvae: F=56.24; df=5, 162; adults: F=35.16; df=5, 162).
The observed pattern of the abundance of F. schultzei with the onset of flowering in the field during the two cropping seasons could be due to the local dispersion by the thrips populations from adjacent uncultivated crops to host plants. Chellemi et al. (Reference Chellemi, Funderburk and Hall1994) reported that flower thrips belonging to the genus Frankliniella often colonize their host plants in large numbers during the flowering stage. However, colonization by these flower thrips lasts only for short periods due to the short flowering period of vegetable crops (Salguero-Navas et al., Reference Salguero-Navas, Funderburk, Beshear, Olson and Mack1991). Given that the flower initiation does not assure the immediate infestation of thrips populations, as different thrips species vary in their timing of infestation, it is important to determine the species-specific population dynamics in the field. Through this study, we addressed the population dynamics of F. schultzei in the autumn cropping season and determined the peak population period during the growing season. Results from our study will help develop suitable sampling protocols for F. schultzei and will guide the scouting personnel and growers to time control measures effectively.
These results have direct implications on management of F. schultzei in cucumber fields. Knowledge on the sampling precision, within field/plant distribution and abundance during the cropping season may have significance in early planning for development of a sound integrated pest management program of F. schultzei affected areas in the world.
Acknowledgements
We thank vegetable IPM laboratory (TREC-UF) members, including Megha Kalsi, Charles Carter and Cathie Sabines, for technical support and field preparations. The Florida Agricultural Experiment Station and the University of Florida's Center for Tropical Agriculture supported this study. We are grateful to Drs Philip A. Stansly and Oscar E. Liburd (Department of Entomology and Nematology, University of Florida) for their guidance and support. We thank Mr Thomas L. Skarlinsky, USDA, Animal and Plant Health Inspection Service, Miami, Florida, for invaluable assistance in identifying thrips species.


