


1. INTRODUCTION
Global economic growth and the implementation of marine development strategies have resulted in more frequent ocean transportation, fishing, and offshore oil exploration. This has caused commensurate increase in maritime risk that has focused the attention of the international community on maritime traffic safety (Aydogdu, Reference Aydogdu2014; Kum and Sahin, Reference Kum and Sahin2015). The hazards caused by maritime traffic safety accidents are numerous and include casualties, property losses (damage to ships, sinking, damage to goods, and damage to facilities on shore), and damage to the marine environment (Varlamis et al., Reference Varlamis, Tserpes and Sardianos2018).
Maritime search and rescue (SAR) emergency response is characterised by an emergency command centre that coordinates the actions of various units, facilitating cooperation and improving overall effectiveness. Maritime SAR is particularly challenging because missions are divided into multiple smaller operations, including patrolling, travel to the event, directly collecting people at sea, collecting people by other means (floating devices or smaller boats), and safely returning people to land (Varlamis et al., Reference Varlamis, Tserpes and Sardianos2018). Evaluating the performance of a SAR unit (a ship, normally) during operations is critical for accessing timely information, including mission details, evolution, and completion.
In addition to the nature of the maritime emergency, the number, jurisdiction, and professional characteristics of rescue participants determine the complexity of the maritime rescue emergency command and implementation. For example, participating units and ships vary markedly in terms of their capabilities and professional classifications. If the collaborative task is not well executed, the efficiency of the overall rescue task will be diminished, and it will be harder for each SAR unit to complete its task. Loopholes in the organisation, command, and coordination of operations may lead to chaos in the SAR process or even affect the safety of the operation itself. Consequently, it is vital for the SAR commander have real-time access to the working status of various SAR forces, the execution status of SAR missions, and the execution efficiency of SAR schemes. Therefore, this study proposes a method to evaluate the progress of maritime SAR missions using automatic identification system (AIS) data.
2. RELATED WORK
The aim of this study is to evaluate the performance of a SAR unit within a set time period. To achieve this, the completion of a SAR mission area within the required time period is used as the evaluation basis to determine the efficiency of SAR task execution. In this process, the location of the SAR unit is necessary. Ship location information is mainly derived from AIS and radar. Regulation 19 of the International Convention on Safety of Life at Sea (SOLAS) requires AIS to be fitted aboard all ships of 300 gross tonnage and upwards engaged on international voyages, cargo ships of 500 gross tonnage and upwards not engaged on international voyages, and all passenger ships irrespective of size (International Maritime Organization, 2002). AIS has proven itself to be a valuable source for ship traffic information exchanging messages between ships and to traffic management centres (Tsou, Reference Tsou2010). The system can aid in ship identification and assist in tracking, exchange of information, and collision avoidance. In previous studies, AIS data has been used to study vessel traffic characteristics to improve safety and efficiency further. These characteristics include navigation patterns (Gunnar Aarsæther and Moan, Reference Gunnar Aarsæther and Moan2009; Silveira et al., Reference Silveira, Teixeira and Guedes Soares2013), navigational risk assessment (Li et al., Reference Li, Lu, Niu, Liu and Liu2017), and the mapping of global shipping density (Wu et al., Reference Wu, Xu, Wang, Wang and Xu2016). In the field of ship-collision avoidance, spatiotemporal AIS information has been used to determine collision probability (Zhang et al., Reference Zhang, Kopca, Tang, Ma and Wang2017). In addition, AIS information is often used in association with radar; the combined data can improve overall tracking performance with respect to estimation accuracy, false tracks, and missed detections over a single source (Kazimierski and Stateczny, Reference Kazimierski and Stateczny2015). These studies show that spatial and temporal information from AIS is important in the scientific research of navigation.
There are two main research areas with respect to maritime SAR: operational support (Shchekinova et al., Reference Shchekinova, Kumkar and Coppini2016; Brushett et al., Reference Brushett, Allen, King and Lemckert2017) and strategic planning (Park et al., Reference Park, Heo, Jun, Kwon, Kim, Choi, Cho, Choi, Seo, Kim, Kim, Yang, Lee, Kim, Kim, Choi and Jeong2015; Razi and Karatas, Reference Razi and Karatas2016; Tong et al., Reference Tong, Wang and Song2017). Operational support is concerned with how real-time SAR operations can be supported by computational methods while strategic planning aims to evaluate the overall performance of the SAR response system. Furthermore, some researchers have focused on the optimisation of plans for siting maritime SAR resources and related decisions (Pelot et al., Reference Pelot, Akbari and Li2015; Akbari et al., Reference Akbari, Pelot, Eiselt and MacMackin2017).
Meanwhile, AIS data has been extensively used in SAR research. For example, Li et al. (Reference Li, Chung, Xie, Yang, Wang and Geng2018) presented an improved design for the AIS Man Overboard device, a state-of-the-art maritime technology that has been widely adopted for SAR purposes. Furthermore, Varlamis et al. (Reference Varlamis, Tserpes and Sardianos2018) presented a tool that automatically detected maritime SAR missions by employing AIS data streams. X. Zhou et al. (Reference Zhou, Pan and Jiang2019) proposed a framework based on island spatial information to determine optimal locations for maritime SAR bases. The potential demand for rescue activities was estimated using AIS data and marine casualty and incident data.
Previous studies have also shown that AIS data has limitations. For example, reliability issues may arise from errors in the AIS information itself, manual data inputs, ships failing to update AIS information, or transponder failure. Harati-Mokhtari et al. (Reference Harati-Mokhtari, Wall, Brooks and Wang2007) investigated regulations, supervision for proper use, training, and management of AIS users. The findings show that the data provided by AIS are not reliable in many cases and therefore mariners cannot trust the equipment completely. Wu et al. (Reference Wu, Xu, Wang, Wang and Xu2016) proposed an algorithm to account for data when a ship appeared to have moved unreasonably large distances. The present author (F. Zhou et al., Reference Zhou, Cheng, Zhang, Yan, Ruan, Min and Li2019) proposed a new method to verify AIS data using video images taken by an unmanned aerial vehicle. To ensure the reliability of AIS data in this analysis, data were treated according to the methods of Sang et al. (Reference Sang, Wall, Mao, Yan and Wang2015) and Duan et al. (Reference Duan, Wang and Wang2015).
In summary, research to date has mainly focused on prediction prior to maritime accidents or statistical analysis following them. However, relatively few studies have investigated potential methods to improve the efficiency of maritime SAR during incident response. As a location information source, AIS data can play an important role in SAR and as such, research into how these data can be used to improve SAR is vital. Therefore, this paper proposes a maritime SAR mission evaluation method using spatial analysis of AIS data.
3. MATHEMATICAL MODEL
3.1. Data treatment
In the calculation process, AIS position information in the World Geodetic Spheroid (WGS)-84 coordinate system (a three-dimensional spherical coordinate system) was converted to a spatial rectangular coordinate system for spatiotemporal analysis. Dynamic information from AIS equipment is mainly communicated via a global navigation satellite system (GNSS) receiver, log, gyrocompass, and other sensors. The GNSS receiver provides ship position information and universal time-sharing system (UTS) time, the log provides speed over ground, and the gyrocompass provides the course and heading. At different times in the same position, AIS location information may differ by tens of metres. The difference between the transmitted and actual speed over ground is generally within 0·5 m/s (Duan et al., Reference Duan, Wang and Wang2015). There is a relationship between the ship's position, speed, and direction over time. Therefore, based on this relationship, we can verify and correct ship location information in AIS.
Ship speed (v), course over ground (θ), and position (x, y) are related according to the following.
 $$\left\{ \matrix{v = \sqrt {{\left( {\displaystyle{{\partial x} \over {\partial t}}} \right)}^2 + {\left( {\displaystyle{{\partial y} \over {\partial t}}} \right)}^2} \hfill \cr \tan \theta = \displaystyle{{\partial y} \over {\partial x}} \hfill} \right.$$
Because speed changes are generally small, they can be regarded as uniform or uniformly accelerated motion. Therefore, position is fitted as a function of time using the quadratic polynomial:
 $$\left\{ {\matrix{ {x = a_2t^2 + a_1t + a_0} \hfill \cr {y = b_2t^2 + b_1t + b_0} \hfill \cr {v = \sqrt {{{\rm (}2a_2t + a_1{\rm )}}^2 + {{\rm (}2b_2t + b_1{\rm )}}^2} } \hfill \cr {\tan \theta = \displaystyle{{2a_2t + a_1} \over {2b_2t + b_1}}} \hfill \cr } } \right.$$
where t is time and v, tan θ, and (x, y) can be obtained from AIS. Because AIS data is continuous, each calculation window has n time of observation values. Then, Equation (2) is calculated for each time period and least squares adjustment is used to determine the predicted position of the ship. When the calculation of the data in the window is completed, the window moves back one bit according to the observation value sequence and the position is calculated again. As the calculation window moves, the same position is calculated n times. The final position is derived from the average value of multiple calculation windows.
3.2. Estimation of SAR area
Once AIS data are processed, the track of the target ship within a period of time is obtained. The ship's track is regarded as a linear geometric object, and the estimated search and rescue area is generated using a line buffer algorithm. The specific process is as shown in Figure 1.

Figure 1. Buffer zone of the track polyline.
The positions of the target ship (P 1, P 2, …, P n) are connected to derive the track line (polyline L). The polyline L is then used as the reference axis and parallel lines are generated at a distance (H; depending on visual distance) on both sides of the reference axis. Near the endpoints of polyline L, the two parallel lines are connected by smooth curves, representing the field of view. The closed area formed by the points of the parallel lines is the buffer zone of polyline L. As shown in Figure 1, the convex side at the end point of L is fitted using an arc with radius H, the intersection point of two buffer lines is used as a corresponding buffer point on the concave side.
When the curved space of the axis allows the buffer boundary to be pressed by itself, the buffer line will become self-intersecting and form multiple self-intersecting polygons, including island polygons and overlapping polygons, as shown in Figure 2. The purpose of buffer line self-intersection processing is to identify whether the self-intersection produces an island polygon or an overlapping polygon. This can be determined by the distance between the self-intersection point and the axis. Once identified, overlapping polygons are deleted and island polygons are preserved.

Figure 2. Self-intersecting buffer zone.
Figure 3 shows that overlapping polygons require processing, and the line segments or arcs falling inside a feature can be identified automatically through topology analysis. Line segments or arcs can then be deleted to obtain the interconnecting buffer after processing.

Figure 3. Processing of buffer overlaps.
3.3. Evaluation of a SAR mission
To begin the process of evaluating an SAR plan, it is necessary first to define the search area. The completion degree of the SAR area is then used to evaluate the overall progress of the SAR mission. The different search modes used in SAR are shown in Figure 4 and include the extended square, sector, parallel line, and creeping sweep search patterns (Agbissoh Otote et al., Reference Agbissoh Otote, Li, Ai, Gao, Xu, Chen and Lv2019).

Figure 4. Search modes used in maritime search and rescue (SAR).
The search area of the SAR unit can be obtained using search tracks and buffer algorithms within a set time period. The SAR completion area and SAR mission area are then superimposed and analysed (Figure 5). Topological relationships are reconstructed according to the cut arcs. Finally, the area ratio of newly stacked polygons falling into the search polygons is determined, which is considered to be the completion of the SAR mission.

Figure 5. Schematic diagram of overlay analysis for SAR mission evaluation.
In addition, Figure 6 shows that time can be introduced as a third dimension on the basis of a two-dimensional plane to form a virtual three-dimensional space. This space differs from that of three-dimensional space in ordinary real time because time is used to replace elevation. In the SAR process, the SAR unit can be located at different positions within this three-dimensional space. If these positions are connected to form a spatial-temporal path, the search and rescue progress of SAR units can be more intuitively displayed.

Figure 6. Spatiotemporal path of the SAR unit.
4. APPLICATION
To validate this method in actual SAR operations, the technique was applied to the Haixun01 SAR command platform in China. Haixun01 is China's largest and most advanced large-scale cruise rescue ship, which has participated in and commanded several maritime SAR missions.
The architecture of the experimental demonstration platform is shown in Figure 7. Using the platform, the mission commander can formulate and evaluate SAR missions and send them to shore-based command centres or other SAR forces through communication satellites and other technical means.
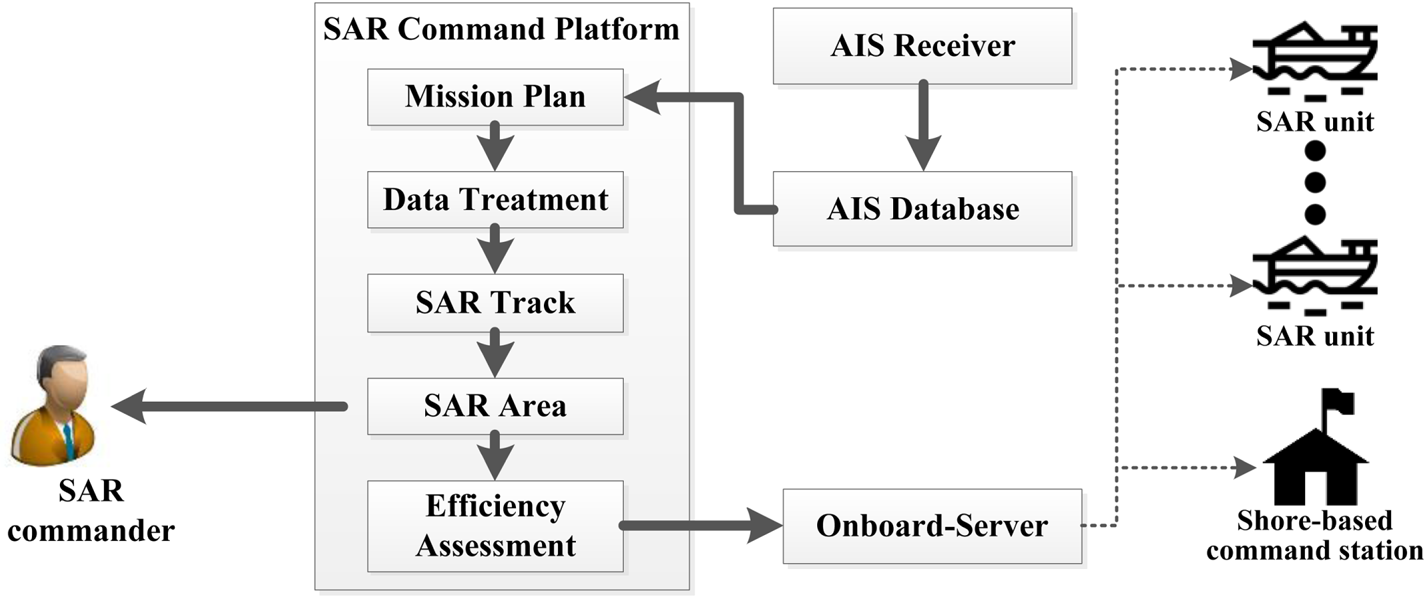
Figure 7. Architecture of the experimental demonstration platform.
The SAR software system user interface is shown in Figure 8. The AIS information in the software was received by Haixun 01 in the East China Sea during cruising. The program can quickly formulate SAR areas and divide the mission appropriately. Meanwhile, during the SAR process, the software can evaluate the mission implementation of SAR forces in real time, simplifying communication and coordination tasks.

Figure 8. Software system user interface (Haixun01 SAR command platform).
The user interface of the software to evaluate SAR mission progress is shown in Figure 9. In the main interface, four SAR ranges (labelled 0–3) are set, and the ship track within the SAR target area is marked in red. The progress of individual SAR units can be evaluated using the pop-up dialog. Historical track lines of a SAR unit are used to determine progress within a SAR area based on the line buffer algorithm and the degree of completion of the SAR mission area is obtained through superimposition.

Figure 9. SAR evaluating user interface (Haixun01 SAR command platform).
5. CONCLUSION
In maritime SAR, the mission commander needs to divide the search area into reasonable search areas quickly, and provide intuitive and specific instructions to each SAR unit. Furthermore, it is necessary to monitor the progress of SAR efforts in real time. The success of SAR missions can be detrimentally affected by ambiguous instructions, inappropriately allocated SAR regions, and a lack of real-time information regarding the progress of the search. This study proposed a SAR mission evaluation method using AIS data. AIS data were processed, checked, and refined to improve vessel location precision and determine a continuous track line for the target over time. Vessel track data were superimposed over the SAR mission area to evaluate mission progress and determine mission completion. The method proposed in this paper was deployed on-board Haixun01 in 2017 for use in maritime SAR missions and has played an important role in devising SAR strategies and tracking mission progress during several SAR actions.
The proposed study only considers spatial information as the evaluation basis to determine SAR task execution efficiency, while neglecting other factors such as weather and ocean circulation in the SAR process. However, the approach is novel, and more evaluation factors can be considered in subsequent studies. Presently, the system is reliant on AIS data to obtain accurate ship location data. However, to accommodate cases where SAR missions do not have access to AIS information, future research should focus on developing capabilities to access radar, video, and other information sources to provide information support to SAR missions.
ACKNOWLEDGEMENTS
This research was supported by the National Natural Science Foundation of China (grant no. 41701523), Major Project in Social Development Sector of Shanghai Science and Technology Commission (Research on and Demonstration of Key Technologies of Intelligent Maritime Search and Rescue System, grant no. 18DZ1206300) and the Special Foundation for Intelligent Manufacturing Industry of Shanghai Lin-Gang Area (grant no. ZN2017020325).


