Underage drinking remains a pervasive and serious public health concern. Peer drinking norms are arguably one of the strongest correlates of adolescent drinking (Jackson, Sher, & Park, Reference Jackson, Sher, Park, Galanter, Lowman, Boyd, Faden, Witt and Lagressa2005). Perceived peer drinking norms refer to perceptions of peers' typical drinking behaviors (descriptive norms) and of peers' prevailing attitudes toward drinking (injunctive norms; Borsari & Carey, Reference Borsari and Carey2003). The strong association between adolescent drinking and peer drinking norms is likely due to both selection (i.e., individuals tend to select into social environments compatible with their own behaviors and attitudes) and socialization (i.e., individuals' behaviors are influenced by their normative beliefs and social interactions). Individuals tend to select friends whose attitudes and behaviors are compatible with their own. This tendency has been referred to as “niche seeking” (Buss, Reference Buss1987), “proactive person–environment interaction” (Caspi & Bem, Reference Caspi, Bem and Pervin1990), and “active genotype–environment correlation” (Scarr & McCartney, Reference Scarr and McCartney1983). Individuals also change their behaviors to bring them more in line with their peers' prevailing attitudes and behaviors (Perkins & Berkowitz, Reference Perkins and Berkowitz1986). Most adolescent drinking occurs in social settings (Kuntsche, Knibbe, Gmel, & Engels, Reference Kuntsche, Knibbe, Gmel and Engels2005), and adolescents tend to emulate their peers' drinking behaviors (Quigley & Collins, Reference Quigley and Collins1999). Evidence from prospective studies (Curran, Stice, & Chassin, Reference Curran, Stice and Chassin1997; Park, Sher, Wood, & Krull, Reference Park, Sher, Wood and Krull2009) supports both peer-selection and peer-socialization processes; adolescent drinking at a prior time point is associated with their perception about peers' drinking at a later time point, and in turn their perception about peers' prior drinking is associated with changes in adolescent drinking over time. The reciprocal influences between adolescent and peer drinking norms seem to be one of the mechanisms by which adolescent drinking accelerates over time (Park et al., Reference Park, Sher, Wood and Krull2009).
Evidence from behavioral genetic studies suggests that heredity modulates the strength of the association between adolescent and peer drinking. For example, studies using female twin data (Agrawal et al., Reference Agrawal, Balasubramanian, Smith, Madden, Bucholz and Heath2010) and genetically informative sibling data (Guo, Elder, Cai, & Hamilton, Reference Guo, Elder, Cai and Hamilton2009; Harden, Hill, Turkheimer, & Emery, Reference Harden, Hill, Turkheimer and Emery2008) showed that adolescents high in genetic susceptibility to substance use reported more friends with heavy substance use, and high-risk adolescents' substance use was more influenced by their friends' substance use than that of low-risk adolescents.
One genotype that may modulate the association between peer environments and adolescent drinking is a variant of the dopamine receptor D4 (DRD4) gene. The dopamine system plays a prominent role in the neurobiological basis of reward, craving, and dependence (Wise, Reference Wise2004). The DRD4 gene has a functional polymorphism, which has a 48 base pair variable number tandem repeat (VNTR) sequence ranging from 2- to 11-repeat alleles (Van Tol et al., Reference Van Tol, Wu, Guan, Ohara, Bunzow and Civelli1992). Compared to other alleles, the 7-repeat (7R) allele is associated with reduced responsiveness to dopamine in the brain (Asghari et al., Reference Asghari, Sanyal, Buchwaldt, Paterson, Jovanovic and Van Tol1995). Although findings linking the DRD4 VNTR polymorphism and diverse alcohol-related behavioral phenotypes in adults (for a review, see McGeary, Reference McGeary2009) and in adolescents (Ray et al., Reference Ray, Bryan, Mackillop, McGeary, Hesterberg and Hutchison2009; Skowronek, Laucht, Hohm, Becker, & Schmidt, Reference Skowronek, Laucht, Hohm, Becker and Schmidt2006; but see Hopfer et al., Reference Hopfer, Timberlake, Haberstick, Lessem, Ehringer and Smolen2005) are mixed, the presence of the 7R allele (or the longer 7R to 11-repeat alleles in some studies) has been associated with greater neural responses to alcohol cues (Filbey et al., Reference Filbey, Ray, Smolen, Claus, Audette and Hutchison2008; Hutchison, McGeary, Smolen, Bryan, & Swift, Reference Hutchison, McGeary, Smolen, Bryan and Swift2002; Ray et al., Reference Ray, Miranda, Tidey, McGeary, Mackillop and Gwaltney2010).
Emerging evidence suggests that the reciprocal influence between peer environments and adolescent drinking may differ as a function of the DRD4 VNTR. In terms of peer socialization, the presence of a heavy-drinking peer confederate in an experimental setting increased alcohol consumption to a greater degree in carriers of the 7R allele than in noncarriers (Larsen et al., Reference Larsen, van der Zwaluw, Overbeek, Granic, Franke and Engels2010). In addition, carriers reported more symptoms of alcohol dependence than did noncarriers when involved in college and fraternity/sorority organizations (Park, Sher, Todorov, & Heath, Reference Park, Sher, Todorov and Heath2011), environments characterized by high peer drinking norms (Park et al., Reference Park, Sher, Wood and Krull2009). A recent longitudinal study of 340 individuals assessed at ages 17, 23, 29, and 33 found that both previous and current friends' alcohol use predicted carriers' alcohol use at age 33 but not noncarriers' alcohol use (Mrug & Windle, Reference Mrug and Windle2014). However, a longitudinal study of 308 Dutch adolescents (van der Zwaluw, Larsen, & Engels, Reference van der Zwaluw, Larsen and Engels2012) found that the overall prospective association between perceived peer drinking norms and adolescents' past-week alcohol quantity did not differ across the DRD4 VNTR from ages 13 to 17; though, when peer drinking norms were modeled as time varying, a significant interaction between the genotype and peer norms was found at age 16 (but not at other ages). Thus, extant findings have been mixed regarding a moderating role of the DRD4 VNTR in peer socialization. In terms of peer selection, van der Zwaluw et al. (Reference van der Zwaluw, Larsen and Engels2012) and Mrug and Windle (Reference Mrug and Windle2014) found no difference across the DRD4 VNTR in the effect of prior alcohol use on later peer norms. However, there is evidence that peer selection is in part determined by genetic variants; polymorphisms in μ-opioid receptor M1 (Chassin et al., Reference Chassin, Lee, Cho, Wang, Agrawal and Sher2012) and the dopamine transporter (Beaver, Wright, & DeLisi, Reference Beaver, Wright and DeLisi2008) were associated with affiliation with heavy drinking and delinquent peers, respectively. Thus, the potential moderating role of the DRD4 VNTR in peer selection merits further investigation.
The current study evaluated the hypothesis that the reciprocal influences between perceived peer drinking norms and adolescent drinking over time differ as a function of the DRD4 VNTR. Specifically, we tested whether effects of prior alcohol use on later perceived peer drinking norms (drinking-based peer selection) and effects of prior peer norms on later alcohol use (socialization via perceived peer drinking norms) are greater in carriers of the 7R allele than in noncarriers. To address concerns about replication in Gene × Environment (G × E) interaction studies (Bookman et al., Reference Bookman, McAllister, Gillanders, Wanke, Balshaw and Rutter2011), we tested the G × E interaction in two samples, one detection sample and one confirmation sample. We applied direct replication in G × E studies (Duncan & Keller, Reference Duncan and Keller2011), using the same statistical model on the same environmental and outcome constructs (despite several differences in the number of items or response options as described in the Measures section) across two data sets.
Methods and Materials
Participants and procedures
Sample 1
Data are drawn from Project inSight, a prospective study of adolescents entering the 9th grade in a Northeastern, midsized city. Among the 250 adolescents who participated at Time 1 (T1), 202 were invited to participate in the 6-month follow-up assessment (Time 2 [T2]; 48 were not contacted due to scheduling constraints at the end of the project period), and 182 (90% of those invited) completed the T2 assessment. Parental consent and adolescent assent were obtained. All study measures and procedures were reviewed and approved by the institutional review board.
For the current analyses, data from 174 participants (70% of the T1 sample, mean age = 14.53 years at T1, SD = 0.76) were used, after excluding 1 adolescent who had missing demographic data and 75 adolescents who did not provide a biological sample for genotyping (saliva donation was optional). Adolescents who were excluded from the current analyses (n = 76) and those retained did not differ on any of the study variables (p = .32–.82).
Sample 2
Data are drawn from Alcohol, Health and Behavior, a prospective high-risk study of 489 incoming first-year students (51% family history of alcoholism) at a large Midwestern university (Sher, Walitzer, Wood, & Brent, Reference Sher, Walitzer, Wood and Brent1991). This sample was followed up at the mean ages of 18, 19, 20, 21, 25, 29, and 34 years. At the mean age of 35 years, the baseline sample was invited to participate in a genetic component. Written consent was obtained from each participant. All measures and procedures were reviewed and approved by the institutional review board.
For the current analyses, the data collected at the mean ages of 18, 19, and 20 (T1 to Time 3 [T3], corresponding to the first 3 years of college) were used. We did not include data from the senior year of college and afterward, because our prior study (Park et al., Reference Park, Sher, Todorov and Heath2011) showed that drinking behaviors and their determinants in the senior year and afterward differed from those in the first 3 years of college (which may be due to the legal drinking age and changes in lifestyle).
The final sample included 237 participants of White race (mean age = 18.48 years at T1, SD = 0.60, 49% family history of alcoholism). Because a White ancestry proportion score was not available and 94% of participants were White by self-report, only White participants were included for the current analyses to avoid potential confounding due to admixture and population stratification. Among 459 White participants in the original sample, 220 who did not provide a biological sample for genotyping and 2 missing in family history were further excluded. Compared to participants retained, excluded individuals were more likely to report higher alcohol frequency at T1, t (455) = 2.00, p = .046. No other differences were found (p = .06–.97).
Measures
Demographics
In Sample 1, participants reported their sex and race at T1. Sample 1 was racially diverse and mixed, with 44% Black, 20% White, 5% Native American, 2% Asian, 23% multiracial, and 6% declining to respond. Because the frequency of the DRD4 7R allele varies considerably across different populations (Kidd, Pakstis, & Yun, Reference Kidd, Pakstis and Yun2014), we controlled for potential confounding due to admixture and population stratification (Hoggart et al., Reference Hoggart, Parra, Shriver, Bonilla, Kittles and Clayton2003) by using a White ancestry proportion score. This White ancestry score was estimated based on a panel of 36 microsatellite genetic ancestry informative markers that determine continental admixture proportions (Londin et al., Reference Londin, Keller, Maista, Smith, Mamounas and Zhang2010) using the STRUCTURE software (Pritchard, Stephens, & Donnelly, Reference Pritchard, Stephens and Donnelly2000). Scores ranged from 0 to 1, with a higher score indicating greater proportion of White ancestry in the genetic makeup. This White ancestry score was included as a covariate in Sample 1 analysis.
In Sample 2, data on students' sex was obtained from the registrar's office of the university. Family history of alcohol use disorders was assessed with adapted versions (Crews & Sher, Reference Crews and Sher1992) of the Short Michigan Alcoholism Screening Test (Selzer, Vinokur, & van Rooijen, Reference Selzer, Vinokur and van Rooijen1975) and the Family History–Research Diagnostic Criteria interview (Endicott, Andreasen, & Spitzer, Reference Endicott, Andreasen and Spitzer1978). A dichotomized variable of family history (1 = positive; 0 = negative) was included as a covariate in Sample 2 analyses to account for oversampling participants with a family history; family history of alcoholism was not assessed or included as a covariate in Sample 1 analyses.
DRD4 gene polymorphism
In both samples, genotyping the DRD4 48 base pair VNTR in exon 3 was performed as described by LaHoste et al. (Reference LaHoste, Swanson, Wigal, Glabe, Wigal and King1996). The observed numbers of repeats per allele were 2 (7%, 11%), 3 (3%, 5%), 4 (62%, 61%), 5 (4%, 0.6%), 6 (1%, 1%), 7 (18%, 20%), 8 (4%, 1%), and 10 (1%, 0.4%) repeats in Samples 1 and 2, respectively. In Sample 1, allele frequencies were in Hardy–Weinberg equilibrium in self-reported Blacks (χ2 = 0.50, p = .48) and Whites (χ2 = 0.39, p = .53) as well as in the entire sample (χ2 = 0.02, p = .89). In Sample 2, consisting of Whites only, allele frequencies were also in Hardy–Weinberg equilibrium (χ2 = 0.08, p = .78). For data analyses, a dichotomized variable (1 = carrying one or two 7R alleles, 0 = carrying no 7R allele) was used for both Sample 1 (33% carriers) and Sample 2 (35% carriers).
Perceived peer drinking norms
In Sample 1, three items were administered to measure peer norms, including one item assessing descriptive norms (i.e., “How many of your friends drink beer, wine, or other alcohol beverages?”) and two items assessing injunctive norms (i.e., “How do most of your friends feel about drinking at your age?” and “How do most of your friends feel about getting drunk at your age?”). Adolescents responded based on a 0 to 4 scale, with high scores representing higher norms. An average score of the three items (α = 0.83 at T1 and 0.75 at T2) was used in Sample 1 main analyses. Note that ancillary analyses of cross-lagged panel models with the two injunctive norm items yielded the same results as those of all three peer norm items reported here. However, analyses with the single descriptive norm item yielded nonsignificant genetic moderation in peer selection and socialization.
In Sample 2, six items were administered to measure peer norms, including two items assessing descriptive norms (e.g., “How many of your close friends drink alcohol?”) and four items assessing injunctive norms (e.g., “How do most of your friends feel about drinking?”; Jessor & Jessor, Reference Jessor and Jessor1977). Students responded using a 0 to 4 scale, with high scores representing higher norms. An average of the six items (α = 0.88–0.90 at T1 through T3) was used in Sample 2 main analyses. Note that ancillary analyses with injunctive norm items and descriptive norm items separately yielded the same results as those of all six peer norm items reported here.
Alcohol behaviors
In both samples, an item assessing the past-month frequency of alcohol use was used. Adolescents responded based on a 0 to 4 scale (0 = 0 days, 4 = 10 or more days) in Sample 1, and on a 0 to 7 scale (0 = 0 days, 7 = every day) scale in Sample 2. Note that ancillary Sample 2 analyses were conducted with an additional item assessing the number of alcoholic drinks consumed on a typical drinking occasion in the past year (the item was not available in Sample 1 data); nonsignificant genetic moderation in peer selection and socialization was found.
Analytic strategies
Means, percentages, and bivariate correlation coefficients of the study variables were calculated. As main analyses, cross-lagged panel models were estimated using Mplus, Version 6.12 (Muthén & Muthén, Reference Muthén and Muthén1998–2012) structural equation modeling software. Maximum likelihood estimation with robust standard errors (MLR) was used to deal with the nonnormality of alcohol and peer norm variables. To accommodate missing data, we used a full-information maximum likelihood procedure, which has been shown to generate excellent estimates and reasonable standard errors and to be robust to violation of the assumption of normal distribution and random missing data (Graham, Cumsille, & Elek-Fisk, Reference Graham, Cumsille, Elek-Fisk, Schinka and Velicer2003). The goodness of fit for a model was assessed using multiple indices (Hu & Bentler, Reference Hu and Bentler1999): a nonsignificant chi-square test, the root mean square error of approximation (RMSEA) ≤ 0.06, the standardized root mean square residual (SRMR) ≤ 0.08, the comparative fit index (CFI), and the Tucker–Lewis index (TLI) ≥ 0.95.
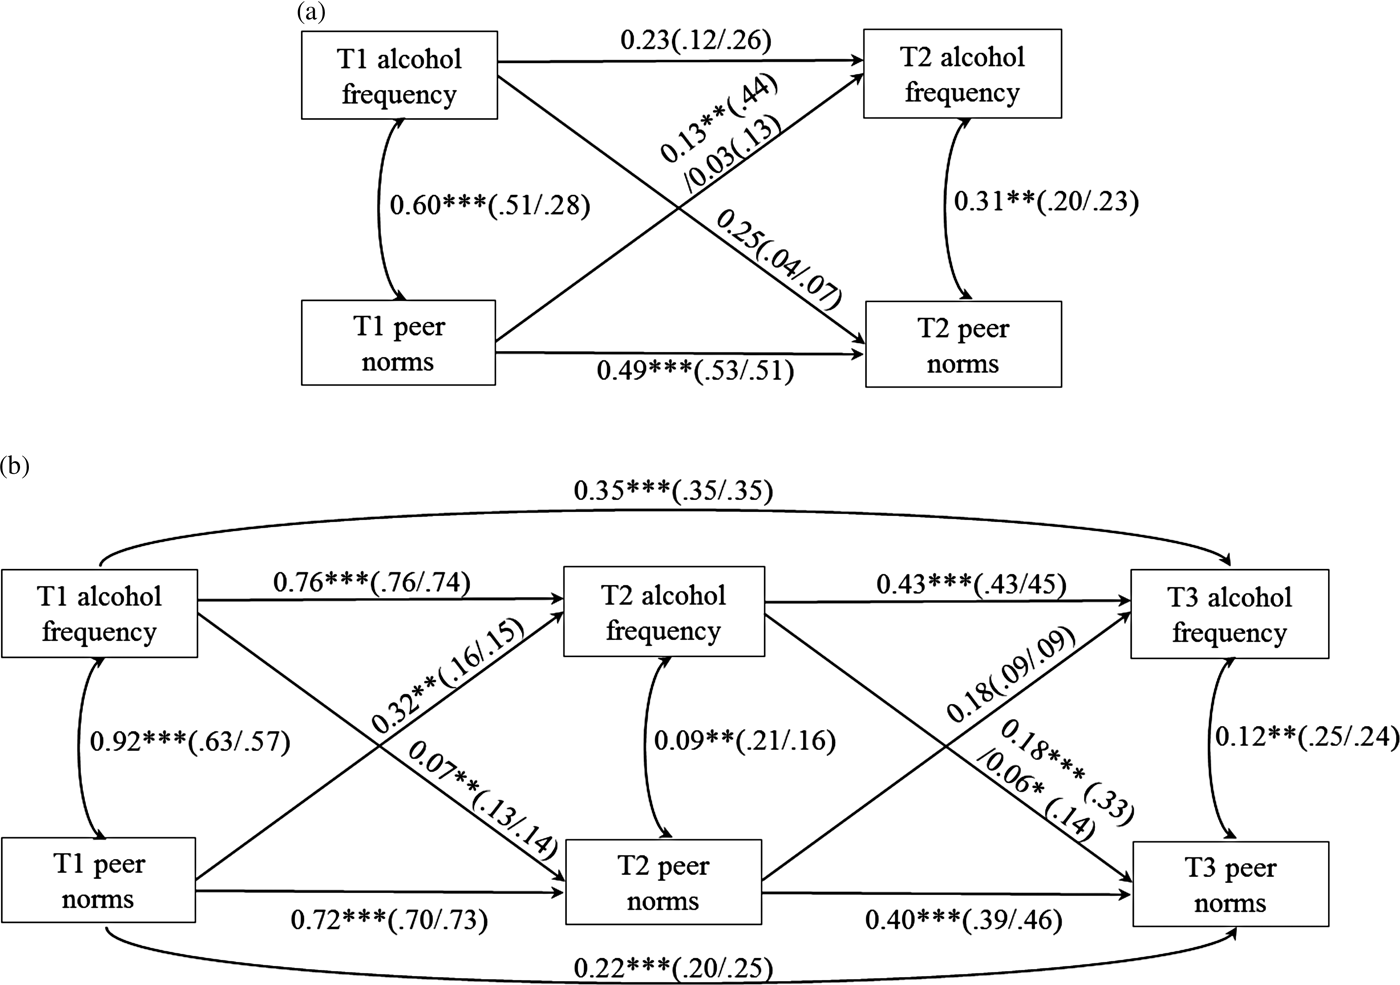
The cross-lagged model estimated the reciprocal influence between peer norms and alcohol frequency over time. For Sample 1 analyses, peer norms and alcohol variables at T1 and T2 were included (see Figure 1a). Autoregressive paths within the same variable (e.g., a path from T1 peer norms on T2 peer norms) represent the stability of each variable across time. Contemporaneous paths between peer norm and alcohol frequency measured at the same time represent the cross-sectional associations between the two variables. Finally, cross-lagged paths from one variable to another variable measured at different time points (e.g., a path from T1 peer norms on T2 alcohol frequency) represented prospective reciprocal influences between the two variables. Specifically, a cross-lagged path from T1 peer norms to T2 alcohol frequency represented peer socialization via peer drinking norms, whereas a cross-lagged path from T1 alcohol frequency to T2 peer norms represented drinking-based peer selection. Main effects of sex and White ancestry on all alcohol and peer norm variables at T1 and T2 were controlled for (paths not shown in figures for simplicity).
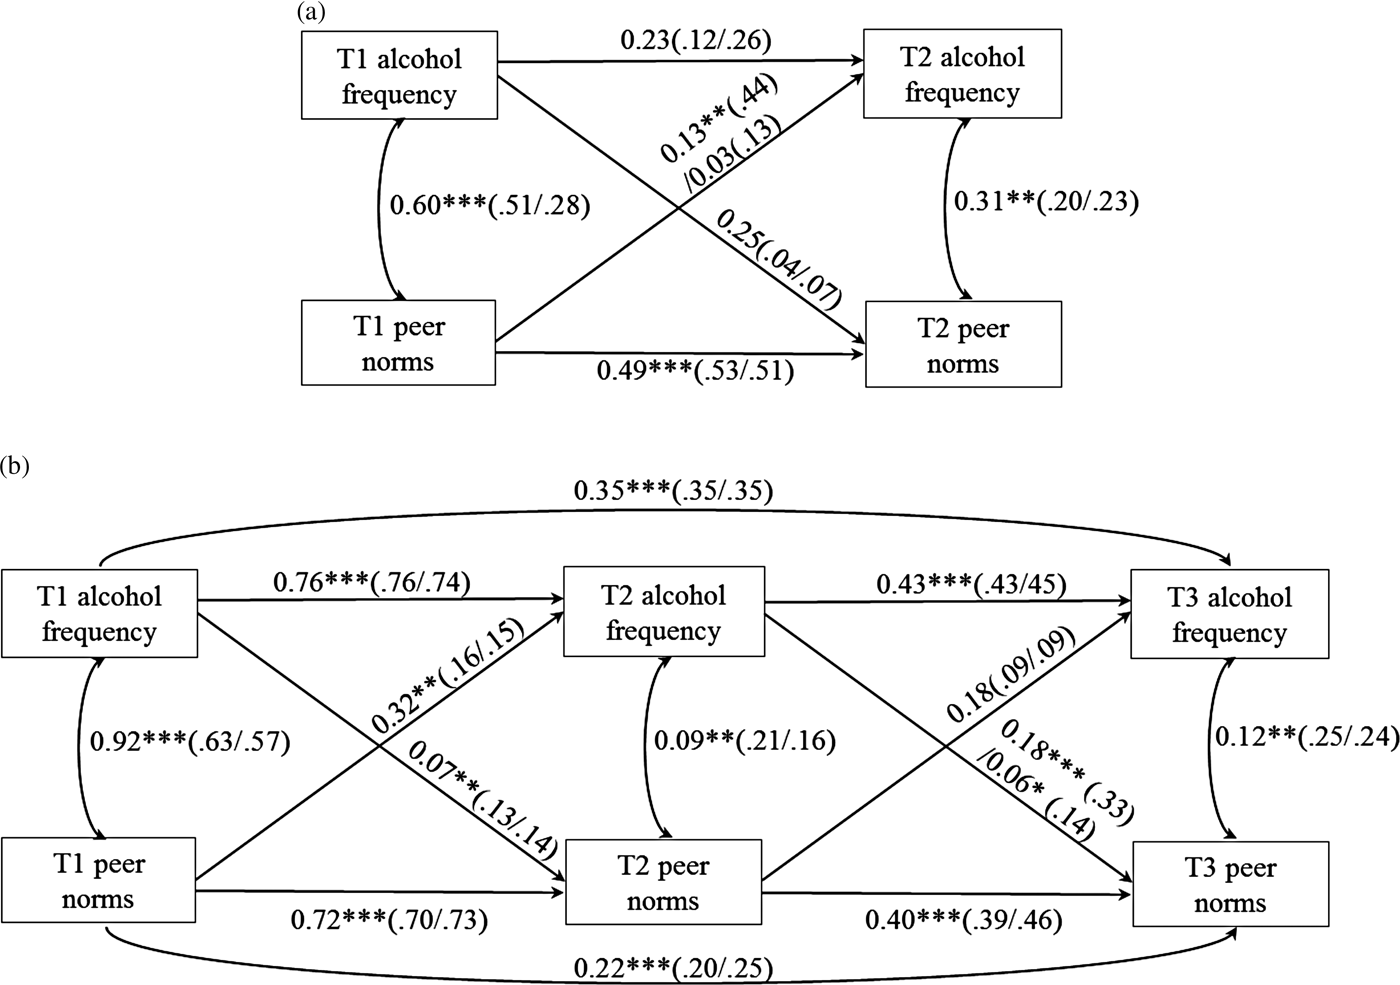
Figure 1. Unstandardized (standardized) path coefficients resulting from the best fitting final path models of (a) Sample 1 and (b) Sample 2. Coefficients for carriers of the seven-repeat allele are shown on the left side of the dash; coefficients for noncarriers are shown on the right side of the dash. In the Sample 1 model, sex and White ancestry effects on all alcohol and peer norm variables at Time 1 (T1) and Time 2 (T2) were controlled for; in the Sample 2 model, sex and family history of alcoholism on all alcohol and peer norm variables at T1 through Time 3 (T3) were controlled for (covariates' paths not shown for simplicity). *p < .05. **p < .01. ***p < .001.
For Sample 2 analyses, reciprocal associations between peer norms and alcohol variables at T1 through T3 were specified consistent with Sample 1 models (see Figure 1b). Again, a cross-lagged path from peer norms at a prior time point to alcohol frequency at a subsequent time point represented peer socialization via peer norms, whereas a cross-lagged path from alcohol frequency at a prior time point to peer norms at a subsequent time point represented drinking-based peer selection. Main effects of sex and family history of alcoholism on all alcohol and peer norm variables at T1 through T3 were controlled for (paths not shown in figures for simplicity). In addition to autoregressive paths from T1 to T2 and T2 to T3 alcohol and peer norm variables, autoregressive paths from T1 to T3 alcohol and T1 to T3 peer norm variables were estimated. With these two paths estimated, better model fits were obtained, which suggest the similarity in alcohol behaviors and peer norms over 2 years (in addition to 1 year). We note that ancillary analyses of models without these paths yielded the same results as those reported here (albeit slightly worse model fit indices).
To test whether the association between peer norms and alcohol use differed as a function of the 7R allele, multigroup analysis was conducted for each of the autoregressive, contemporaneous, and cross-lagged paths. This involved a chi-square difference test with one degree of freedom between a fully unconstrained model (where the coefficient of all paths was estimated separately across groups) and a constrained model (where the coefficient of only the path under comparison was constrained to be the same across groups). Coefficients of paths from all covariates on alcohol and peer norm variables were estimated separately across groups in all models. Because MLR estimation yields scaled chi-square values robust to nonnormality, chi-square values of the two compared models were rescaled to obtain approximate statistics using the MLR scaling factor corrections before conducting a chi-square difference test (Satorra & Bentler, Reference Satorra and Bentler2001).
In addition to the main analyses of multigroup cross-lagged panel models, ancillary path models were estimated to control for potential confounding interaction effects of covariates with all predictors in the model, as suggested by Keller (Reference Keller2014). Because the mutigroup analyses across the genotype do not allow us to test interaction effects of the genotype with covariates, saturated path models using the MLR estimator were estimated. In the Sample 1 path model, T2 alcohol and peer norm variables were included as outcomes. The DRD4 VNTR, T1 alcohol and peer norm variables, two covariates (i.e., sex and White ancestry), and all possible two-way interaction terms between these variables were included as predictors. Path models of Sample 2 with two covariates (i.e., sex and family history) were specified consistent with the Sample 1 model.
Regarding criterion of successful replication, we used a p value of .05 as a cutoff score. Due to the impact of sample size on significance tests, we also calculated Cohen d as a measure of the magnitude of genetic differences in peer selection and socialization. That is, the effect size of genetic difference in peer socialization was obtained by computing the difference between carriers and noncarriers in effect sizes of peer norms at a previous time point on alcohol frequency at a subsequent time point, whereas the effect size of genetic difference in peer selection was obtained by computing the difference between carriers and noncarriers in effect sizes of alcohol frequency at a previous time point on peer norms at a subsequent time point.
A power analysis was performed using Quanto (Gauderman & Morrison, Reference Gauderman and Morrison2006) under the conditions of a dominant genetic model and continuous environmental and alcohol outcome measures. Expected effect sizes of the interaction between the DRD4 VNTR and the peer environment (R 2 = .07; based on calculations from Park et al., Reference Park, Sher, Todorov and Heath2011, converting standardized regression coefficients to R 2), the main effect of the genotype (R 2 = .00; Bau et al., Reference Bau, Almeida, Costa, Garcia, Elias and Ponso2001), and the main effect of prior perceived peer drinking norms on a later alcohol outcome (R 2 = .02; Larimer, Turner, Mallett, & Geisner, Reference Larimer, Turner, Mallett and Geisner2004) were based on prior studies. The results showed that the necessary sample size for power of 0.80 was 106.
Results
Descriptives and correlations
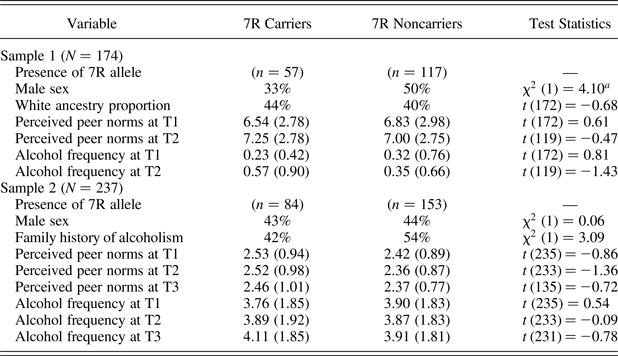
Table 1 presents the means or percentages of the study variables as a function of the DRD4 VNTR within each sample. Results of independent-sample t tests and χ2 tests showed no significant differences between 7R carriers and noncarriers on any of the study variables, except that noncarriers (50%) were more likely to be male than were carriers (33%) in Sample 1, χ2 (1) = 4.10, p = .04.
Table 1. Percentages and means (standard deviations) of study variables as a function of the DRD4 variable number tandem repeat genotype, and group comparison test statistics

Note: For group comparison, independent-sample t tests were used for continuous variables and χ2 difference tests were used for categorical variables. 7R, Seven repeat; T1–T3, Times 1–3.
ap = .04. All other test statistics were nonsignificant at p = .05.
Tables 2 and 3 present bivariate correlation coefficients among study variables in Samples 1 and 2, respectively. Associations of the DRD4 VNTR with demographic characteristics, peer norms, and alcohol use frequencies were nonsignificant in both samples. Associations between peer norms and alcohol use frequencies were significantly positive in both samples.
Table 2. Means (standard deviations) and bivariate correlations of study variables in Sample 1

Note: N = 174. Correlation coefficients significant at p = .05 are in bold. 7R, Seven repeat; T1–T2, Times 1–2.
Table 3. Means (standard deviations) and bivariate correlations of study variables in Sample 2

Note: N = 237. Correlation coefficients significant at p = .05 are in bold. 7R, Seven repeat; T1–T3, Times 1–3.
Multigroup cross-lagged panel models
Sample 1
When the cross-lagged path from T1 peer norms to T2 alcohol frequency was constrained to be same across groups, a significant decrease in model fit was found, Δχ2 (1) = 3.96, p = .047. This result indicates that the effect of prior peer norms on subsequent adolescent alcohol frequency differed in carriers and noncarriers. Chi-square difference tests of other autoregressive, contemporaneous, and cross-lagged paths in the model were nonsignificant, Δχ2 (1) = 0.01–1.55, p = .21–.92.
Thus, the best fitting model was determined as the model where only the cross-lagged path from T1 peer norms to T2 alcohol frequency (as well as paths from covariates to all alcohol and peer norm variables) was estimated separately for each group; the remaining autoregressive, contemporaneous, and cross-lagged paths with nonsignificant group differences were set to be the same across groups for parsimony. Unstandardized (shown outside of parentheses) and standardized (shown inside of parentheses) path coefficients of this final model are presented in Figure 1a. Note that although unstandardized coefficients of the five paths were set to be the same across groups, standardized coefficients differed due to different standard deviations across groups (Kim & Ferree, Reference Kim and Ferree1981). This final model showed an excellent fit to the data, χ2 (5) = 2.63, p = .76, scaling correction factor = 1.05, RMSEA = 0.00, SRMR = 0.03, CFI = 1.00, TLI = 1.00. The cross-lagged path from T1 peer norms to T2 alcohol frequency was significant in carriers (b = 0.13, β = 0.44, p = .007), but nonsignificant in noncarriers (b = 0.03, β = 0.13, p = .21), indicating that peer socialization via peer norms occurred in carriers but not in noncarriers. The cross-lagged path from T1 alcohol frequency to T2 peer norms was nonsignificant regardless of the DRD4 VNTR, indicating that peer selection based on prior drinking did not occur in both groups.
Sample 2
When the cross-lagged path from T2 alcohol frequency to T3 peer norms was constrained to be the same across groups, a significant decrease in model fit was found, Δχ2 (1) = 8.56, p = .003. This result indicates that the effect of prior alcohol frequency on subsequent peer norms differed in carriers and noncarriers. Chi-square difference tests of other autoregressive, contemporaneous, and cross-lagged paths in the model were nonsignificant, Δχ2 (1) = 0.004–3.13, p = .08–.95.
Thus, the best fitting model was determined as the model where only the cross-lagged path from T2 alcohol frequency to T3 peer norms (as well as paths from covariates to all alcohol and peer norm variables) was estimated separately for each group. This final model showed an excellent fit to the data, χ2 (16) = 9.75, p = .88, scaling correction factor = 0.99, RMSEA = 0.00, SRMR = 0.07, CFI = 1.00, TLI = 1.00. As shown in Figure 1b, the coefficient of the cross-lagged path from T2 alcohol frequency to T3 peer norms was bigger in carriers (b = 0.18, β = 0.33, p < .001) than in noncarriers (b = 0.06, β = 0.14, p = .02), indicating that peer selection based on prior drinking was stronger in carriers. The cross-lagged path from T1 alcohol frequency to T2 peer norms was significant regardless of the DRD4 VNTR, indicating that peer selection based on prior drinking did occur in both groups. Regardless of the DRD4 VNTR, the cross-lagged path from T1 peer norms to T2 alcohol frequency (but not from T2 peer norms to T3 alcohol frequency) was significant, indicating that socialization via peer norms occurred at T2 (but not at T3) in both groups.
Path analyses after controlling for covariates' interaction effects
Sample 1
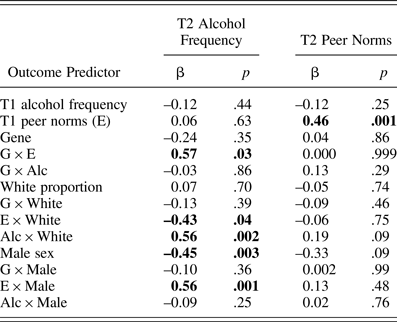
As shown in Table 4, an ancillary path model predicting T2 alcohol frequency and peer norms yielded the same results as the above cross-lagged panel model. That is, a significant interaction effect between the genotype and T1 peer norms on T2 alcohol frequency (b = 0.12, β = 0.57, p = .03) indicated that socialization via T1 peer norms was stronger in carriers than in noncarriers, even after controlling for all covariates' interaction effects.
Table 4. Sample 1 results from a path model testing peer selection and socialization after controlling for covariates' interaction effects with predictors

Note: N = 122 because of missing data on outcome variables. Significant path coefficients at p = .05 are in bold. T1, Time 1; G × E, Gene × Environment; G × Alc, Gene × Alcohol Frequency.
Sample 2
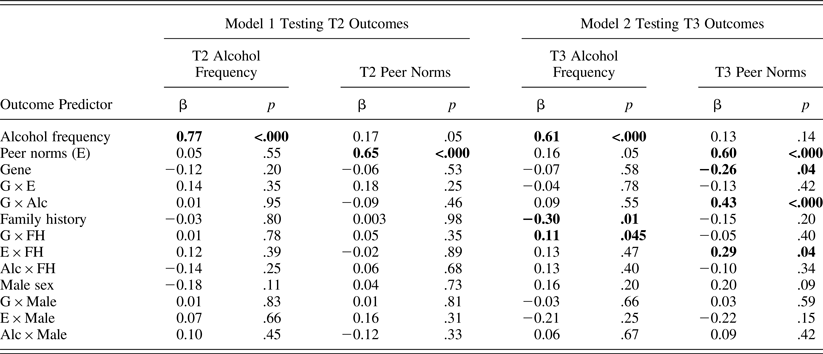
As shown in Table 5, ancillary path models predicting alcohol frequency and peer norms at T2 (shown in the first four columns of data) and at T3 (shown in the fifth to last columns of data) yielded the same results as the above cross-lagged panel model. That is, a significant interaction effect between the genotype and T2 alcohol frequency on T3 peer norms (b = 0.17, β = 0.43, p < .001) indicated that peer selection based on T2 alcohol frequency was stronger in carriers than in noncarriers, even after controlling for all covariates' interaction effects.
Table 5. Sample 2 results from two path models testing peer selection and socialization at T2 and T3 after controlling for covariates' interaction effects with predictors
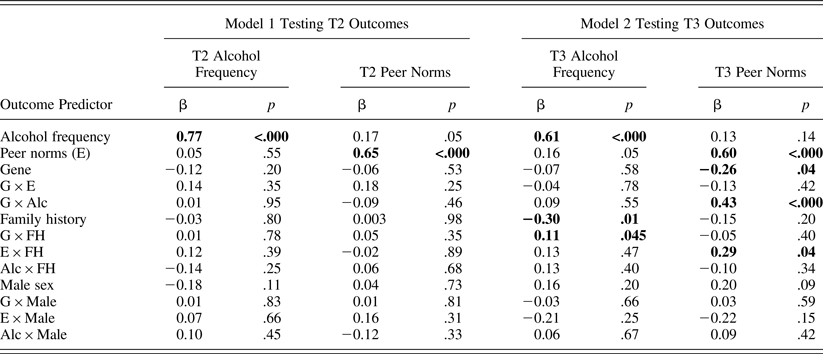
Note: N = 235 in Model 1 and 231 in Model 2 because of missing data on outcome variables. Significant path coefficients at p = .05 are in bold. As predictors, T1 alcohol frequency and peer norms were used in Model 1, whereas T2 alcohol frequency and peer norms were used in Model 2. T2, Time 2; T3, Time 3; G × E, Gene × Environment; G × Alc, Gene × Alcohol Frequency; G × FH, Gene × Family History.
Effect sizes
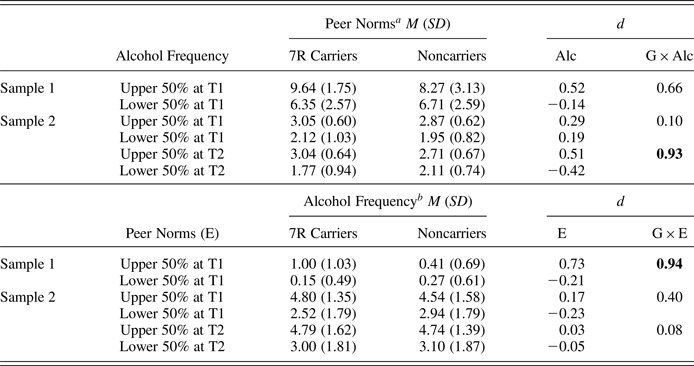
Table 6 shows Cohen d, as a measure of effect sizes of genetic moderation in peer selection (the effect of Gene × Prior Alcohol Frequency on later peer norms) and socialization (the effect of Gene × Prior Peer Norm on later alcohol frequency). The results of effect sizes were in line with the results of significance testing using both cross-lagged panel models and path analyses, showing large effect sizes of the genetic difference in peer selection at T3 in Sample 2 (d = 0.93) and in peer socialization in Sample 1 (d = 0.94); other effect sizes were small to medium.
Table 6. Observed means (standard deviations) as a function of the DRD4 variable number tandem repeat (G), and Cohen d effect sizes of genetic moderation in peer selection (G × Alc) and peer socialization (G × E)
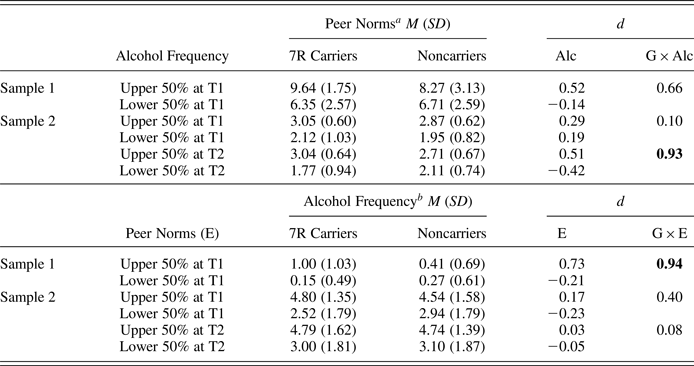
Note: The Cohen d values associated with significant genetic differences in multigroup cross-lagged panel models are in bold. G × Alc, Gene × Alcohol Frequency; G × E, Gene × Environment, peer norms; 7R, Seven repeat.
a Values are peer norms at a subsequent time point.
b Values are alcohol frequency at a subsequent time point.
Discussion
We examined whether the association between perceived peer drinking norms and adolescent drinking over time differed as a function of the DRD4 VNTR genotype in two adolescent samples. Results from multigroup cross-lagged panel models indicated that socialization via peer drinking norms occurred among carriers of the 7R allele but not among noncarriers in the high school sample. In contrast, drinking-based peer selection in the junior year was stronger among carriers than among noncarriers in the college student sample. These results remained the same after controlling for interaction effects of covariates with the genotype and prior peer norms and alcohol frequency. These findings suggest genetically moderated peer selection (carriers tend to associate with peers who have more favorable attitudes toward drinking and greater alcohol use) and peer socialization (carriers' subsequent drinking behaviors are more strongly associated with their peer drinking norms) may differ across adolescent developmental stages.
Regarding peer selection, in the college sample, peer selection in the junior year was stronger in carriers, although peer selection did occur in both groups in the sophomore and junior years. In contrast, in the high school sample (with the mean age of 15), we found no evidence for peer selection based on alcohol frequency in both carriers and noncarriers. This null finding of genetic moderation in drinking-based peer selection among high school students is consistent with null findings of prior studies by van der Zwaluw et al. (Reference van der Zwaluw, Larsen and Engels2012) and Mrug and Windle (Reference Mrug and Windle2014). These findings suggest that, regardless of the DRD4 VNTR, peer selection in middle adolescence (when alcohol use is less prevalent than in later developmental stages) may be driven less by alcohol use than by other personal characteristics. In contrast, peer selection in college may be determined considerably by alcohol use, which plays a prominent role in the college culture (Jackson et al., Reference Jackson, Sher, Park, Galanter, Lowman, Boyd, Faden, Witt and Lagressa2005). Individuals' creation of the peer drinking environment based on their genotype may become apparent only in late adolescence. Genetic influences (versus environmental influences) on adolescent drinking have been shown to become stronger from middle adolescence to late adolescence (Rose & Dick, Reference Rose and Dick2004/2005). Genetically determined selection into alcohol-facilitating peer environments may be one of the mechanisms by which genetics affects escalation of drinking in late adolescence. Future studies using multiwave prospective data from early to late adolescence will help to resolve the potential developmental changes in genetically moderated peer selection.
Regarding peer socialization, in the high school sample, socialization via peer drinking norms occurred in carriers but not in noncarriers. In the college sample, however, we found no evidence for genetic differences in socialization via peer drinking norms; in both groups, peer socialization occurred in the sophomore year. These findings suggest that those who carry the 7R allele in middle adolescence may be more susceptible to perceived peer drinking norms than are noncarriers. Our finding of a significant G × E interaction (along with a null bivariate correlation of the gene with alcohol measures) indicates that the expression of the gene is conditional upon the degree of perceived peer drinking norms at least in middle adolescence. These findings may partially explain inconsistent findings of the association of the DRD4 VNTR with alcohol outcomes (McGeary, Reference McGeary2009). Regarding previous prospective G × E studies, our result is in line with the finding of a significant interaction between the DRD4 VNTR and perceived peer norms at age 16 but not at other ages (van der Zwaluw et al., Reference van der Zwaluw, Larsen and Engels2012). However, considering the finding of a significant interaction at age 33 but not at earlier ages (Mrug & Windle, Reference Mrug and Windle2014), extant findings of peer socialization moderated by the DRD4 VNTR are overall inconsistent and age specific. In addition, the current null finding of the interaction of the DRD4 VNTR with peer norms in the college sample is inconsistent with our prior finding of a significant interaction between the DRD4 VNTR and fraternity/sorority involvement in college (Park et al., Reference Park, Sher, Todorov and Heath2011). Although perceived peer drinking norms are important determinants of fraternity/sorority drinking, other environmental factors (e.g., alcohol availability) as well as personal factors (e.g., impulsivity and motives) have been shown to affect fraternity/sorority drinking (Borsari & Carey, Reference Borsari and Carey1999; Park et al., Reference Park, Sher, Wood and Krull2009) and may interact with the DRD4 VNTR independently and/or cumulatively. In addition to replication with independent samples, future meta-analytic synthesis is needed to resolve these inconsistent findings on the genetic susceptibility to alcohol-facilitating peer environments across developmental stages.
We found significant contemporaneous associations between alcohol frequency and peer norms at all time points in both samples, which is in line with the extensive literature indicating that peer drinking norms are strongly correlated with adolescent drinking (Borsari & Carey, Reference Borsari and Carey2003; Jackson et al., Reference Jackson, Sher, Park, Galanter, Lowman, Boyd, Faden, Witt and Lagressa2005). However, we found no genetic difference in the contemporaneous association, while we found significant genetic differences in the prospective association. These different findings between cross-sectional and prospective associations may be due to diverse elements that influence observed cross-sectional associations (Maxwell, Cole, & Mitchell, Reference Maxwell, Cole and Mitchell2011), including concurrent bidirectional influences (i.e., peer norms and alcohol use influence each other simultaneously), unmeasured third-variable effects on both peer norms and alcohol use (e.g., impulsivity), and correlated error due to measurement artifacts (e.g., measurement time, format). Thus, the various determinants of the contemporaneous association between adolescent drinking and peer norms may have prohibited us from detecting potential genetic differences, if any, in the association. In contrast, cross-lagged paths (that are used to test peer selection and socialization in the current analyses) allow us to test the direction of the association between the two variables over time, after accounting for their contemporaneous association. Further, the prospective associations are free from correlated errors due to time of measurement (although unmeasured third-variable effects may still exist).
Psychological and neurobiological pathways by which peer environments increase adolescent drinking among 7R carriers are yet to be characterized. In terms of the peer-selection process, carriers may opt for friends who are favorable to and engage in drinking, in part because they seek to experience novel or stimulating interactions with peers. Although a meta-analysis does not support an overall association between the DRD4 VNTR and novelty seeking (Munafò, Yalcin, Willis-Owen, & Flint, Reference Munafò, Yalcin, Willis-Owen and Flint2008), this association may manifest in only certain developmentally relevant high-risk social environments, such as high peer drinking norms in adolescence (e.g., Benjamin, Patterson, Greenberg, Murphy, & Hamer, Reference Benjamin, Li, Patterson, Greenberg, Murphy and Hamer1996). In terms of the peer-socialization process, the DRD4 VNTR gene was found to be strongly related to urges to drink alcohol (McGeary, Reference McGeary2009). Thus, exposure to alcohol cues rampant in alcohol-conducive peer environments may trigger carriers to experience greater urges to drink and, in turn, to engage in alcohol use. Further, an experimental study found that 7R carriers report more social bonding while drinking than do noncarriers (Creswell et al., Reference Creswell, Sayette, Manuck, Ferrell, Hill and Dimoff2012). Thus, 7R carriers' tendency to experience enhanced social bonding from drinking may facilitate alcohol consumption in the presence of peers (particularly those who approve of drinking and engage in high levels of drinking). Future studies should test these potential mechanisms underlying the differential reactivity to peer environments to establish the functional meaning of the current findings.
Several limitations of the current study are worth mentioning. First, we sampled middle adolescents of diverse and mixed races with unknown family history of alcoholism and late adolescents of White background, half of whom were positive in family history of alcoholism. These differences in sample characteristics may have affected our results that were not replicated across the two samples, and our findings may not be straightforwardly generalizable to other populations. For example, oversampling high-risk college students in Sample 2 may have yielded greater variability in alcohol use and peer norms than that in other samples of college students (although the effects of family history were controlled for in main analyses, and its interaction effects with all predictors also were controlled for in ancillary path analyses). Second, our measures of peer norms and alcohol use are based on adolescent self-reports, and reporting biases could have affected our findings in unknown ways. Adolescents tend to perceive that their peers drink more and judge drinking more favorably than their peers actually do (Borsari & Carey, Reference Borsari and Carey2003), and the use of adolescents' reports of their peers' behaviors tend to inflate the degree of association between behaviors of adolescents and their peers (Kandel, Reference Kandel1996). However, self-report is generally shown to be a reliable and valid indicator of adolescent drinking (Lintonen, Ahlstrom, & Metso, Reference Lintonen, Ahlström and Metso2004), and a study using peer drinking norms reported by peers also found significant, positive associations between peer norms and adolescent drinking (Mundt, Reference Mundt2011). Regardless, future studies using direct measures of peer drinking norms obtained from peers may resolve this potential difference in the effect of peer norms as a function of reporters. Third, our study examined only a single polymorphism; future studies need to examine cumulative and multiplicative effects of the DRD4 VNTR with other polymorphisms that have been implicated in adolescent drinking behaviors.
Despite these limitations, this study advanced the literature by demonstrating that a genetic variant modulates the strength of reciprocal influences between perceived peer drinking norms and adolescent drinking, and this genetic moderation may differ across developmental stages. Continued investigation of genetic moderation in both environmental selection and susceptibility can provide information to guide prevention strategies for individuals with genetic susceptibility to reduce their exposure or reactivity to environmental risks.


