In recent years, many international commentators have been impressed by the strength of Canadians’ support for immigration. At a time of considerable backlash elsewhere, Canada has maintained an expansive immigration program. When in late 2015 a newly elected Liberal government announced a target of 25,000 Syrian refugees to be admitted by the end of the year and the young prime minister met the first planeload at the airport, handing out winter coats to the new arrivals, an Economist cover story celebrated “Canada's example to the world” and the Guardian asked whether Canada was “the world's first ‘post-national’ country” (The Economist, 2016; Foran, Reference Foran2017). Most commentators at the time agreed with the Guardian that the secret to Canada's comfort with high levels of immigration is its distinctive culture that celebrates diversity as a defining feature of Canadian identity.
Many scholars agree. A common interpretation of the roots of this distinctive culture highlights the country's origins as a multination state, arguing that the long series of accommodations among the historic nations has created a culture that accepts and even celebrates ethnic diversity. For example, in his magisterial history, Peter Russell argues that the persistence of the historic nations “made Canadians more open than majorities in any other Western democracy to admitting immigrants from all over the world. . . . Accommodating the nations with which ‘old Canadians’ identify has helped make Canada an attractive place in which to settle for ‘new Canadians’” (Russell, Reference Russell2017: 16–17; see also Cameron, Reference Cameron, Stein, Cameron, Ibbitson, Kymlicka, Meisel, Siddiqui and Valpy2007; Winter, Reference Winter2011, Reference Winter2014). Sociologist Jeffrey Reitz also highlights the cultural underpinnings of Canadian support for immigration: “Popular support for multiculturalism as a symbol . . . creates a positive political environment for the development of Canada's expansionist immigration policy and helps immigrants integrate into the economy and society” (Reitz, Reference Reitz and Jedwab2014:108; see also Adams, Reference Adams2007).
This article challenges this strong emphasis on culture, at least in part, by tracing the evolution of public attitudes toward immigration and analyzing the factors that have shaped the trajectory for over three decades. We choose this longer timeframe because Canadians have not always been highly supportive of immigration. Historians have demonstrated the many dark episodes in the first half of the twentieth century, when racism and intolerance marked too many immigration policies. Less attention has focussed on our more recent history. As we shall see below, until the mid-1990s, Canadian attitudes to immigration were not particularly supportive. Indeed, the overwhelming bulk of Canadians agreed that immigration levels were too high. Public attitudes then shifted abruptly. Beginning in the mid-1990s, support for immigration rose dramatically, and by the early 2000s, two-thirds of Canadians disagreed that immigration levels were too high. This was a remarkable change in a short period.
Figure 1 nicely illustrates the change. The figure shows respondents’ attitudes toward immigration levels, based on 4-point agree/disagree responses to the statement: “Overall, there is too much immigration to Canada.” We collapse the scale into two categories: supportive and not supportive.Footnote 1 Note that until the mid-1990s, a clear majority of Canadians were not supportive of the existing immigration level. The pattern changed in the late 1990s, however, and there was a new equilibrium by 2003, one in which between 60 and 70 per cent of Canadians were supportive of immigration levels.
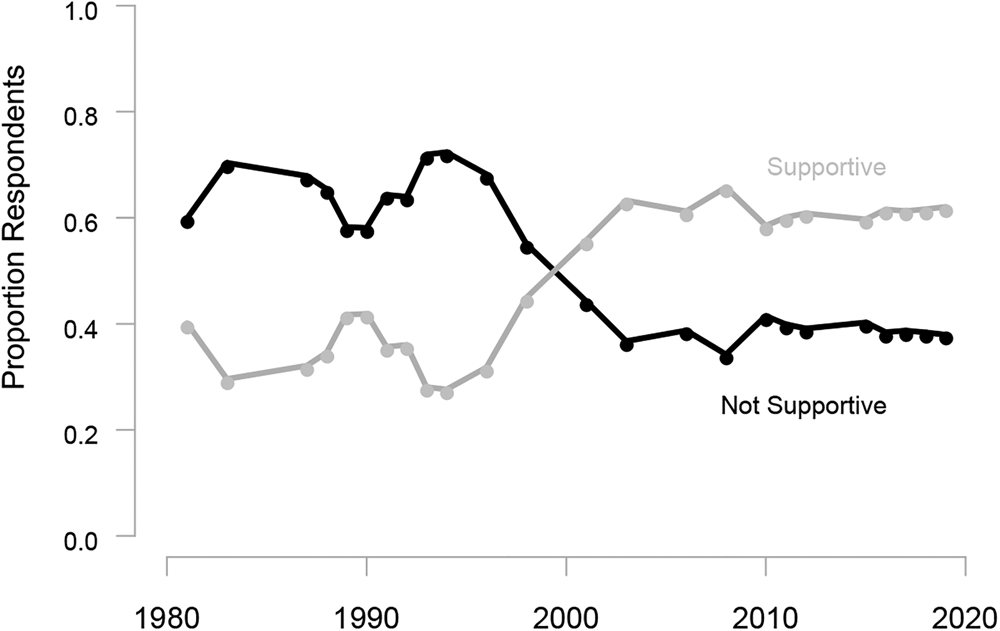
Figure 1 Support for Immigration Levels, 1981–2019
Note: Data are from Environics Focus Canada surveys, discussed in more detail below.
Our work is motivated by this period of rapid change, and explaining this transition requires us to develop a model of the factors that shape public attitudes to immigration. In developing our model, we draw on the comparative literature on the factors shaping public attitudes to immigration across contemporary democracies. The findings that emerge from this process challenge the popular narrative about Canada in several ways. Most importantly, we find that changes in Canadian attitudes to immigration are shaped by the same factors at work in other countries: the rapid change in attitudes in the mid-1990s seems to have been driven in part by economic factors and in part by stabilization in the level of immigration after a period of rapid increase. Moreover, Canadians’ continuing support for immigration since that time reflects a similar blend of economic context and the speed of change in immigration levels, as much as it does cultural factors. In our concluding discussion, we explore the implications of this analysis for the future. A number of groups have advocated a significant increase in immigration levels. If we are right in our analysis of the drivers of attitudes to immigration, however, the political sustainability of steadily growing immigration requires careful assessment.
Explaining Attitudes to Immigration: The Comparative Literature
Not surprisingly, a large scholarly literature on the sources of anti-immigrant attitudes has emerged in the last two decades. (For a useful review, see Hainmueller and Hopkins, Reference Hainmueller and Hopkins2014.) Comparative data make clear that Canadian support for immigration levels is comparatively high. While reassuring for those who are supportive of immigration, these data tell us little about the drivers of change in Canadian attitudes, and they are an inadequate guide to the politics of immigration or the implications of possible changes to immigration policy. The comparative literature suggests a number of candidates for explaining the over-time variation in Figure 1. A starting point is change in the scale of immigration. Evidence from the few studies that have tackled this question suggests that the actual level of immigration does not matter a lot but rapid increases in the level of immigration can trigger anti-immigration pushback (Bommes and Geddes, Reference Bommes and Geddes2000; Eger, Reference Eger2010). Indeed, countries with high but stable foreign-born populations seem to have less difficulty than countries with smaller but rapidly growing migrant populations. It is the rate of change rather than the precise level of immigration that seems most politically sensitive (for analyses of the pace of change in immigration and social spending, see Soroka et al., Reference Soroka, Banting, Johnston, Kevins and Kymlicka2016). Our expectation is that substantial increases in immigration lead to decreased support for more immigration.Footnote 2
Much more research has focussed on the relative importance of economic and cultural threats as drivers of anti-immigration sentiment. The literature on economic threat examines its impact at both the individual level and the societal level. At the individual level, the native born might oppose immigrants because they fear competition for jobs or wages, a response more likely among the less skilled and more marginal members of the labour force. Alternatively, the native born might oppose immigration for fear that immigrants will pose a greater tax burden and/or compete with them for access to scarce health and welfare benefits. The latter fear can trigger “welfare chauvinism,” which seeks to protect the welfare state for the native born by reducing overall immigration levels and/or excluding newcomers from welfare benefits. Evidence for the proposition that a sense of personal economic threat drives anti-immigrant sentiment generally is limited (see, for example, Valentino et al., Reference Valentino, Soroka, Iyengar, Aalberg, Dutch, Fraile, Hahn, Hansen, Harell, Helbling, Jackman and Kobayashi2019; Hainmueller and Hiscox, Reference Hainmueller and Hiscox2007). Nonetheless, if there is an impact of personal economic circumstances, we should expect weaker economic circumstances to be associated with decreased support for immigration.
Economic explanations that operate at the societal level, typically described as sociotropic economic threat, have received more compelling support. This proposition holds that the native born worry about the impact of immigration not so much on their individual well-being but on the strength of the economy generally. A large body of evidence supports the proposition that public perceptions of the state of the economy are related to support for immigration (Hopkins, Reference Hopkins2010). Public support for immigration tends to rise and fall with the business cycle and to fall more sharply during economic crises (Stevenson, Reference Stevenson2001; Harell et al., Reference Harell, Soroka, Iyengar and Valentino2012; Wilkes and Corrigall-Brown, Reference Wilkes and Corrigall-Brown2011; but see also Sides and Citrin, Reference Sides and Citrin2007).
The comparative literature also explores cultural explanations that hold that the native born see immigrants as a threat to their national identity and culture, especially when immigrants are culturally distant from them in ethno-racial and religious terms. A sense of cultural threat can be rooted in a fear that too many immigrants do not adopt the cultural values of the host society, live in segregated communities and do not want to become part of “us.” Alternatively, a sense of cultural threat might simply reflect racial animosity and xenophobia. Recent experimental studies have demonstrated the power of race in shaping responses to potential immigrants (see, for example, Harell et al., Reference Harell, Soroka, Iyengar and Valentino2012; Kinder and Kam, Reference Kinder and Kam2010). In the contemporary context, religious differences and especially anti-Muslim sentiment play a larger role in immigration politics. Researchers have also asked whether the adoption of vigorous multiculturalism policies can ease the tensions swirling around immigration. Comparative evidence suggests that such policies do help newcomers to integrate into mainstream social and political life, but they can also contribute to cultural anxiety among the native born (Bloemraad, Reference Bloemraad, Banting and Kymlicka2017; Bloemraad and Wright, Reference Bloemraad and Wright2014; Citrin et al., Reference Citrin, Levy and Wright2014). Clearly, we need to investigate the role of cultural anxieties more carefully.
Below, we consider each of these factors as drivers of change in immigration attitudes in Canada. There are, of course, other variables that matter as well, less rooted in the comparative literature but important in both the Canadian and other national contexts. The role of political partisanship is well established in studies of immigration attitudes outside of Canada, and immigration seems to have been a mobilizing issue in some recent Canadian elections, especially the 2015 election (Arzheimer, Reference Arzheimer2009; Van de Brug et al., Reference Van de Brug, Fennema and Tille2005; Koning, Reference Koning, Banting and Kymlicka2017; Marwah et al., Reference Marwah, Triadafilopoulos, White, Rayside and Farney2013; Triadafilopoulos and Taylor, Reference Triadafilopoulos, Taylor, Samy and Duncan2020). We therefore consider political partisanship in a final analysis, mainly as a control variable but also as a potential source of change over the past decade. We do not consider the role of media coverage, although past work has demonstrated the role of the media in framing perceptions of immigrants and racial minorities in Canada (Lawlor, Reference Lawlor2015; Lawlor and Tolley, Reference Lawlor and Tolley2017; Tolley, Reference Tolley2016). Media certainly plays a role in the impact of immigration and economic circumstances—we learn about these at least in part from media, after all. We nevertheless leave media content as an implicit rather than explicit component in the models that follow. In sum, our objective in the sections that follow is to examine the role that each of these factors—(a) immigration flows, (b) economic context and (c) attitudes about both economic and cultural threat—may have played in shifting support for immigration in Canada. We being by taking a closer look at each of these variables, from 1985 to the present.
The Canadian Trajectory: The Evolution of Immigration Attitudes
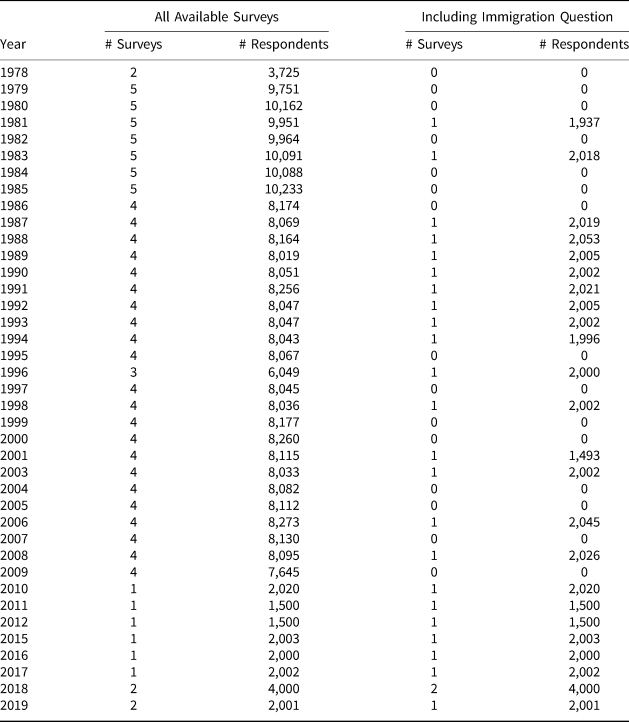
We analyze Canadian experience by drawing on a remarkable dataset that spans three decades. Starting in the late 1970s, Environics Focus Canada surveys regularly fielded batteries of questions on Canadian public policy to representative samples of the Canadian public. Many questions were repeated, often entirely unchanged, over many years. The result is a wealth of data on Canadians attitudes, combined with a wide range of demographic and political variables. Environics Focus Canada surveys have played a starring role in past work on immigration attitudes in Canada (Wilkes and Corrigall-Brown, Reference Wilkes and Corrigall-Brown2011; Lawlor, Reference Lawlor2015; Lawlor and Tolley, Reference Lawlor and Tolley2017); they are the source of data used in Figure 1, above; and they are also the focus of much of the analyses that follow.Footnote 3
How can we explain the rapid transition in Canadians’ attitudes that began in the mid-1990s? Discussions of Canadian support for immigration usually start with the country's geographic location, with oceans on three coasts and a large country of destination for immigrants to the south. This geographical isolation creates relatively secure borders and maximizes the country's discretion in designing and managing immigration policies. The traditional story then moves on to highlight the adoption of the points system for skilled immigrants in 1967, which is assumed to forestall anxieties that immigrants will be a drain on the country's resources. Finally, as noted in the introduction, the traditional story points to a culture and identity that celebrate diversity. Without denying the importance of these factors, it is clear that they have difficulty explaining the dramatic transition that began in the mid-1990s. To gain leverage over that shift, we turn to the factors highlighted by the comparative literature on immigration discussed above. Over-time trends in each are shown in Figure 2.
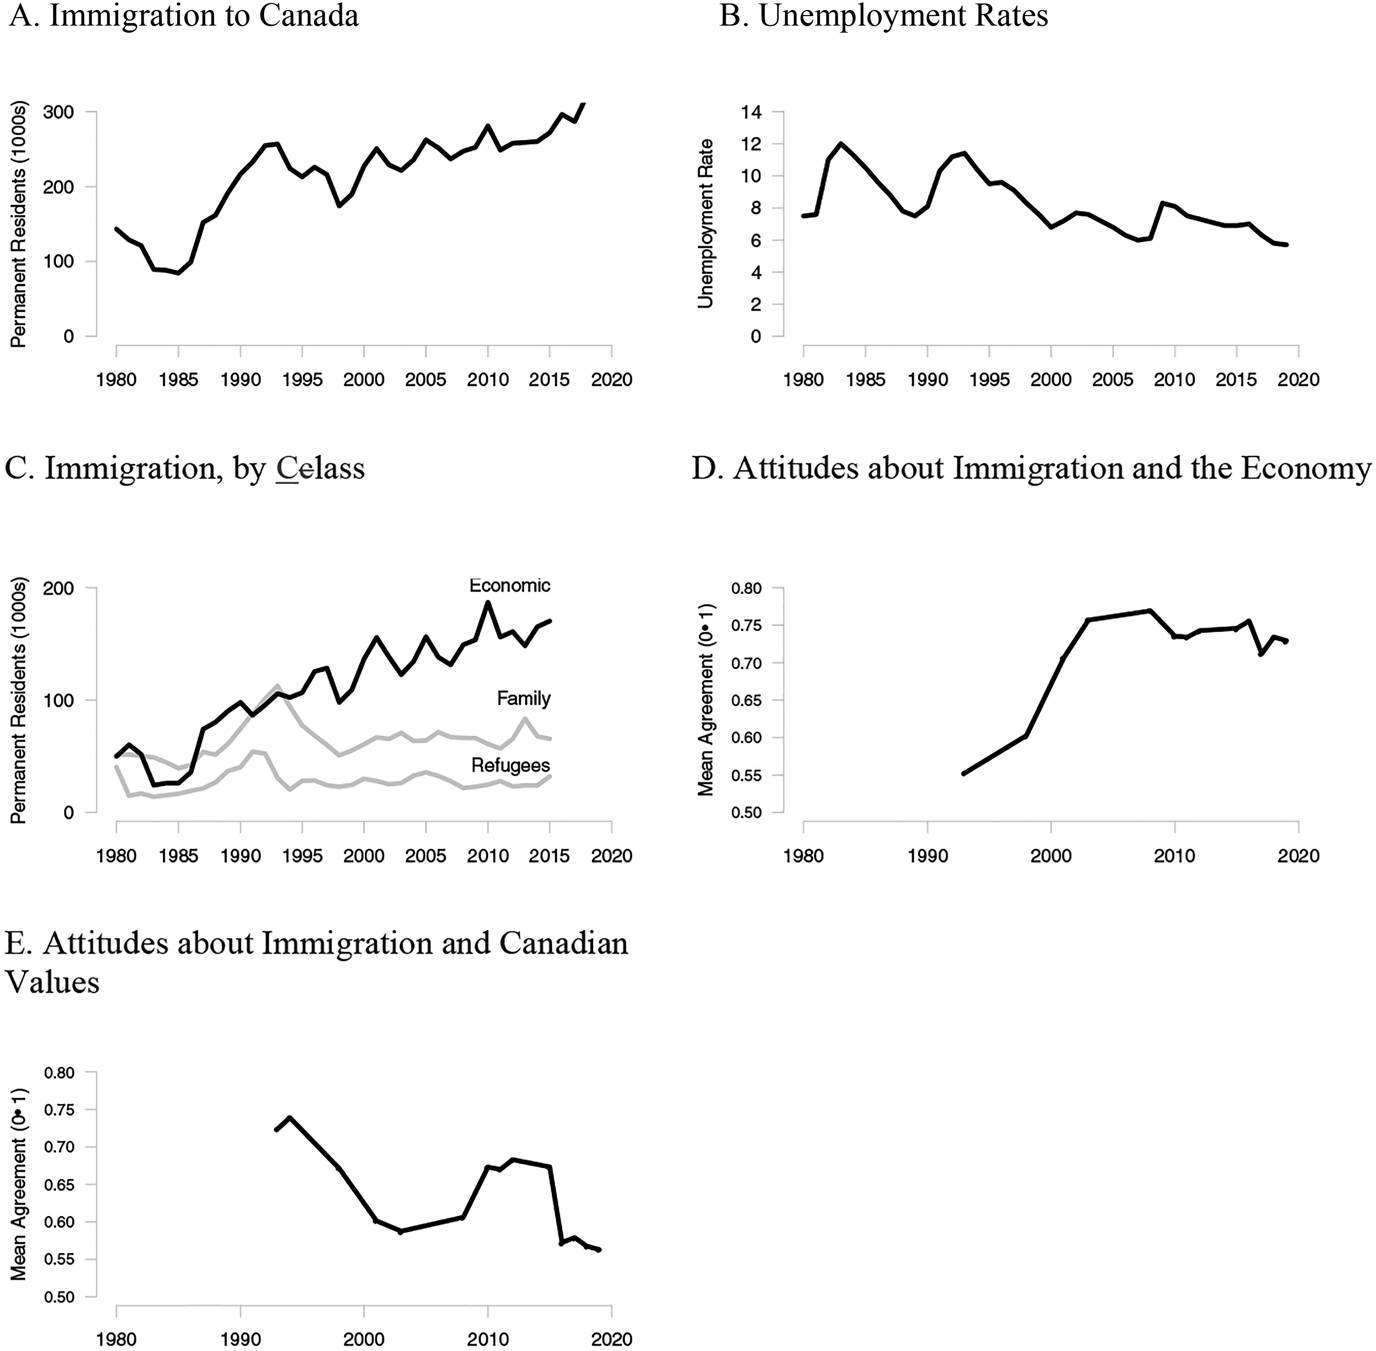
Figure 2 Potential Drivers of Immigration Support, 1980–2019
Note: Data in Figures 2A and 2C from Immigration, Refugees and Citizenship Canada (IRCC); data in Figure 2B from from Canadian Socio-Economic Information Management System (CANSIM); data in Figures 2D and 2E from Environics Focus Canada surveys.
Figure 2A starts with change in the level of immigration, tracking the total number of permanent residents in all classes admitted to Canada between 1980 and 2019. It is striking that the size of the immigration program rose strongly during the 1980s and early 1990s, a period when most Canadians thought immigration levels were too high. This growth came to a sudden stop in the mid-1990s. After an initial drop, the level stabilized around 250,000, staying around that level through 2015. Some similarities in the trajectories in Figures 1 and 2A suggest this may be an important candidate for explaining attitudes toward immigration.
What about the economic factors that have emerged in earlier studies? An initial clue appears in Figure 2B, which tracks the annual unemployment rate over the same time period. Unemployment was higher and more volatile in the 1980s and early 1990s, reflecting the impact of business cycles and a deep recession early in both decades. But the unemployment rate declined steadily as the 1990s progressed, reaching a lower and more stable level after 2000. A comparison of Figures 1 and 2B suggests we have a second possible candidate as a driver of public attitudes. During the 1980s and early 1990s, support for immigration tracked the business cycle quite closely but then rose and stabilized as unemployment fell and stabilized. Indeed, in the article most similar to ours, Wilkes and Corrigall-Brown (Reference Wilkes and Corrigall-Brown2011) analyze whether the rapid change in immigration attitudes reflected a cohort or period effect. They find that cohort succession played little role but emphasize the impact of macro-economic conditions; their emphasis on the unemployment rate also emerges in several other studies as well (Palmer, Reference Palmer1996; Wilkes et al., Reference Wilkes, Guppy and Farris2008; Harell et al., Reference Harell, Soroka, Iyengar and Valentino2012).
The impact of economic considerations may well have been reinforced by a shift in immigration policy in the same period. As noted above, most accounts of Canadian attitudes highlight the adoption of the points system in 1967. However, a points system matters less if the economic class of immigrants is small. Figure 2C plots immigration by class up to 2015 (as data were not available in more recent years). The figure indicates that family reunification was the largest category in the early 1980s and that the economic class only began to dominate from the mid-1990s, becoming really dominant by 2000. It is not much of a stretch to say that the skills-oriented immigration program only emerged fully in the mid-1990s (Abu-Laban and Gabriel, Reference Abu-Laban and Gabriel2002). Since then, the economic focus has been reinforced through a long series of adaptations to address labour market needs and through the multiplication of special programs for select types of economic immigrants. The current structure is managed primarily through the Express Entry system, which governs the three main federal streams of economic immigration: the Federal Skilled Worker Program, the Canadian Experience Class and the Federal Skilled Trades Program.Footnote 4 There is also an Express Entry stream for Provincial Nominees, allowing provinces to develop their own selection criteria to meet their regional economic needs.Footnote 5 In addition, bridges have been constructed for international graduates of Canadian postsecondary institutions and some skilled temporary workers to transition from temporary to permanent resident status. Finally, the federal government has introduced a variety of temporary foreign worker and international mobility programs that have increased dramatically in size over time. In contrast to this expansion and multiplication of economic pathways, the family reunification stream remains tightly constrained.
It is unlikely to be purely coincidental that Canadians’ belief that immigration is good for the economy rose in precisely the period in which the program focussed so strongly on economic immigrants. Figure 2D shows mean values from a 5-point agree/disagree battery (rescaled from 0 to 1, where 1 is “agree strongly”) in response to the statement “Immigration has a positive impact on the economy.” There is a clear upward shift again over the 1990s, at the same time that Canada shifts the balance of immigration toward the economic stream.
What about cultural factors? As noted above, discussions of Canadian attitudes toward immigrants often point to a culture and identity that celebrate multicultural diversity. Studies of the role of Canadian national identity find that, unlike in the US, a strong sense of Canadian patriotism is positively associated with support for immigration (Citrin et al., Reference Citrin, Johnston and Wright2012), a relationship that buffers the welfare state from the toxic effects of immigration on support redistribution that has emerged in many other countries (Johnston et al., Reference Johnston, Banting, Kymlicka and Soroka2010). However, cross-national surveys in the early 2000s found that Canadians were as insistent as any European public that immigrants should “fit in” (Banting, Reference Banting2010). Cultural anxieties about immigration seem especially prominent in Quebec, where immigration is episodically framed as a threat to the survival of the French language and culture, most recently in the 2018 provincial election. But cultural insecurity is hardly limited to Quebec. Figure 2E reports mean values from a 5-point agree/disagree battery (rescaled from 0 to 1, where 1 is “agree strongly”) in response to the statement “Too many immigrations are not adopting Canadian values.” Results indicate a slow decline in the early 2000s, followed by an increase from roughly 2007 to 2015 and a decrease thereafter. The level of current concern appears to be lower than in the mid-1990s. The trend in this series is not clearly in line with what we have seen in previous series. Nevertheless, as we shall see, concerns about whether immigrants are adopting Canadian values represent an important driver of support for immigration levels, both in the past and presently.
In sum, the years from the mid-1990s to the early 2000s made up the period in which Canadians dramatically increased their support for immigration. A review of the factors shown to matter to immigration attitudes elsewhere points to a number of factors, several of which shifted at the same time as rising public support for immigration. Which of these factors mattered? It is time to move to a more systematic analysis.
Accounting for Trends in Canadians’ Support for Immigration
We first explore the impact of trends in the level of immigration, relying on individual-level analyses across all Environics Focus Canada surveys that include the immigration question illustrated in Figure 1.Footnote 6 Table 1 shows the results of stepwise regressions, modelling support for immigration as a function of demographics and then some annual variables. Because we rely on a combination of individual- and annual-level variables, we use ordinary least squares (OLS) regression with clustered standard errors (clustered by year).
Table 1 Modelling Support for Immigration
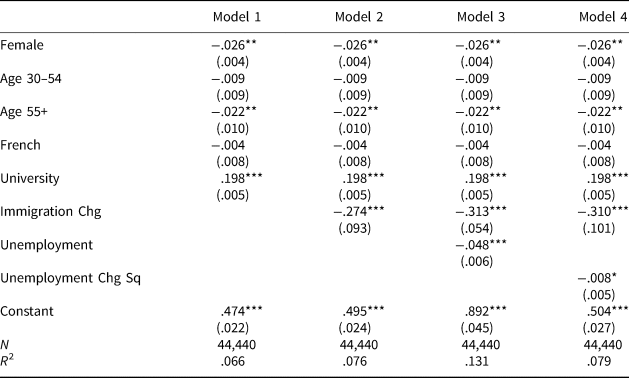
Note: Cells contain OLS regression coefficients with clustered standard errors.
* p < .10; ** p < .05; *** p < .01.
We are aware of the statistical issues inherent in our pooling of cross-sectional surveys and annual data. The difficulties inherent in this kind of analysis are outlined in some detail in Lebo and Weber (Reference Lebo and Weber2015). We follow their suggestions, namely: (1) we mean-centre the individual-level independent variables, in order to more accurately identify the within-panel effects of these variables, and (2) we consider “differenced” versions of the annual time-series variables so as to avoid potential estimation biases resulting from autocorrelation.
The specification of the demographic variables is relatively straightforward: Female is a binary variable equal to 1 for women; Age 30–54 and Age 55+ are binary variables, where the comparison category includes those under the age of 30; French is a binary variable equal to 1 for those whose primary language is French; and University is a binary variable equal to 1 for those who have attended university. For this and all subsequent estimations, these variables are mean-centred.
Model 1 includes just these demographic controls. We include the model only as a point of comparison for the subsequent models, which add our variables of primary interest: first, Immigration Chg, per cent changes in the number of incoming permanent residents, to capture changes in the rate of immigration; then Unemployment, the current unemployment rate; and finally Unemployment Chg Sq.Footnote 7 Immigration Chg has the expected negative effect—citizens respond thermostatically to changes in immigration, where increased immigration is associated with decreased support for immigration levels. Note that adding change in immigration levels does relatively little to the explanatory power of the model: the R-squared in the first model is .066, and it slides upward to only .076 in Model 2.Footnote 8 There is, in contrast, a roughly 100 per cent increase in explained variance in Model 3, when we add unemployment. When unemployment is high, support for immigration levels is low, other things being equal.
Theoretically speaking, we suspect that levels of unemployment are what matter for immigration attitudes. This is in contrast with immigration, where past work suggests the importance of changes in the level rather than the level itself. That said, levels of unemployment are autocorrelated. The most straightforward way to purge the variable of autocorrelation, in line with recommendations from Lebo and Weber (Reference Lebo and Weber2015) is to difference the variable. Doing so has a second advantage: we can use the quadratic form of change in unemployment, allowing for larger (more noticeable) changes to matter more than smaller (less noticeable) changes. It is this squared version of unemployment change that is included in Model 4 of Table 1. Purging unemployment of autocorrelation has a noticeable effect on the R-squared, which is now scarcely larger than in Model 2. Even so, the estimated impact of unemployment is weakly significant and negative. (To be clear: p < .10 for this unemployment coefficient in Model 4, although we are somewhat liberal in our interpretation given the limited number of years in our panel data.)
What is the substantive impact of immigration and unemployment? The in-sample standard deviation in the Immigration Chg measure is 0.138, so based on results in Model 4, a one-standard-deviation increase in immigration change produces an average −0.043 change in support (scaled from 0 to 1). The standard deviation in the Unemployment Chg Sq variable is 2.741 (equivalent to a 1.655-point change in unemployment), so a one-standard-deviation increase in unemployment change produces an average −0.022 change in support. Both variables may matter, substantively speaking, especially the impact of changes in immigration, for which a one-standard-deviation shift is associated with attitude change that is roughly one-third of the observed range of that variable (from roughly .25 to roughly .6).
We can, in sum, account for a good portion of over-time change in support for immigration using a combination of immigration and unemployment levels. The story for the pivotal period in Canadians’ immigration preferences in the late 1990s is, it appears, about a combination of a new stability in the level of immigration after a period of increases and decreasing unemployment rates.
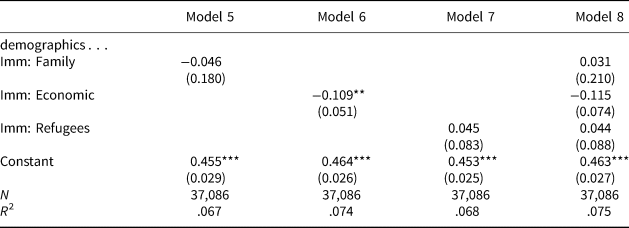
Model 4 only captures the impact of the level of immigration as a whole; it also only captures the impact of both immigration and macro-economics at the national level. Is there any evidence that over-time variation in immigration preferences responds to specific streams of immigration rather than immigration more generally? Table 2 re-estimates the last model in Table 1, but instead of using per cent changes in permanent residents generally, it uses per cent changes in each of the three streams of immigration to Canada: family, economic and refugee (up to 2016 only, given data availability). Models 5 through 7 include each stream separately, while Model 8 includes all three together. (Demographic variables are included in these models, but since the coefficients do not change from what we have seen in Table 1, they are not shown here.)
Table 2 The Impact of Immigration, by Immigration Stream
Note: Cells contain OLS regression coefficients with clustered standard errors.
* p < .10; ** p < .05; *** p < .01.
There is evidence in Table 2 of a weakly significant negative response to the economic stream of immigration when it is entered separately. When all streams are entered simultaneously, collinearity prevents any one coefficient from attaining statistical significance. There is thus no evidence in Table 2 of a stronger reaction to increases in the number of any one category of immigrants. If anything, the combination of Table 1 and Table 2 suggests that Canadians’ reactions are to immigrants as a whole, not to any specific category of immigrants.
What about regional rather than national context? It may be that responsiveness to either immigration or macro-economics is at the regional level. This is difficult to explore for immigration—there is, to our knowledge, no available data on immigration by region or province back to the early 1980s. There is data on unemployment rates, however.
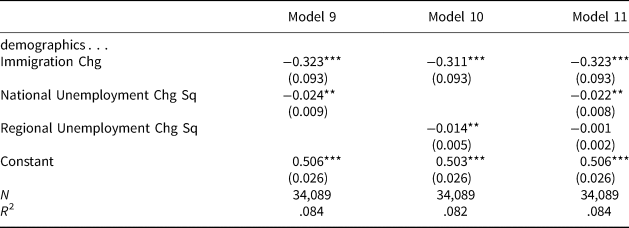
Connecting regional unemployment rates to the Environics survey data is not entirely straightforward. Older Environics surveys do not have a province variable, just a broader regional variable. There also are some archived surveys that do not include any kind of province or region variable. Even so, if we collapse provinces into five regions—Atlantic, Quebec, Ontario, Prairies and British Columbia—we can assign a region to roughly 80 per cent of the cases used in the preceding models. Table 3 shows models that rely on these regional unemployment figures.Footnote 9
Table 3 The Impact of Immigration, Regional versus National Unemployment
Note: Cells contain OLS regression coefficients with clustered standard errors.
* p < .10; ** p < .05; *** p < .01.
What is the impact of using regional rather than national-level unemployment rates? Because we lose some cases by moving to regional unemployment rates, Model 9 is a simple replication of Model 4, this time using only the cases for which regional data are available. This is the appropriate point of comparison for Models 10 and 11. Shifting from national to regional unemployment in Model 10 points to a statistically significant and similar effect of the regional data. When we include both unemployment measures in Model 11, the impact of the national measure entirely overwhelms the regional measure.
We take results in Model 10 as an indication that our results for unemployment are not just luck: even when we use regional data, immigration support is affected by macro-economics. That said, our results point to the importance of the national over the regional economy.
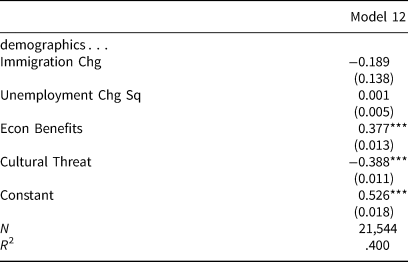
What about the role of cultural concerns? It is of course possible that the response to changes in the level of immigration is driven partly by cultural anxieties. Fortunately we can examine this possibility more directly. Recall that the Environics surveys capture both economic and cultural concerns about immigration (Econ Benefits: “Immigration has a positive impact on the economy”; Cultural Threat: “Too many immigrations are not adopting Canadian values”). These questions are asked in fewer surveys than the question about immigration levels; indeed, they cut the usable sample in half and restrict the years of our analysis to post-1992. That said, we can still rely on a sample of over 21,000 respondents. So what happens when we incorporate these two variables (5-point scales, scaled from 0 to 1) in the analysis? Model 12 in Table 4 is similar to Model 4 in Table 1, but including the two additional measures.Footnote 10
Table 4 The Impact of Economic and Cultural Concerns
Note: Cells contain OLS regression coefficients with clustered standard errors.
* p < .10; ** p < .05; *** p < .01.
We do not intend here to stake a strong causal claim, since it is unclear whether Econ Benefits and Cultural Threat predict or are predicted by immigration support. We consequently regard the coefficients for these variables as correlational rather than predictive. They nevertheless offer a useful diagnostic test of the relative importance of culture and economic concerns. Both variables are correlated with immigration support in the expected direction: beliefs in the economic benefits of immigrants are positively related to support for immigration levels, while concerns about adopting Canadian values are negatively related to support for immigration. The fact that the magnitudes of the coefficients are nearly identical suggests a roughly similar correlation between immigration support and the economic and cultural measures. Model 12 is thus a useful reminder that support for immigration in Canada—as elsewhere—is connected to attitudes about both economic viability and cultural integration.
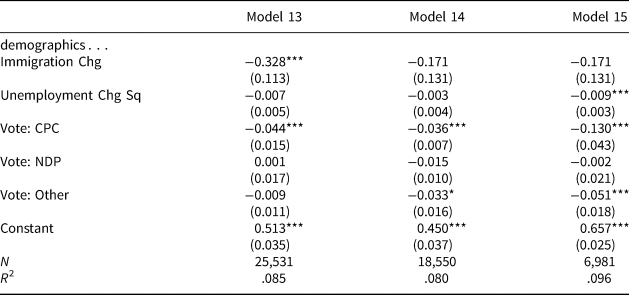
Finally, we turn to political partisanship. Controlling for partisanship highlights an important change in the institutionalization of disagreements about immigration. This can be seen in Table 5, which shows models that include binary variables capturing vote intentions for Conservatives, New Democratic party and Other (mostly the Bloc Québécois [BQ]), with Liberal as the residual category. Model 13 shows results using all available data. Not all archived surveys include the vote intentions variable, so we are working with a somewhat reduced sample in this instance. Even so, it is Conservative voters that stand apart. This is the only group of partisans whose attitudes about immigrants are significantly different from Liberal voters. Conservative voters are, on average, less supportive of immigration than other partisans.
Table 5 The Impact of Partisanship
Note: Cells contain OLS regression coefficients with clustered standard errors.
* p < .10; ** p < .05; *** p < .01.
Models 14 and 15 separate the sample into two intervals: one that includes all data up to and including 2004 (Model 14) and another that covers the period from 2005 onward (Model 15). Our intention here is to separate out the old and current versions of the Conservative party. One weakness in our data is that roughly two-thirds of the surveys for which we have partisanship are from prior to 2004 (see sample sizes for Models 14 and 15); even so, differences in the two models are strongly suggestive. Note that the impact of the Conservative variable more than triples from the pre- to post-2004 periods (and the difference in these coefficients is statistically significant); the tendency for supporters of other parties (mostly BQ) to show lower support for immigration also strengthens.
Table 6 offers one last robustness test: an estimation of the final model in Table 1 but separating out the “rest of Canada” (ROC) (Model 16) and Quebec (Model 17). As noted above, the Environics data do not include regional variables for all respondents, but we can retain most of our cases for such an analysis. Given past work highlighting differences in attitudes toward immigrants in Quebec versus the ROC, there is good reason to check that our results hold in both regions. Models in Table 6 suggest that they do, at least in part: replications of Model 4 in Table 1 in the ROC (Model 16) and Quebec (Model 17) produce a similar effect for Immigration Chg in both regions but an insignificant effect for Unemployment in Quebec. Where responses to changes in immigration levels are concerned, support for immigration in Quebec does not appear to be different from the ROC.
Table 6 Modeling Support for Immigration, Rest of Canada and Quebec

Note: Cells contain OLS regression coefficients with clustered standard errors.
* p < .10; ** p < .05; *** p < .01.
There clearly is more work to be done on the connection between partisanship and immigration attitudes in Canada. For now, we take Tables 5 and 6 as evidence that (a) there has been an important shift in Canadian party competition, at least where immigration attitudes are concerned, (b) results in prior models are robust to the inclusion of partisanship and (c) results are roughly similar in Quebec versus the rest of Canada.
Discussion
The striking levels of public support for immigration in Canada are often seen as reflecting some unique Canadian characteristics, especially a distinctive culture and identity. Our findings suggest that Canadian attitudes to immigration are shaped by the same factors at work in other countries and that there is no unique cultural elixir at work. Our findings give greater weight to the combination of change in the level of immigration and economic factors than does most commentary. Our analysis also places discussion of cultural drivers in a distinct context. As in other countries, cultural anxiety is a negative force in shaping immigration attitudes. In Canada, however, the effects of cultural anxiety appear to be counterbalanced by a widespread belief that immigration is good for the economy.
Our analysis helps understand contemporary policy developments. In recent years, a number of advocacy groups and advisory organizations have urged the federal government to increase immigration levels dramatically. For example, in 2016 the Advisory Council on Economic Growth to the federal minister of finance recommended an increase to 450,000 admissions a year by 2021, an increase of approximately 50 per cent over the intake at the time, with the aim of contributing to rapid growth of the Canadian population.Footnote 11 The federal government avoided such a bold commitment but followed a multi-year plan of incremental increases, raising immigration targets to 350,000 by 2021, a 30 per cent increase over the actual intake of approximately 270,000 in 2015 (IRCC, Reference Immigration, Refugees and Citizenship Canada (IRCC)2018). This increase was followed by some pushback at the level of elite politics: in 2018, the newly elected Quebec government chose to reduce total immigration into the province, moving back to pre-2015 levels; and the 2019 federal election featured the arrival of a new political party, the People's Party of Canada, which also advocated a sharp reduction in immigration levels. Interestingly, the federal government's increase in immigration levels does not seem to have generated a major softening in public support for immigration on a national basis. Our analysis would suggest that perhaps the continued decline in unemployment to near historic lows through 2019 provided the government with greater political room for manoeuver when dealing with the immigration file. In this context, it was perhaps not surprising that the new People's Party of Canada received only 1.6 per cent of the popular vote nationwide.
Our findings also have implications for future policy debates. Most importantly, they suggest we should not assume that public support for immigration is simply baked into Canadian culture. Change in the level of immigration does register with Canadians. However, the challenge of sustaining public support for immigration rests not only with the ministers responsible for immigration and multiculturalism but also with ministers of finance and economic development. The ability of governments to preserve low levels of unemployment and —by extension—to foster Canadians’ faith in the economic benefits of immigration is also critical. In many other countries, globalization, technological change, precarity and growing inequality have generated high levels of economic anxiety, especially among those on the margins of the labour force. This anxiety has contributed to widespread scapegoating of immigrants and helped fuel powerful populist backlash in some countries (Norris and Inglehart, Reference Norris and Inglehart2019). Canadians are not immune to the economic anxieties of the age. However, the toxic combination of economic and cultural anxiety has not emerged as strongly here, not simply because of a distinctive culture but also because of Canada's unemployment record, the mildness of the 2007–2008 recession in the country and the widespread faith that immigration has a positive impact on the economy. Those who support Canada's approach to immigration—and especially those who seek to increase immigration—should not assume support for immigration is a cultural given. Supporters of immigration need to focus not just on immigration policy but also on issues of economic inequality and economic security for the population as whole.
Acknowledgments
We are grateful to the Environics Institute and the Canadian Opinion Research Archive for providing access to survey data. Previous versions of this paper were presented at the 2018 Canada's Electoral Future in Comparative Perspective conference at the University of British Columbia and the 2019 Annual Conference of the Canadian Political Science Association. We are grateful to participants for comments, especially to Matthew Lebo for statistical guidance. We also thank the reviewers for CJPS, whose comments also improved the analysis.
Appendix
Table A1 Focus Canada Surveys