


INTRODUCTION
The radiative opacity plays an important role in several research areas such as inertial confinement fusion (Orlov et al., Reference Orlov, Denisov, Rosmej, Schäfer, Nisius, Wilhein, Zhidkov, Kunin, Suslov, Pinegin, Vatulin and Zhao2011; Kauffman et al., Reference Kauffman, Suter, Darrow, Kilkenny, Kornblum, Montgomery, Phillion, Rosen, Theissen, Wallace and Ze1994; André et al., Reference André, Babonneau, Bayer, Bernard, Bocher, Bruneau, Coudeville, Coutant, Dautray, Decoster, Decroisette, Desenne, Dufour, Garçonnet, Holstein, Jadaud, Jolas, Juraszek, Lachkar, Lascaux, Le Breton, Louis-Jacquet, Meyer, Mucchielli, Rousseaux, Schirmann, Schurtz, Véron and Watteau1994), and stellar physics (Rogers & Iglesias, Reference Rogers and Iglesias1994; Rose, Reference Rose1991). Experimental and theoretical determination of plasma opacity within the X-ray spectral range is also important in some applications such as designing laser produced X-ray sources (Meister et al., Reference Meister, Imran and Hoffmann2011; Nishimura et al., Reference Nishimura, Endo, Shiraga, Kato and Nakai1993; Bastiani et al., Reference Bastiani, Giulietti, Giulietti, Gizzi, Ceccotti and Macchi1995; Marzi et al., Reference Marzi, Giulietti, Giulietti, Gizzi and Salvetti2000; Babonneaua et al., Reference Babonneaua, Bochera, Bayera, Decostera, Juraszeka, Perrinea and Thiell1991; Orlov et al., Reference Orlov, Guskov, Pikuz, Rozanov, Shelkovenko, Zmitrenko and Hammer2007; Zhang et al., Reference Zhang, Key, Norreys, Danson, Neely, Rose, Walsh, Tallents, Dwivedi, Holden, Holden, Pert, Ramsden, Lewis, Macphee and You1996), and plasma diagnostics (Zastrau et al., Reference Zastrau, Burian, Chalupsky, Döppner, Dzelzainis, Fäustlin, Fortmann, Galtier, Glenzer, Gregori, Juha, Lee, Lee, Lewis, Medvedev, Nagler, Nelson, Riley, Rosmej, Toleikis, Tschentscher, Uschmann, Vinko, Wark, Whitcher and Förster2012; Jiao-Long et al., Reference Jiao-Long, Feng-Tao, Gang and Jian-Min2003). Due to the wide practical applications of radiative opacity, it has remained a subject of current studies until now and many efforts are being made to develop new models and numerical codes for evaluation of such plasmas (Gil et al., Reference Gil, Rodriguez, Martel, Florido, Rubiano, Mendoza and Minguez2013; Orlov et al., Reference Orlov, Denisov, Rosmej, Schäfer, Nisius, Wilhein, Zhidkov, Kunin, Suslov, Pinegin, Vatulin and Zhao2011; Mínguez Torres et al., 2010; Rozsnyai et al., Reference Rozsnyai2010; Rodriguez et al., Reference Rodriguez, Florido, Gil, Rubiano, Martel, Mendoza, Suárez and Mínguez2008; Gupta & Kumar, Reference Gupta and Kumar1995; Ramis et al., Reference Ramis, Meyer-ter-Vehn and Ramírez2009; Godwal et al., Reference Godwal, Sikka and Kaushik1997; Rickert et al., Reference Rickert and Meyer-Ter-Vehn1990).
High power pulsed lasers are capable for producing plasma as an intense X-ray radiation source. There are many reports in optimization of laser-plasma X-ray sources using various laser parameters and target materials. In this application, opacity is also a crucial factor in optimization of laser-plasma X-ray sources. For example, cocktail targets (mixture of two or more high-Z materials) have been widely proposed for enhancing the X-ray emission (Orzechowsk et al., Reference Orzechowski, Rosen, Kornblum, Porter and Suter1996; Gauthier et al., Reference Gauthier, Amiranoff, Chenais-popovics, Jamelot, Koenig, Labaune, Leboucher-Dalimier, Sauteret and Migus1999; Gupta & Godwal, Reference Gupta and Godwal2001). It was shown that if the high opacity region of one element overlaps with the low opacity region of the other, it is possible to obtain higher Rosseland mean opacity as compared to either of the elements in the mixtures. As a result, higher re-emission and conversion efficiency of laser light to X-ray can be achieved with such mixtures (Orzechowsk et al., Reference Orzechowski, Rosen, Kornblum, Porter and Suter1996; Gauthier et al., Reference Gauthier, Amiranoff, Chenais-popovics, Jamelot, Koenig, Labaune, Leboucher-Dalimier, Sauteret and Migus1999; Gupta & Godwal, Reference Gupta and Godwal2001).
In plasmas diagnostics, some properties such as temperature, density, and different ionization stage distribution can be determined by diagnosis of plasma radiation. However, the plasma radiation is influenced by opacity that leads to non-realistic characterization. Such a problem can be solved by combining the experimental results with those of calculations in which opacity is involved (Nishimura et al., Reference Nishimura, Endo, Shiraga, Kato and Nakai1993; Bastiani et al., Reference Bastiani, Giulietti, Giulietti, Gizzi, Ceccotti and Macchi1995).
Within the last two decades, the opacity of plasmas over a wide range of temperature and density has been studied extensively both experimentally and theoretically (Rose, Reference Rose1992; Bailey et al., Reference Bailey, Rochau, Mancini, Iglesias, Mac Farlane, Golovkin, Blancard, Cosse and Faussurier2009). In most of these studies, local thermodynamic equilibrium (LTE) conditions were assumed for plasmas. However, due to a large number of atomic data, the calculation of radiative properties of plasma is a difficult task even for low-Z elements. Such atomic data includes the atomic levels and associated involved transitions, spectral line shapes, oscillator strengths, atomic (and ionic) populations, and photo-ionization cross sections. Therefore, the attempts for accurate calculations of radiative opaque plasma are still in progress. Many efforts are being made to develop new models and numerical codes for evaluation of such plasmas (Gupta & Godwal, Reference Gupta and Godwal2002; Yongqiang et al., Reference Yongqiang, Jianhua, Yong and Jianmin2009). We have also reported preliminary results for calculation of opacity of carbon and aluminum plasmas (Mahdieh & Hosseinzadeh, Reference Mahdieh and Hosseinzadeh2010). However, the calculations were performed for restricted conditions.
In this paper, we have tried to study the opacity of low-Z plasmas (Z < 30) by developing a computer code. In some experiments, it is very important to estimate the variation of X-ray opacity in irradiated target for cold matter (Rossall et al., Reference Rossall, Gartside, Chaurasia, Tripathi, Munda, Gupta, Dhareshwar, Gaffney, Rose and Tallents2010). Abundant calculation of the radiative opacity characteristics in plasmas (temperature and density dependent) results in better understanding of physical processes in plasma produced by a high-power pulsed laser, and that is an advantage of the presented work. In addition, a comparison between the opacity of the cold matter and its plasma can be of interest for those researchers who measure the opacity of matter in a laser produced plasma experiment. Therefore, in this paper, we focused on studying the opacity of carbon and aluminum plasmas for variety range of densities and temperatures and the results were compared with the results of cold material. Furthermore, a main difference between this work and the others that are already reported in the literature is the use of some databases such as NIST Atomic Spectra Database (Martin et al., Reference Martin, Fuhr, Kelleher, Musgrove, Sugar, Wiese, Mohr and Olsen2006) for calculating the opacity. In the present work, the plasma was assumed to be in LTE and frequency dependent opacity was calculated. Atomic structure, levels, energies, oscillator strengths, and other atomic data are also provided by either analytical calculations or available data bases. These data will be referenced in the next sections where appropriate. The calculation results were compared with data from the TOPbase data (Magee et al., Reference Magee, Abdallah, Clark, Cohen, Collins and Csanak1995) and also with other results such as those from Zeng et al. (Reference Zeng, Yuan and Lu2001) and Gil et al. (Reference Gil, Rodriguez, Martel, Florido, Rubiano, Mendoza and Minguez2013).
THEORY AND COMPUTATIONAL METHOD
Population Densities of Ions
To obtain the opacity, the population densities of neutral to fully ionized ions of plasma components are required. For plasmas in LTE, the population distributions of different ionization stages are given by the well-known Saha-Boltzmann equation (Cowan, Reference Cowan1981) but modified for ionization potential:
 $$\displaystyle{{N_{i+1} N_e } \over {N_i }}=2\left({\displaystyle{{2{\rm \pi} \, mk_B T} \over {h^2 }}} \right)^{3/2} \displaystyle{{U_{i+1} } \over {U_i }}e^{\displaystyle{{ - \lpar {\rm \phi} _i - \Delta {\rm \phi} _i \rpar /k_B T} \over {k_B T}}\comma} \;$$
where N i is the total population density of ion i, N e is the number of free electrons per unit volume, ϕi is the ionization potential of ion i, Δϕi is the depression of the ionization limit caused by plasma environment restricting the number of bound states available, h is the Planck constant, k B is the Boltzmann constant, T is the temperature, m is the electron mass, and U i is the partition functions for ion i and is given by:
 $$U_i=\sum\limits_i {g_{il} e^{\displaystyle{{ - E_{il} } \over {k_B T}}} }.$$
Where g il = 2J + 1 is the statistical weight of the state l, E il is the energy of level l of ion i above the ground state. In solving the Saha-Boltzmann Eq. (1), calculation of the ionization potential depression (IPD) is needed. We chose the Debye-Huckel model (Heading et al., Reference Heading, Wark, Bennett and Lee1995) to calculate the IPD. In the Debye-Huckel model of the plasma potential, the largest radius of an electron that can still be bound is given by the Debye radius. In this model the IPD is given by:
 $$\Delta {\rm \phi} _i=\displaystyle{{ze^2 } \over {4{\rm \pi} {\rm \varepsilon} _0 }}\sqrt {\displaystyle{{e^2 N_e } \over {{\rm \varepsilon} _0\, k_B T}}}.$$
In the LTE plasma, the population density N il for level l of ion stage is determined by Boltzmann distribution function:
 $$N_{il}=g_{il} \left({\displaystyle{{N_i } \over {U_i }}} \right)e^{\displaystyle{{ - E_{il} } \over {k_B T}}}.$$
Opacity Modeling
The opacity of the material is mainly due to the absorption of photons through the processes: free-free (ff) absorption (or inverse bremsstrahlung), bound-free (bf) absorption (or photo-ionization), bound-bound (bb) absorption (or line absorption), and photon scattering processes. Hence, the total opacity for a photon at energy hν in plasma at temperature T is given by (Eliezer, Reference Eliezer2002):
 $$\eqalign{ k\lpar h{\rm \nu}\rpar &=\displaystyle{1 \over {\rm \rho} }\left[{k_{\,ff} \lpar h{\rm \nu}\rpar +k_{bf} \lpar h{\rm \nu}\rpar +k_{bb} \lpar h{\rm \nu}\rpar } \right]\cr & \quad \times\lpar 1 - e^{\displaystyle{{ - h{\rm \nu}} \over {k_B T}}} \rpar +k_{scatt} \lpar h{\rm \nu}\rpar .}$$
Where ρ denotes the density of plasma and v is the frequency of photon. The exponential term represents the correction for stimulated emission. Electron scattering is usually not an important contribution to the total opacity. It dominates only at very high temperatures, where other sources tend to decrease.
There are different theoretical models, such as average atom (AA) (Rozsnyai, Reference Rozsnyai1997), under solved transition arrays (UTA) (Bauche & Bauche-Arnoult, Reference Bauche and Bauche-Arnoult1996), super transition array (STA) (Faussurier et al., Reference Faussurier, Wilson and Chen2001), and detailed level accounting (DLA) (or detailed term accounting DTA) (Zeng et al., Reference Zeng, Jin and Yuan2006) that take different analysis on the above process. Up to now DLA has achieved great success in predicting the opacity of low-Z plasma.
The early attempts of theoretical models for the calculation of the radiative opacity were based on the statistical methods. The self-consistent AA (Green, Reference Green1964), and the UTA (Bauche et al., Reference Bauche-Arnoult, Bauche and Klapisch1978) are some examples. Since lines of different transition arrays are unresolved, STA (Bar-Shalom et al., Reference Bar-Shalom, Oreg, Goldstein, Shvarts and Zigler1989) was developed which is based on the statistical method. However, theoretical modeling for the radiative opacity of high temperature plasmas involves to plasma conditions, atomic data, state populations, and also spectral line shapes. The spectral line shapes separately can be involved to some broadening mechanisms, such as natural width, Doppler broadening, auto ionizing resonance, and collisional broadening. The models of DTA and DLA consider these issues. Although, the DTA and DLA models are very complex, since one has to obtain a great number of atomic data and to consider many different physical effects on the atomic data, they are more suitable for obtaining detailed spectrally resolved opacity. To date, DTA and DLA have achieved great success in predicting the opacity of low-Z plasmas such as aluminum (Abdallah & Clark, Reference Abdallah and Clark1991; Iglesias et al., Reference Iglesias, Nash, Chen and Rogers1994; Zeng et al., Reference Zeng, Jin, Yuan, Lu and Sun2000). It was shown that an accurate opacity can be obtained by using a DLA model for a wide range of plasmas, which are of great utility in many practical researches (Zeng et al., Reference Zeng, Jin and Yuan2006). Therefore, in this work, the plasma opacity has been calculated by using of DLA model which is described in the following section.
Free-Free Opacity
When a free electron moves in the Coulomb field of an ion the system, it emits radiation, while in the inverse process a photon is absorbed. The inverse bremsstrahlung or ff absorption coefficient is given by the semi-classical Kramer's formula (Zel'dovich & Raizer, Reference Zel'dovich and Raizer1966).
 $${\rm \kappa} _{\,ff} \left({h{\rm \upsilon} } \right)=\displaystyle{4 \over 3}\left[{\displaystyle{{2{\rm \pi} } \over {3m_e k_B T}}} \right]^{1/2} \times \;\;G_{\,ff} \displaystyle{{N_e e^6 } \over {hcm\matrix{ {{\rm \upsilon} ^3 } \cr } }}\sum\limits_i {N_i Z_i^2 }\comma \;$$
where, e is the electron charge, and c is the speed of light. The parameters N e and N i are the electron and ion densities, respectively. The parameter Z i is the ionic charge number, and summation is given for all ions. The parameter G ff is the ff Gaunt factor. The Gaunt factor G ff = 1 at low temperatures <400 eV or G ff = 1.4at temperatures >400 eV (Hutchinson, Reference Hutchinson2002). Similarly, G ff = 0 for photon energy less than the ground state ionization potential, but otherwise G ff = 1. In Eq. (5), by summing over all ions present in a plasma, the total ff opacity can be evaluated at a given frequency and temperature.
Bound-Free Opacity
Bound-free absorption occurs when a photon is absorbed by a bound electron, the process is associated with the release of a bound electron around an atom or ion. The bf absorption coefficient can be obtained by:
 $${\rm \kappa} _{bf} \left({h{\rm \upsilon} } \right)=\sum\limits_i {N_i {\rm \sigma} _{ibf} \left({h{\rm \nu}} \right)}\comma \;$$
where σibf (hν) is the photo-ionization cross-section per ion i. For the present work, all the photo-ionization cross-sections were obtained from the reference (Verner et al., Reference Verner, Ferland, Korista and Yakovlev1996).
Bound-Bound Opacity
In this case, an electron is moved from one bound orbit in an atom or ion to an orbit of higher energy due to the absorption of a photon. The bb opacity for photon at energy hν is given by:
 $${\rm \kappa} _{bb} \left({h{\rm \upsilon} } \right)=\sum\limits_i {\left({\sum\limits_{ll^{\prime}} {N_{il} {\rm \sigma} _{ill^{\prime}} \left({h{\rm \nu}} \right)} } \right)}\comma \;$$
where σill′ (hν) is the cross-section for the photo-excitation process from level l to l' and is given by:
 $${\rm \sigma} _{ill^{\prime}} \left({h{\rm \upsilon} } \right)=\displaystyle{{{\rm \pi} he^2 } \over {m_e c}}f_{ill^{\prime}} S\lpar h{\rm \nu}\rpar .$$
The bb cross-section is a function of the oscillator strength f ill′, and S(hν) denotes the line profile. In this work, Doppler broadening has been taken into account for S(hν) (Hutchinson, Reference Hutchinson2002). By comparing the results of the present work with those of some other available calculations (which will be shown in the following sections), we concluded that the Doppler broadening may be enough to give accurate results for the calculations. However, for more precise calculations, one needs to consider other line profiles such as Stark broadening. In Eq. (7), by summing over all ions, and related level populations the total bb opacity can be evaluated at a given frequency and for given plasma.
The atomic data used in this work (ionization energies, energy levels, statistical weights, and the oscillator strengths) were also taken from the National Institute of Standards and Technology (NIST), they are the most accurate sources and calculations known at present (Martin et al., Reference Martin, Fuhr, Kelleher, Musgrove, Sugar, Wiese, Mohr and Olsen2006). These NIST data were produced by combination of experiment and calculations. For example, some energy levels of aluminum (Al I through Al XIII) were critically compiled, mainly from published material on measurements and analyses of the optical spectra but Martin and Zalubas (Reference Martin and Zalubas1979) derived or recalculated the levels for a number of the ions.
CODE VALIDATION
Using the formulae and method discussed in the previous section, a computer code was developed for calculating the radiative opacity under different plasma temperature and density conditions. In order to verify the validation of the code and the computational technique, the code was applied to aluminum plasma with temperature of 20 eV and density of 0.01 g/cm3, and the radiative opacity was calculated. The radiative opacity of this plasma condition can be given by Rosseland Mean Opacity Tables (Rogers & Iglesias, Reference Rogers and Iglesias1992). The radiative opacity of such plasma condition was also measured experimentally by Winhart et al. (Reference Winhart, Eidmann, Iglesias and Bar-Shalom1996), and verified numerically by Zeng et al. (Reference Zeng, Yuan and Lu2001).
By solving the set of nonlinear modified Saha-Boltzmann Eq. (1), the population distribution of aluminum plasma components (including neutrals, partially ionized, and fully ionized ions) were calculated. In these calculations, the total number of charged and neutral particles were assumed to be constant (the total number of particles is the atomic density of the initial neutrals). The ionization potential (IP) in eV (Moore, Reference Moore1970) and the calculated ionization potential depression (IPD) for different ionization stages for aluminum plasma with the temperature of 20 eV and density of 0.01 g/cm3 are listed in Table 1. Figure 1 shows the ion population fractions versus the charge state Z i for aluminum plasma at temperature of 20 eV and density of 0.01 g/cm3. As Figure 1 shows, in such density and temperature, the most abundant species in the plasma are Al V, Al VI, and Al IV ions with a population of about 50%, 33%, and 14%, respectively.

Fig. 1. (Colour online) Population fraction versus the charge state for aluminum plasma at temperature 20 eV, and density of 0.01 g/cm−3, respectively.
Table 1. The ionization potential (IP) in (Moore, Reference Moore1970) and the calculated ionization potential depression (IPD) for aluminum plasma with the temperature of 20 eV and density of 0.01 g/cm3

The calculations show an average ionization degree of 4.2. This value is in good agreement with the result of the OPAL opacity code, which gives 4.3 (Iglesias & Rogers, Reference Iglesias and Rogers1996) and that of Jin et al. (Reference Jin, Zeng and Yuan2008) who reported a value of 4.2 average ionization degree. Using the ions population fractions data, the opacity was also calculated for the above mentioned aluminum plasma and the results were compared with those reported by Zeng et al. (Reference Zeng, Yuan and Lu2001) and those in TOPbase data (Magee et al., Reference Magee, Abdallah, Clark, Cohen, Collins and Csanak1995).
As an example, the atomic data (oscillator strengths f ik, energy levels E i and E k and statistical weights g) for lower level i to upper level k of Al VI ion, taken from the NIST (Martin et al., Reference Martin, Fuhr, Kelleher, Musgrove, Sugar, Wiese, Mohr and Olsen2006) are listed in Table 2. Figure 2 shows the frequency dependent opacity that was calculated by our code and that reported by Zeng et al. (Reference Zeng, Yuan and Lu2001).

Fig. 2. Frequency-dependent opacity versus incident photon energy for aluminum plasma at temperature 20 eV, and density of 0.01 g/cm−3. (a) Present work and (b) results reported by (Zeng et al., Reference Zeng, Yuan and Lu2001). The solid line refers to the detailed level accounting calculation and the dashed line to the average atom model (Zeng et al., Reference Zeng, Yuan and Lu2001).
Table 2. The atomic data (oscillator strengths fik,energy levels E i and E k and statistical weights g) for lower level i to upper level k of Al VI ion from NIST (Martin et al., Reference Martin, Fuhr, Kelleher, Musgrove, Sugar, Wiese, Mohr and Olsen2006)

The sharp absorption edge near 150 eV is attributed to the Al V ions, which is the most abundant species in such plasma conditions. As it can be seen in Figure 2, the results of our calculations are almost similar to those of reference (Zeng et al., Reference Zeng, Yuan and Lu2001). However, the results of our calculations show that the opacity values are slightly smaller than those of reference (Zeng et al., Reference Zeng, Yuan and Lu2001) especially in lower photon energy. Such discrepancy may be due to the atomic data that are used in two cases. In fact, the opacity calculation requires a large amount of atomic data, and the accuracy of the opacity strongly depends on the accuracy of the atomic data. The results were also compared to the calculated opacity which is available in TOPbase data (Magee et al., Reference Magee, Abdallah, Clark, Cohen, Collins and Csanak1995) (Fig. 3).

Fig. 3. (Color online) Frequency-dependent opacity versus incident photon energy for 20 eV aluminum plasma at density of 0.01 g/cm−3.
As the Figure 3 shows, the results of our calculations have similar trend to those in TOPbase and both results are fairly in good agreement. The absorption around 150 eV is mainly due to the M-shell transitions. The two main discrepancies including the number of bb transitions and the amplitude of the peaks are due to the fact that most of bb transitions (but not all) with larger oscillator strengths for the most abundant species in the plasma including Al V, Al VI, and Al IV ions were considered. Such results can be better fitted if one considers all of the bb absorption lines in the calculations. In addition, the consideration of more realistic line-broadening can produce an increase of the opacity. In this work, we just considered Doppler broadening in our calculations. Therefore, the results may be better fitted if we consider stark broadening. We will consider this issue in our future works.
In some practical applications such as energy transfer through hot dense matter, Rosseland and Planck mean opacities are used. The Rosseland and Planck mean opacities can be calculated by using relations Eqs. (10) and (11), respectively:
 $${\rm \kappa} _{Rosseland}=\displaystyle{{\int_0^\infty {\displaystyle{{\partial B_{\rm \nu} } \over {\partial T}}d{\rm \nu} } } \over {\int_0^\infty {\displaystyle{1 \over {{\rm \kappa} _{ext.} }}\displaystyle{{\partial B_{\rm \nu} } \over {\partial T}}d{\rm \nu} } }}\comma \;$$
 $${\rm \kappa} _{Planck}=\displaystyle{{\int_0^\infty {{\rm \kappa} _{abs} B_{\rm \nu} d{\rm \nu} } } \over {\int_0^\infty {B_{\rm \nu} d{\rm \nu} } }}.$$
Where κabs. represents the plasma opacity due to absorption, κext. is the plasma opacity due to extinction (i.e., absorption and scattering), and B ν is the Planck's black body function for a plasma at temperature T.
It may be useful to compare the Rosseland and Planck mean opacities with the frequency dependent opacities. For example, for aluminum plasma at temperature 20 eV, and density of 0.01 g/cm−3, the Rosseland and Planck mean opacities were calculated by Zeng et al. (Reference Zeng, Jin and Yuan2006) and given as 4184 and 24891 cm2g−1, respectively.
For another example for validation of the code, we calculated the population fraction for carbon and compared the results with those of Gil et al. (Reference Gil, Rodriguez, Martel, Florido, Rubiano, Mendoza and Minguez2013). The results presented in Figure 4. In Figure 4a, the population fraction of different carbon ions (with density of 0.1 g/cm3) versus temperature is presented. These results are obtained by Gil et al. (Reference Gil, Rodriguez, Martel, Florido, Rubiano, Mendoza and Minguez2013). For a specific temperature (such as 20 eV), one can easily extract the population fraction verses charge state out of Figure 4a. The results of such extraction for carbon plasma with temperature of 20 eV appear in Figure 4b.

Fig. 4. (Color online) (a) Population fraction versus temperature for different carbon ions at density of 0.1 g/cm−3 (Gil et al., Reference Gil, Rodriguez, Martel, Florido, Rubiano, Mendoza and Minguez2013). (b) Population fraction versus the charge state for carbon plasma at temperature 20 eV, and density of 0.1 g/cm−3 (the results given by Gil et al., Reference Gil, Rodriguez, Martel, Florido, Rubiano, Mendoza and Minguez2013, and the present work).
Using our code, we also calculated the population fraction of carbon plasma (with temperature of 20 eV and density of 0.1 g/cm3) and presented the results in Figure 4b. Table 3 also gives the calculated IP and PD for carbon plasma ions with the temperature of 20 eV and density of 0.1 g/cm3.
Table 3. The ionization potential (IP) and the calculated ionization potential depression (IPD) for carbon plasma with the temperature of 20 eV and density of 0.1 g/cm3
It can be seen that the population fraction increases for the carbon ions with the following form, i.e., C IV > C III > C V > C II. Figure 4 shows that there is good agreement between our results and those given by Gil et al. (Reference Gil, Rodriguez, Martel, Florido, Rubiano, Mendoza and Minguez2013).
RESULTS AND DISCUSSIONS
In this section, we have made a systematic study of the spectrally resolved opacities under different plasma conditions. Although the code is developed for all low-Z plasmas (Z < 30), in this paper only carbon and aluminum plasmas were studied as two examples. In this section, we present some results for the opacity of two low-Z plasmas, i.e., carbon and aluminum plasmas. Carbon and aluminum plasmas have been of particular interests and were studied both experimentally and numerically (Jin et al., Reference Jin, Zeng and Yuan2008; Colgan et al., Reference Colgan, Fontesb and Abdallah2006). The influences of plasma density and temperature were investigated on the frequency dependent opacity and the results were compared with those of cold matter.
Comparison between Free-Free Absorption and Bound-Free Absorption
For aluminum plasma with the temperature of 20 eV and density of 0.01 g/cm3, individual opacities, i.e., ff and bf ones were presented in Figure 5 to give an estimation of their relative contributions to the opacity.

Fig. 5. (Color online) Free-free and bound-free absorption for aluminum plasma with the temperature of 20 eV and density of 0.01 g/cm3.
It can be seen in Figure 5 that the ff process is dominated for the lower energy photons but the bf contribution can exceed the ff absorption with increasing photon energy. According to this result, for photons with energies below about 50 eV, the major absorption mechanism is caused by ff absorption. However, with increasing the photon energy, bf absorption would play the major role for plasma with such density and temperature. As mentioned before the absorption edge near 150 eV is caused by the bf process of Al V ions that are the most abundant species in the plasma component at this density and temperature.
Density Dependence of Radiative Opacity
Figure 6a shows the opacity contributed by ff absorption and bf absorption for aluminum plasma versus photon energy at four different plasma densities 0.01, 0.1, 1, and 3 g/cm−3. The temperature of the plasma in this figure was assumed to be 20 eV. The associated population fractions versus charge state for these aluminum plasmas are also presented in Figure 6b. Figure 6b shows that in aluminum plasma, the lower the density, the higher is the charge state for the population fraction peak. For example, for the plasma density of 0.01 g/cm−3, the population fraction is maximum at charge state of about 5, while for the plasma density of 3 g/cm−3, the population fraction peak shifts to charge state of about 2.8.

Fig. 6. (Color online) (a) Spectrally resolved radiative opacities for aluminum plasma at temperatures of 20 eV and densities of 0.01, 0.1, 1, and 3 g/cm−3. (b) The population fraction versus charge state for aluminum plasmas at temperatures of 20 eV and densities of 0.01, 0.1, 1, and 3 g/cm−3.
As the Figure 6a shows the plasma opacity increases with increasing the plasma density (within the photon energy range up to about 240 eV) and then remains almost constant (with respect to plasma density). Such a result is due to the variation of populations. In fact, the abundance of plasma components' population is increased by increasing the plasma density; therefore, an increase in the total opacity is expected. This means that the lower density plasmas are more transparent for incident photons (photons with low energies).
As mentioned in the previous sections, the main absorption mechanism for low photon energy region is ff absorption. By increasing the plasma density, the population of electrons will also increase correspondingly. Consequently, the ff absorption is enhanced for higher plasma density. However, with increasing photon energy, the bf absorption is the dominant absorption mechanism in the plasma. Under such a plasma condition, the plasma components up to Al VII have more population and the absorption edges of these components shifts up to about 240 eV. Moreover, in plasma with a temperature of 20 eV (which is low), the populations of plasma components for higher order ions are not varied significantly. Therefore, with increasing densities in aluminum plasma, it is not expected to have any significant change in total absorption for photons with energies higher than about 240 eV.
Figure 7a shows the opacity contributed by ff absorption and bf absorption for carbon plasma versus photon energy at temperature 20 eV, and different electron densities, i.e., 0.001, 0.01, 0.1, and 1 g/cm−3.
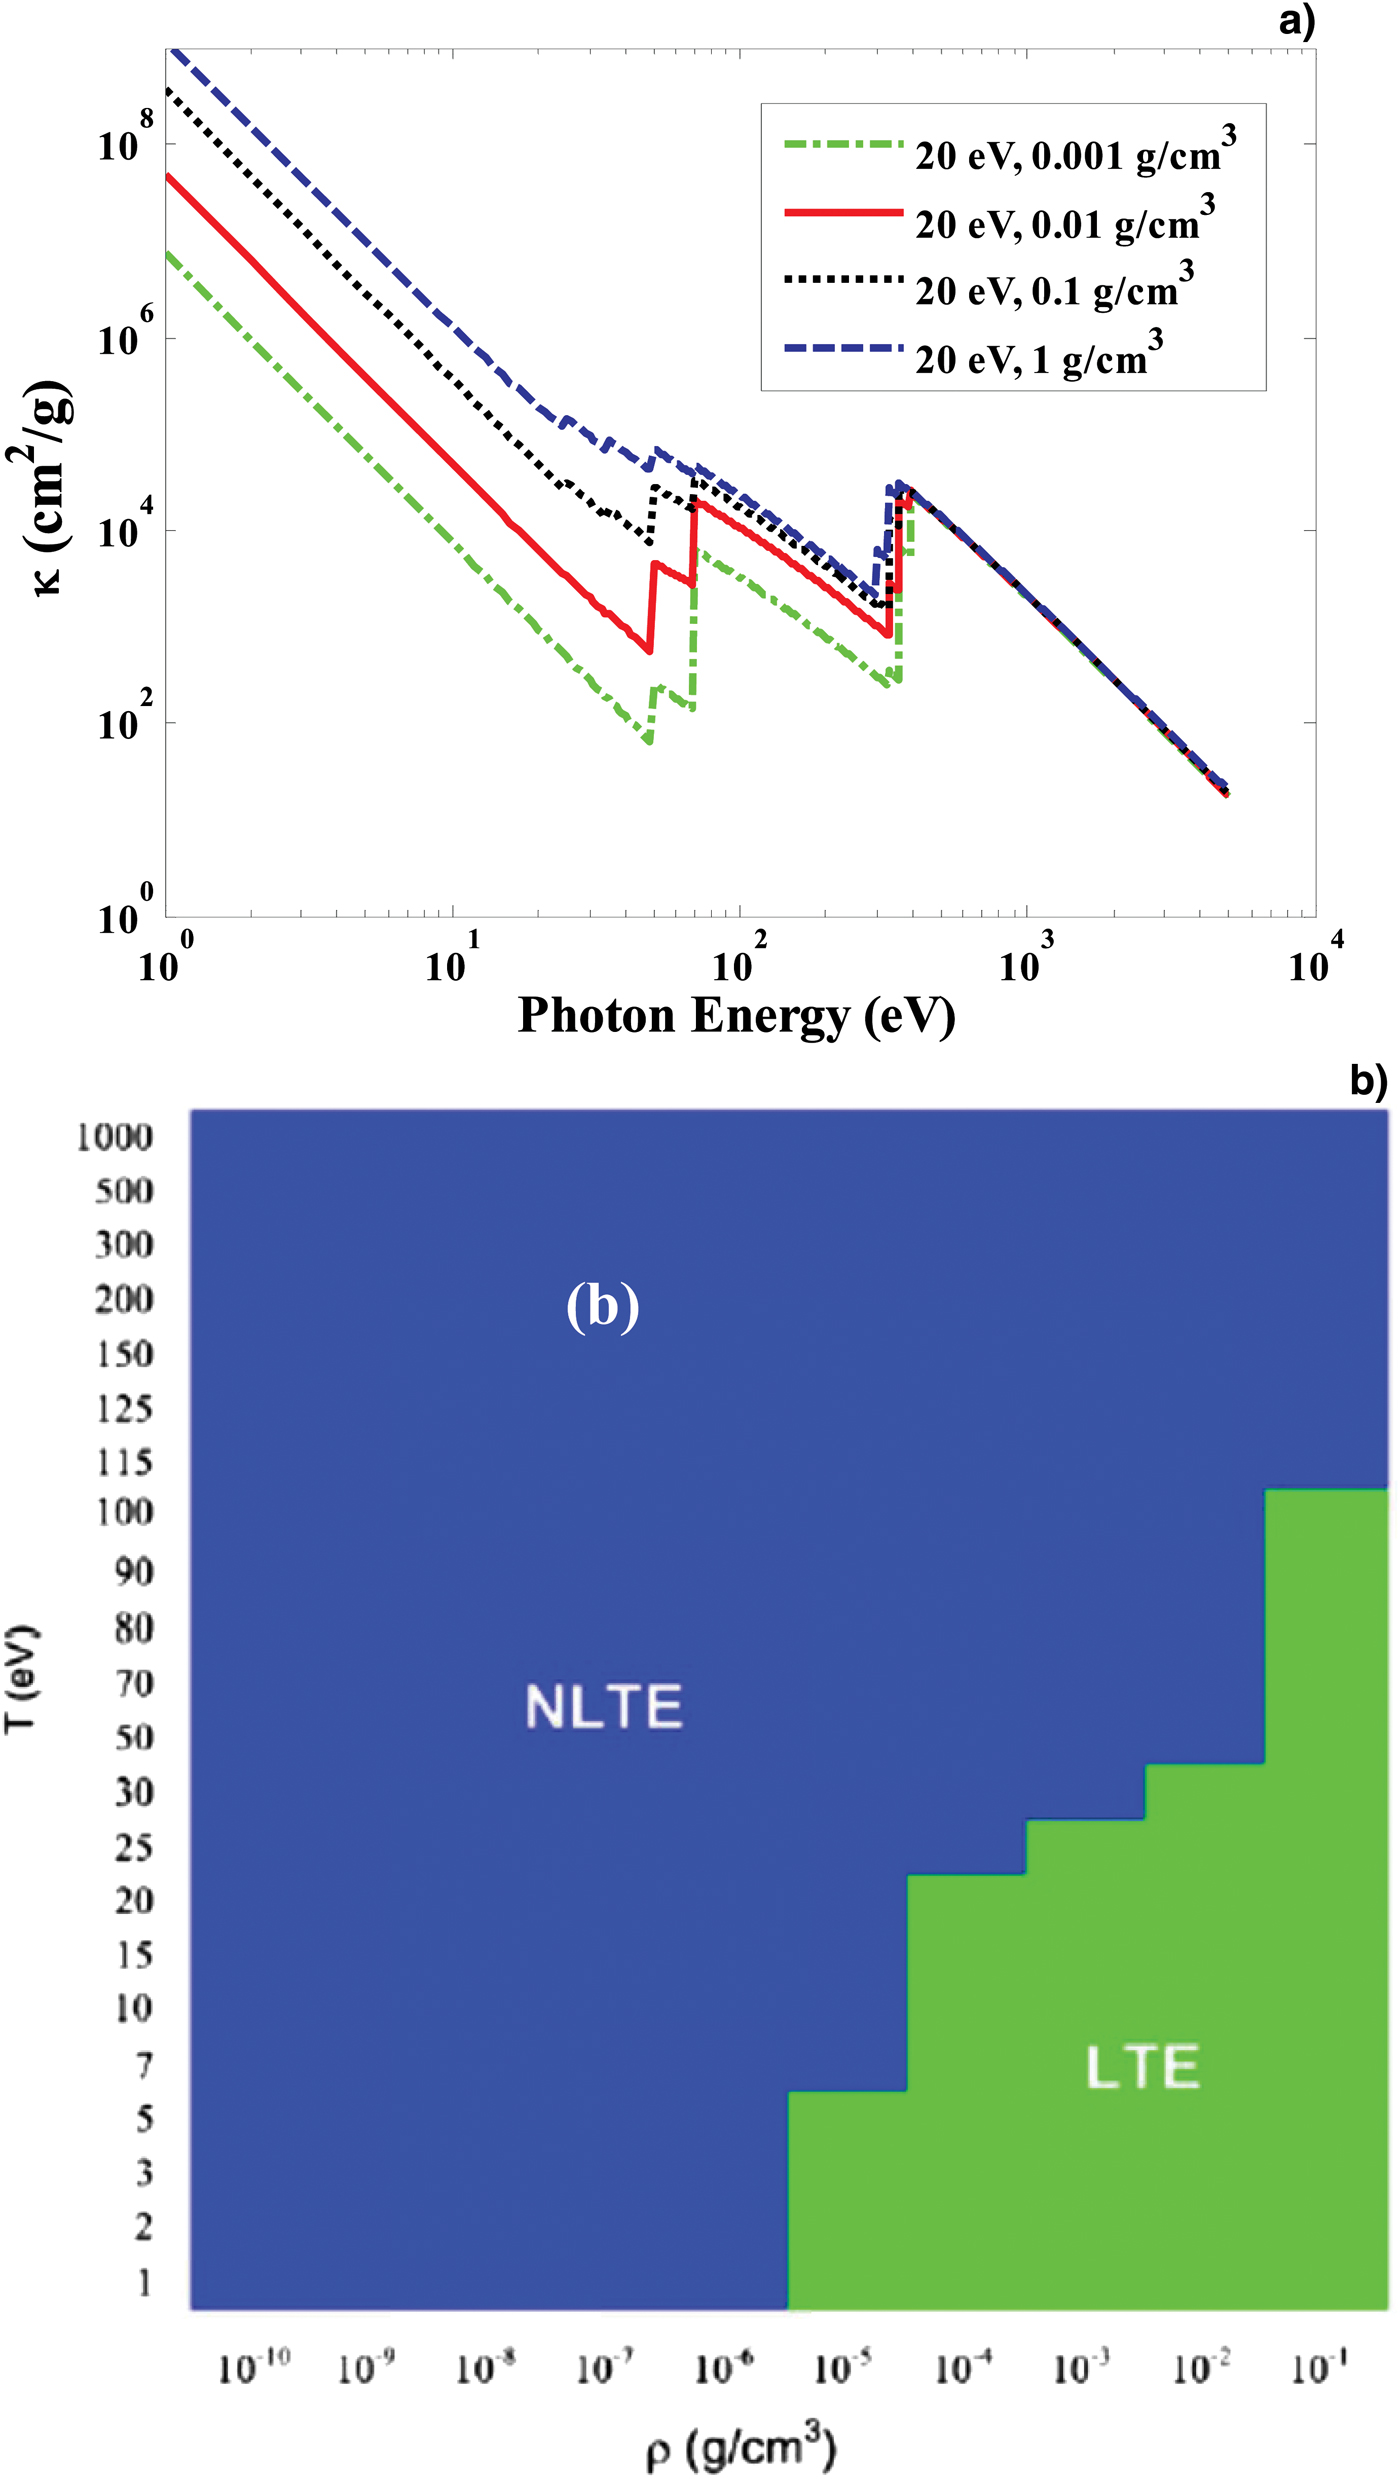
Fig. 7. (Color online) (a) Spectrally resolved radiative opacities for carbon plasma at a temperatures of 100 eV and density of 0.001, 0.01, 0.1, and 1 g/cm−3. (b) The conditions for LTE and non-LTE carbon plasmas given by Gil et al. (Reference Gil, Rodriguez, Martel, Florido, Rubiano, Mendoza and Minguez2013).
In order to show that we are in LTE conditions, the results of LTE and non-LTE carbon plasmas (given by Gil et al., Reference Gil, Rodriguez, Martel, Florido, Rubiano, Mendoza and Minguez2013) are presented in Figure 7b. It must be noted that for colder carbon plasma (lower than 100 eV); the variations of opacity with different densities have a similar trend. However, we were interested to see the effect of plasma density for carbon plasma with temperature of about 20 eV in order to be able to compare the results with those of aluminum. Nevertheless, these results are partly similar to those of aluminum plasma. For example, the plasma opacity increases with increasing the plasma density (within the photon energy range up to about 500 eV). Such increment in opacity (for low photon energies) is due to enhancement of ff absorption. As explained for aluminum plasma, increasing the plasma density results in a rise of the population of electrons, which leads to enhancement of ff absorption. Therefore, the rise in opacity (versus plasma density) for photons with energies <500 eV, is mainly due to ff absorption. As explained before, the fb absorption possesses a dominant effect in opacity for photons with higher energies. As the carbon plasma temperature rises (20 eV in our case), the populations of plasma components for higher order ions are varied significantly, which results in a growth of opacity when the plasma density increases. For example, Figure 7a shows a rise of one order of magnitude in opacity (for photon energies ranging from about 100 eV to 500 eV) when the plasma density changes from 0.001 g/cm−3 to 1 g/cm−3.
Temperature Dependence of the Radiative Opacity
Figure 8a shows the carbon plasma opacity with respect to the photon energies for four different plasma temperatures 10, 20, 50, and 100 eV. In this figure, a density of 0.1 g/cm−3 was assumed for the plasma. The associated population fraction versus charge states is also presented in Figure 8b.

Fig. 8. (Color online) (a) Spectrally resolved radiative opacities for carbon plasmas at a density of 0.1 g/cm−3 and temperatures of 10, 20, 50, and 100 eV. (b) The population fraction versus charge state for carbon plasmas at a density of 0.1 g/cm−3 and temperatures of 10, 20, 50, and 100 eV.
Figure 9a shows the opacity for aluminum plasma with respect to the photon energies for four different plasma temperatures 10, 20, 50, and 100 eV. In this figure, a density of 0.01 g/cm−3 was assumed for the plasma. The associated population fraction versus charge states for this plasma is also presented in Figure 9b. It must be noted that these temperatures and density were chosen to make sure that the calculations are performed for LTE conditions.

Fig. 9. (Color online) Spectrally resolved radiative opacities for aluminum plasmas at a density of 0.01 g/cm−3 and (a) temperatures of 10, 20, 50, 100 eV, and (b) the population fraction versus charge state for aluminum plasmas at a density of 0.01 g/cm−3 and temperatures of 10, 20, 50. and 100 eV.
According to the results in Figures 8, and 9, the plasma opacity for low photon energies (almost photon energies <100 eV) rises with increasing temperature. However, such increment in opacity is insignificant for photon energies >100 eV. The behavior of the opacity with respect to temperature is mainly related to an ionization degree of the plasma. In fact, as the plasma temperature is increased, the average ionization degree of the plasma is increased, which in turn results in increasing the electron and ion density of the plasma. A similar explanation has been presented in reference (Rodríguez et al., Reference Rodriguez, Florido, Gil, Rubiano, Martel and Minguez2008).
Opacity Comparison between Cold Matter (Carbon and Aluminum), and Plasma (Carbon and Aluminum Plasmas)
Figure 10 shows the opacity contributed by ff absorption and bf absorption for cold aluminum and hot aluminum plasma versus photon energy at a density of 0.01 g/cm−3. The opacity for cold aluminum was taken from NIST database which is mainly based on reference (Seltzer, Reference Seltzer1993). The temperature of the plasma in this figure was assumed to be 30 eV. Similar calculations were performed for cold carbon and carbon plasma and almost similar results were obtained (Fig. 11).

Fig. 10. (Color online) Spectrally resolved radiative opacities for cold aluminum and aluminum plasmas at a density of 0.01 g/cm−3 and temperatures of 30 eV.

Fig. 11. (Color online) Spectrally resolved radiative opacities for cold carbon and carbon plasma at a density of 0.01 g/cm−3 and temperatures of 30 eV.
As Figures 10 and 11 shows, with respect to cold matter, the opacity decreases for the matter in plasma state. For aluminum plasma, the absorption edge of the K shell is shifted to higher photon energy. The main reason for this trend of line shift is that the mean ionization degree increases with temperature. For instance, for aluminum at temperature of 30 eV and density of 0.01 g/cm−3, the average ionization degree is 5.8. The corresponding maximum fraction of the aluminum ion at this condition is Al VII (about 50%). Any changes to the plasma condition may change the ion fractions and consequently the absorption lines shift to higher photon energy. However, for carbon plasma no absorption edge can be seen as there is no absorption edge within the photon energy ranges (i.e., 1000–5000 eV) in which the calculations were performed.
CONCLUSION
In this work, a computer code was developed for calculating the opacity of low-Z plasmas. The calculations are based on ff, bf, and bb transitions in LTE plasma. Atomic structures, transition levels, oscillator strengths, and others atomic data are provided for these calculations. The validation of the calculations was confirmed by comparing the calculation results of carbon and aluminum plasmas (at some specific conditions) with those of some others in literature such as TOPbase data and Zeng et al. (Reference Zeng, Jin, Yuan, Lu and Sun2000) results. The influences of plasma density and temperature on carbon and aluminum plasma opacities were investigated. From the results it was concluded that the opacity depends significantly on plasma characteristics, i.e., plasma temperature and density. Comparing the results with those of cold mater, it has been shown that the opacity may be changed significantly for the plasma state of the matter.


