Introduction
A history of conduct disorder (CD), or other antisocial behaviors (ASBs), and exposure to peer deviance (PD) in adolescence are among the strongest predictors of future externalizing behaviors (Hawkins et al. Reference Hawkins, Herrenkohl, Farrington, Brewer, Catalano, Harachi, Loeber and Farrington1998; Petraitis et al. Reference Petraitis, Flay, Miller, Torpy and Greiner1998; van den Bree & Pickworth, Reference van den Bree and Pickworth2005). Consequently, CD and PD figure prominently in developmental models for ASB (e.g. Patterson et al. Reference Patterson, DeBaryshe and Ramsey1989; Coie & Miller-Johnson, Reference Coie, Miller-Johnson, Loeber and Farrington2001; Farrington, Reference Farrington2005).
A central issue has been the causal relationship between CD and PD (Kandel, Reference Kandel1978, Reference Kandel1996). To what extent do pressures for conformity influence adolescents to adopt behaviors of their peers (through social influence), versus do adolescents actively seek out like-minded friends who share their attitudes and behavioral proclivities (through social selection)? Prior longitudinal studies provide mixed results regarding the importance of these two processes (e.g. Kandel, Reference Kandel1978, Reference Kandel1996; Wills & Cleary, Reference Wills and Cleary1999; Gordon et al. Reference Gordon, Lahey, Kawai, Loeber, Stouthamer-Loeber and Farrington2004; Lacourse et al. Reference Lacourse, Nagin, Vitaro, Cote, Arseneault and Tremblay2006), although the majority of studies suggest that both influence and selection are at work. However, studies based on self-report PD from samples of unrelated individuals may overestimate peer influence and underestimate peer selection effects (Rowe et al. Reference Rowe, Woulbroun, Gulley, Hetherington, Reiss and Plomin1993; Aseltine, Reference Aseltine1995). Moreover, even longitudinal studies of adolescents may be inadequate to resolve questions of causality, as individual, family and social characteristics in childhood can predict peer group characteristics in adolescence (Fergusson & Horwood, Reference Fergusson and Horwood1999; Fergusson et al. Reference Fergusson, Woodward and Horwood1999), clouding the issue of what causes initial peer selection to begin with.
A genetic strategy offers an alternative approach to disentangling mechanisms of peer influence and selection. If PD is heritable – that is, if genetic factors account for a significant proportion of variation in PD – this would suggest that individuals play a role in their choice of peers, supporting the existence of peer selection effects. To date, behavioral genetic studies of PD are scarce, and results variable. Early studies using the Sibling Inventory of Differential Experience, a measure designed to quantify differences in environments across sibling pairs, found evidence for genetic influences on PD (Daniels & Plomin, Reference Daniels and Plomin1985; Baker & Daniels, Reference Baker and Daniels1990; Pike et al. Reference Pike, Manke, Reiss and Plomin2000). Traditional behavioral genetic studies of PD have yielded less consistent results. In an analysis of parental reports of PD from a twin/family study of 10- to 18-year-olds, Manke et al. (Reference Manke, McGuire, Reiss, Hetherington and Plomin1995) found that PD was substantially heritable. By contrast, using twin/sibling self-reports of PD from the same sample, Iervolino et al. (Reference Iervolino, Pike, Manke, Reiss, Hetherington and Plomin2002) found that variation in PD was influenced primarily by shared and non-shared environmental influences. Using self- and teacher-report data from over 1700 same-sex twin pairs aged 14–16, Walden et al. (Reference Walden, McGue, Iacono, Burt and Elkins2004) found that genetic factors accounted for only modest proportions of variation in PD, with shared environmental factors being more important. In 12-year-old Finnish twins, Rose (Reference Rose, Pulkkinen and Caspi2002) found, after excluding friends shared by both twins, higher correlations for peer ratings of behavior problems in the friends unique to each member of monozygotic (MZ) versus dizygotic (DZ) twin pairs, suggesting genetic influence on peer behavior. Cleveland et al. (Reference Cleveland, Wiebe and Rowe2005) used the AddHealth sample to model genetic and environmental influences on substance use behavior reported by the friends of twins and siblings, and found that genetic factors accounted for 64% of the variance in peer drinking and smoking behavior. However, a more recent study based on teacher reports of peer antisocial behavior revealed only modest heritabilities (Bullock et al. Reference Bullock, Deater-Deckard and Leve2006).
In contrast to the modest body of research on PD, decades of research involving twin and adoption studies show that genetic factors account for a substantial proportion of individual differences in adolescent ASB, including delinquency, aggression and CD (for meta-analyses and reviews, see Miles & Carey, Reference Miles and Carey1997; Slutske, Reference Slutske2001; Rhee & Waldman, Reference Rhee and Waldman2002; Jacobson, Reference Jacobson, Kendler and Eaves2006). However, studies of child and adolescent ASB also typically find that shared environmental factors account for approximately 20% of the overall variation, in contrast to studies of adult antisocial behavior and criminality, which typically find genetic factors to be the sole source of familial resemblance (Lyons et al. Reference Lyons, True, Eisen, Goldberg, Meyer, Faraone, Eaves and Tsuang1995; Miles & Carey, Reference Miles and Carey1997; Jacobson et al. Reference Jacobson, Prescott and Kendler2002; Rhee & Waldman, Reference Rhee and Waldman2002).
Several potential explanations have been proposed for the shared environmental influences on child and adolescent ASB, including parental treatment as well as community and neighborhood characteristics. An alternative source of shared environmental influences found that using twin designs may be sibling effects, or the effects of shared peers. In one of the first twin studies of adolescent delinquency, Rowe (Reference Rowe1983) reported that a substantial proportion of same-age, same-sex twin pairs reported co-offending (i.e. participating in delinquent activities together). Because there were no differences in rates of joint antisocial behavior across zygosity in this study, these types of sibling interaction effects would contribute to the shared environmental influence on delinquency. Critics of behavioral genetics have speculated that MZ twins may be more likely to share environmental experiences than DZ twins, which might overstate the effects of heritability on antisocial and related behaviors. In an effort to address these criticisms directly, a recent paper using an earlier wave of data from the Virginia Twin Registry included the frequency of shared peer networks as an additional source of twin resemblance for CD to determine the potential effects of zygosity differences in shared peer networks (Jacobson et al. in press). Even though MZ twins were more likely than DZ twins to report shared friends, adding peer similarity to the model of adolescent CD decreased estimates of heritability only slightly (from 0.31 to 0.27). Unexpectedly, adding a variable for shared peers also decreased the importance of shared environmental influences on CD, suggesting that similarity of peer behavior accounts for part of both the genetic and the shared environmental influence on CD.
To our knowledge, only one prior study has modeled genetic and environmental influences directly on the relationship between PD and adolescent ASB. This study, based on a small sample of high-school-aged twins from Ohio, reported that 61–64% of the phenotypic association between PD and ASB could be accounted for by shared genetic factors, suggesting that the causal pathway between PD and ASB is largely driven by genetic factors, consistent with the presence of peer selection effects (Rowe & Osgood, Reference Rowe and Osgood1984). Nevertheless, in order to draw appropriate conclusions on how genetic and environmental factors may mediate peer selection and peer influence effects on ASB, longitudinal data that can jointly examine the effects of PD on later ASB, and the effects of ASB on later PD, are needed.
Thus, the purpose of the present study was to examine the relationship between CD and PD from a population-based sample of 746 male–male twins over three critical age periods: 8–11, 12–15 and 16–18 years. We fit developmental models to clarify the causal relationship between CD and PD. By decomposing these developmental pathways into those resulting from genetic versus environmental factors, we hoped to clarify the inter-relationship of CD and PD over time, and elucidate the pathways resulting from social influence and social selection.
Method
Sample
This report is based on data collected in the third wave of interviews in a study of Caucasian adult male twins born between 1940 and 1974 from the Virginia Twin Registry. Response rates for the first (1993–1996) and second (1994–1998) wave interviews were 72.4% and 82.6% respectively. The third interview wave, restricted to only male–male twins, was completed in 1998–2004 by 1796 male twins (75%) who had participated in the second interview. Subjects were 24–62 years old (mean age=40.3 years, s.d.=9.0). Most subjects were interviewed by telephone. After an explanation of the research protocol, signed informed consent was obtained before all face-to-face interviews and verbal informed consent was obtained before all telephone interviews. This project was approved by the Committee for the Conduct of Human Research at Virginia Commonwealth University. Members of a twin pair were always interviewed by different interviewers. Zygosity was assigned by a combination of self-report measures, photographs and DNA polymorphisms. The current report used both members of the 746 complete twin pairs from this sample (463 MZ and 283 DZ) with data on CD and PD for all three time periods.
Assessment
To increase accuracy of recall, we implemented a life history calendar interview (Freedman et al. Reference Freedman, Thornton, Camburn, Alwin and Young-DeMarco1988). We focused on three age periods containing assessments of CD and PD: 8–11, 12–14 and 15–17. These periods were assessed sequentially after the development of a calendar tracing major developmental events. Interviewers began each new period with memory prompts from the calendar to ‘cue’ the respondent into the relevant ‘memory files’.
CD was assessed by 11 items from the Semi-Structured Assessment for the Genetics of Alcoholism (SSAGA) interview using a four-point scale (Bucholz et al. Reference Bucholz, Cadoret, Cloninger, Dinwiddie, Hesselbrock, Nurnberger, Reich, Schmidt and Schuckit1994) operationalizing DSM-III-R criteria excluding the highly deviant A criteria 9 (forcing someone into sexual activity) and 13 (physically cruel to people). During pilot testing, several twins objected to the nature of other CD items. To avert further concerns, we asked all individuals the five most commonly endorsed CD criteria (‘physical fights’, ‘telling lies’, ‘playing hooky’, ‘stealing’ and ‘physically hurt other people’). If they responded negatively to these, we assumed they lacked CD symptoms and skipped to the next section. If they answered one or more item positively, we asked the remaining six items. Missing values for CD were so rare (0.1%) that we imputed the mean of the non-missing items.
PD was assessed by 12 items, obtained from two well-validated instruments (Johnston et al. Reference Johnston, Bachman and O'Malley1982; Tarter & Hegedus, Reference Tarter and Hegedus1991), that evaluated, on a five-point scale, the proportion of respondent's friends who engaged in specific deviant behaviors such as ‘smoked cigarettes’, ‘got drunk’, ‘skipped or cut school a lot’ and ‘stole anything or damaged property on purpose’. Four highly deviant items were excluded from the age 8–11 assessment when, during our pilot, several respondents reacted negatively to them.
Intra-class test–retest correlations for our CD and PD measures in our three age groups, based on 141 randomly selected subjects interviewed an average of 29 days apart [mean age=40.4 (s.d.=9.1), range 25–61], were respectively +0.67, +0.73 and +0.75 and +0.42, +0.75 and +0.81. (For PD, the within-individual across-time variation was similar in the 8–11 and other age periods. The low correlation at age 8–11 resulted from much lower between-person variation in this age compared to other age periods.)
Statistical analysis
Structurally missing items for PD were simulated using PROC MIXED in SAS with Monte Carlo residuals (SAS Institute, 2005). By assuming that the covariance structure of the data from the nearest time point with complete data is representative of the time points with missing data, we estimated, using a hierarchical regression model, the response as well as the residual variance and covariance between MZ and DZ twins. Monte Carlo residuals were then generated from a bivariate normal distribution with these parameters and added to the predicted values to obtain the simulated values. Sporadic missing values for our PD measures (~0.3% of the data) were imputed singly using SAS PROC MI with a Markov Chain Monte Carlo approach (SAS Institute, 2005).
Our model fitting, performed using the Mx program (Neale et al. Reference Neale, Boker, Xie and Maes2003), began by attempting to discriminate between a correlated factor model, which is non-developmental (Fig. 1a), and causal factor model, which is explicitly developmental in structure (Fig. 1b). The non-developmental correlated factor model postulates that the within- and cross-time correlations between CD and PD are best understood as arising from two correlated latent variables. Importantly, this model contains no causal paths between variables within or across time.

Fig. 1. Three plausible models for the role of additive genetic risk factors (A) on levels of symptoms of conduct disorder (CD) and peer deviance (PD) for the ages of 8–11, 12–14 and 15–17. Identical models could be applied to shared or individual-specific environmental effects. Model 1 a (the correlated factor model) is non-developmental in that it postulates that the within- and cross-time correlations between CD and PD result solely from two correlated latent variables with no causal paths between variables within or across time. By contrast, model 1 b (the casual factor model) also assumes separate latent liabilities to CD and PD but also postulates within-variable cross-time and cross-variable within-time transmission. The direction of this latter path (from CD to PD or vice versa) captures the different predictions of the social selection versus social influence hypotheses. Model 1 c (the simple causal model) is a non-common factor developmental model that assumes that the factors that influence CD and PD at each age period are independent of one another. Like the causal factor model, this model also contains paths for within-variable cross-time and cross-variable within-time transmission. The subscripts CD and PD refer to additive genetic effects specific for conduct disorder or peer deviance respectively.
The causal factor developmental model (Fig. 1b) also assumes separate latent liabilities to CD and PD but postulates within-variable cross-time and cross-variable within-time transmission. It is in the direction of this latter path – from CD to PD or vice versa – that our model captures the predictions of the social selection versus social influence hypotheses. We illustrate this in Fig. 1 for genetic paths, but these models apply equally to shared and individual-specific environmental paths. In addition, we examined the fit of a simple causal model that is also developmental (depicted in Fig. 1c) and assumes that the factors that influence CD and PD at each age period are independent of one another. We expected this model to fit best for individual-specific environmental effects that are often occasion specific in their impact and also include errors of measurement.
In longitudinal studies involving repeated measurements with the same instruments, temporal changes in variance are informative about the underlying developmental process (Eaves et al. Reference Eaves, Long and Heath1986). Path coefficients of the model are standardized so that the phenotypic variance is unity on the first occasion, and variances at subsequent ages are expressed relative to their initial values. Therefore, path coefficients can exceed unity, particularly when variances are increasing over time.
The models examined in this report contain too many nuances to be presented in detail so we provide summary results of the best-fitting version of each general model, and describe in the text the most salient alternative models tested. We used the Bayesian Information Criterion (BIC; Schwarz, Reference Schwarz1978), which performs well with such complex models (Markon & Krueger, Reference Markon and Krueger2004). By minimizing the BIC, we sought to optimize the balance of explanatory power and parsimony.
We used as our baseline model a triple Cholesky decomposition (for A, C and E), which is a saturated model of the observed genetic and environmental variances and covariances. We assessed the goodness of fit of our subsequent models relative to this baseline. We first simplified genetic factors (A), then individual-specific environmental factors (E), and finally shared environmental factors (C). We fitted shared environment last because analyses indicated (see Table 1) that estimates of its effects were known least precisely.
Table 1. Phenotypic, genetic, common and individual-specific environmental within- and cross-time correlations (±s.e.) between peer group deviance (PD) and conduct disorder (CD) for ages 8–11, 12–14 and 15–18Footnote a

a Within-time correlations between CD and PD are depicted in normal font. Cross-time correlations between earlier CD and later PD, as predicted by the social selection hypothesis, are depicted above the diagonal in bold. Cross-time correlations between earlier PD and later CD, as predicted by the social influence hypothesis, are depicted below the diagonal in italics.
b Estimation problems with the standard errors of this correlation.
In model fitting of this complexity, judgment is required in choosing a ‘path’ through the many possible submodels. We minimized the impact of subjective factors on statistical inference through planned comparisons of broad competing hypotheses about the nature and direction of causation.
Results
Correlation matrices
Table 1 depicts four correlation matrices (±s.e.) between CD and PD over the ages 8–11, 12–14 and 15–17. We focus on the cross-time correlations in which prior levels of CD predict future levels of PD (depicted, above the diagonal, in bold) and prior levels of PD predict future levels of CD (depicted, below the diagonal, in italics). In the phenotypic matrix (the leftmost in the table), where we treat the twins as members of an epidemiologic sample, the CD→PD and PD→CD correlations are similar in magnitude. This is the pattern expected if, over time, CD influences PD and PD influences CD to an approximately similar degree.
In the genetic correlation matrix, the CD→PD correlations substantially exceed the parallel PD→CD correlations. For example, the genetic correlation between CD at age 8–11 and PD at age 15–18 (+0.86) is much stronger than the parallel correlation between PD at age 8–11 and CD at age 15–18 (+0.38). These results suggest that the causal pathway for genetic factors is consistent with the social selection hypothesis.
By contrast, in the shared environmental correlation matrix, the PD→CD correlations are substantially greater than the parallel CD→PD correlations. For example, the shared environmental correlation between PD at ages 8–11 and CD at ages 15–18 (+0.88) is much greater than that seen from CD at ages 8–11 and PD at ages 15–18 (+0.18). These results suggest that the causal pathway for shared environmental factors is as predicted by the social causation hypothesis.
Finally, the individual-specific environmental correlations are of lower magnitude than those seen in the other matrices and, like the phenotypic matrices, the CD→PD and PD→CD correlations are similar in magnitude.
Model fitting
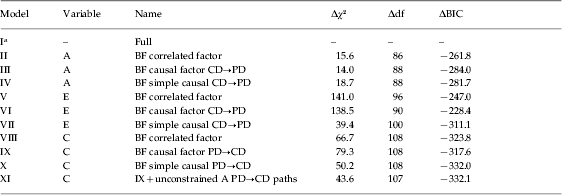
Table 2 summarizes results from the primary models tested. For genetic factors, we assumed causal paths from CD→PD based on the pattern of genetic correlations. As seen in Table 2, the best-fitting model for genetic factors was the causal factor model (model III).
Table 2. Key model fitting results for conduct disorder (CD) and peer group deviance (PD) over ages 8–11, 12–14 and 15–18
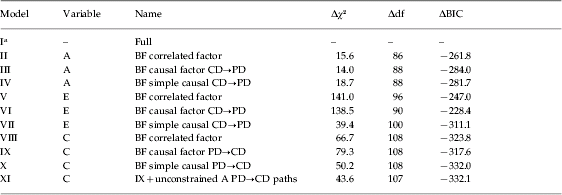
BF, Best fit; A, additive genetic effects; C, shared environment; E, individual-specific environment; df, degrees of freedom; BIC, Bayesian Information Criterion (Schwarz, Reference Schwarz1978).
a Model I has an absolute χ2 value of 305.2, df of 8.788 and a BIC value of −28912.5.
We tried to improve the fit of this model in three ways (not shown in the table). First, we made the causal paths PD→CD instead of CD→PD. Second, we modeled bidirectional causation (i.e. PD↔CD paths). Third, we added cross-lagged paths so that CD at time 1 influenced PD at both times 1 and 2, and CD at time 2 influenced PD at times 2 and 3. None of these additions improved the fit of the model. The model with only PD→CD paths fit moderately worse (ΔBIC=−280.0) than model III, which contained CD→PD paths.
Assuming the best-fit model III for A, we then turned to simplifying the E factors. To allow for errors of measurement, all of our E models contained occasion specific individual environmental effects. The best simple causal model assuming CD→PD paths (model VII) had the lowest BIC by a considerable margin. If we fit the same model but now with PD→CD paths (not shown), the BIC deteriorated by 7.7 units. When we added to model VII cross-lagged paths or bidirectional causation, the BIC value also deteriorated substantially.
For shared environmental factors, we initially assumed causal paths from PD→CD based on patterns of shared environmental correlations observed in Table 1. For C effects, the best-fitting model was the simple causal model (model X). However, while the best fits for the A and E factors were obtained with highly constrained models (that set within-variable cross-time and cross-variable within-time paths to equality), for C constrained models did not fit as well as unconstrained models where these path estimates were allowed to vary. On inspection, model X contained one unusual path coefficient (from PD at 8–11 to PD at 12–15) that was estimated at +1.35. As we knew our data contained a large increase in familial variance for PD over this age period (Kendler et al. Reference Kendler, Jacobson, Gardner, Gillespie, Aggen and Prescott2007), we relaxed the constraint on the parallel path for A to help ‘absorb’ this increase (model XI). This A path increased in value and the parallel C path declined, producing a more sensible model XI (that also had a small improvement in BIC over model IX). If we changed model XI to assume CD→PD causal paths, the BIC deteriorated by 7.7 units. The fit of this model was not improved if we added cross-lagged paths for CD to PD or bidirectional causal paths from CD to PD. We therefore considered model XI to be our overall best-fitting model.
Best-fit model
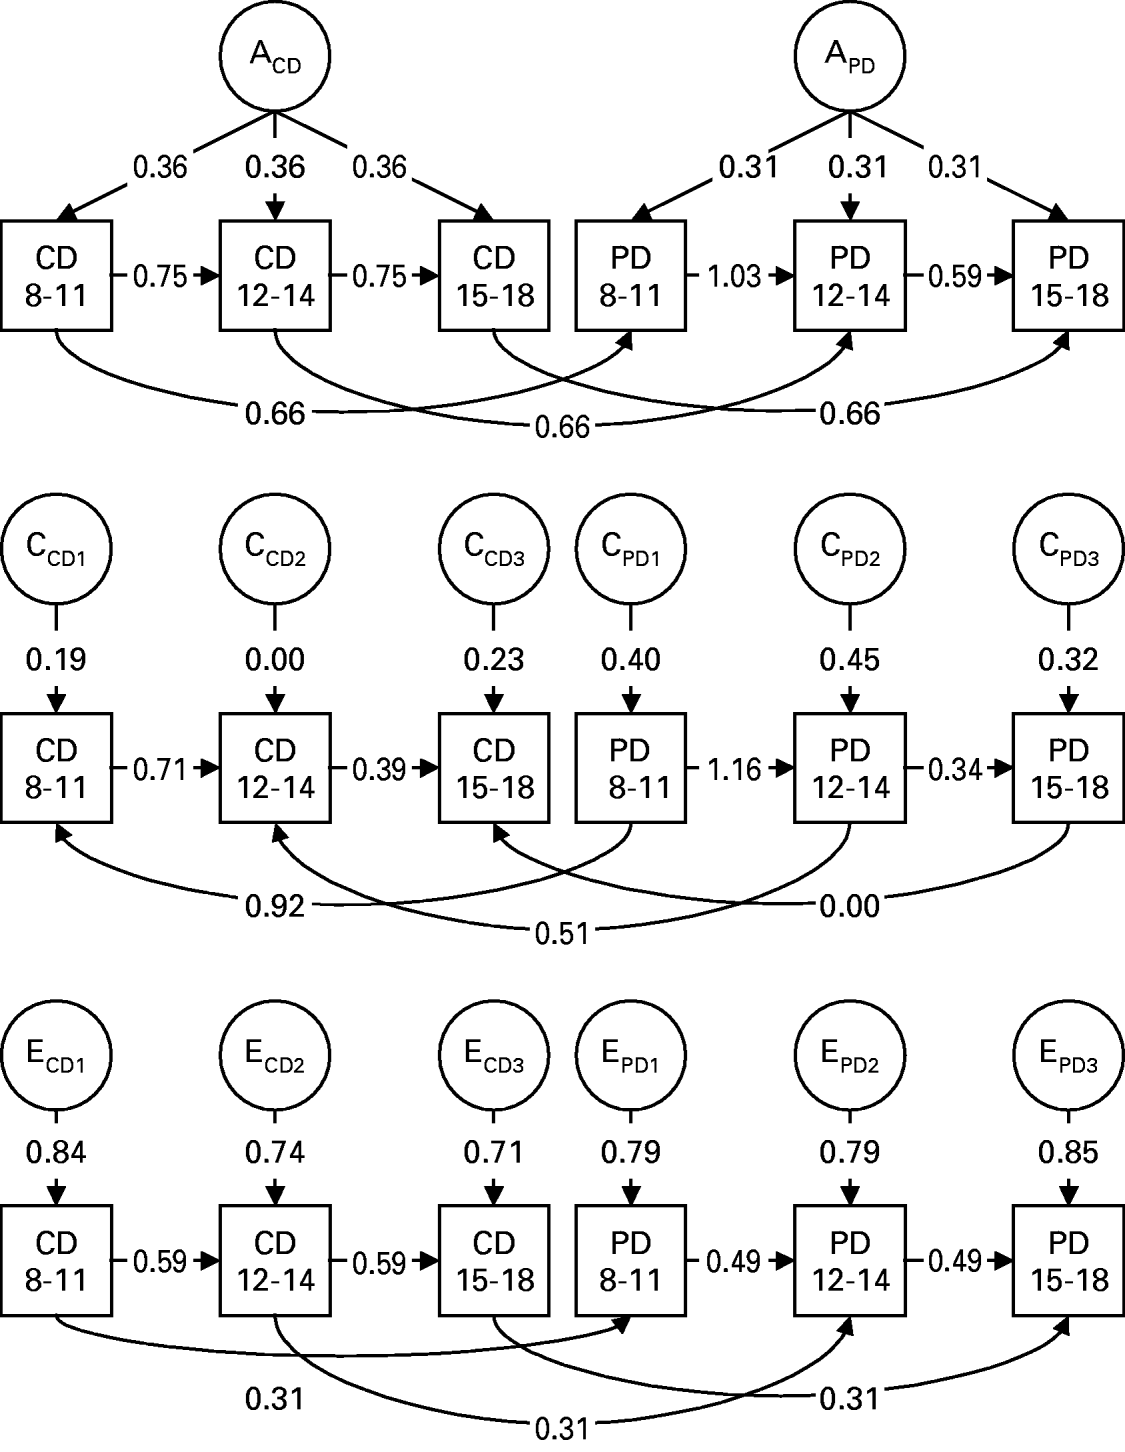
The best-fit model (Fig. 2) had six major features. First, forward transmission of both CD and PD occurred from ages 8–11 to 12–14 and from ages 12–14 to 15–17. That is, levels of CD at one time period had a direct impact on levels of CD at the next time period; in addition, prior levels of deviant behavior in peers directly influences the subsequent degree of peer deviancy. Second, genetic risk factors for CD and PD could be best understood as a single set of common factors with similar impact at each age period. That is, the same genetic factors influence CD over our three developmental periods. Similarly, the genetic effects specific to peer deviance also have a pervasive effect over time. Third, the impact of individual-specific environment (including errors of measurement) could, by contrast, be best modeled as occasion-specific in nature. Fourth, more surprisingly, the influence of the shared environment was also best understood as occasion-specific in its effect. This suggests that the family or community influences on CD and PD are important but change through development. Fifth, the within-time cross-variable causal paths for genetic factors, seen in Fig. 2, are constant over time and go from CD to PD. The same pattern is seen for the individual-specific environment. This is somewhat unexpected given the lack of clear asymmetry in the cross-lagged correlations for individual-specific environmental factors seen in Table 1. Sixth, by contrast, the within-time cross-variable causal paths for shared environmental factors, as seen in Fig. 2, go from PD to CD and decline sharply in magnitude over time.
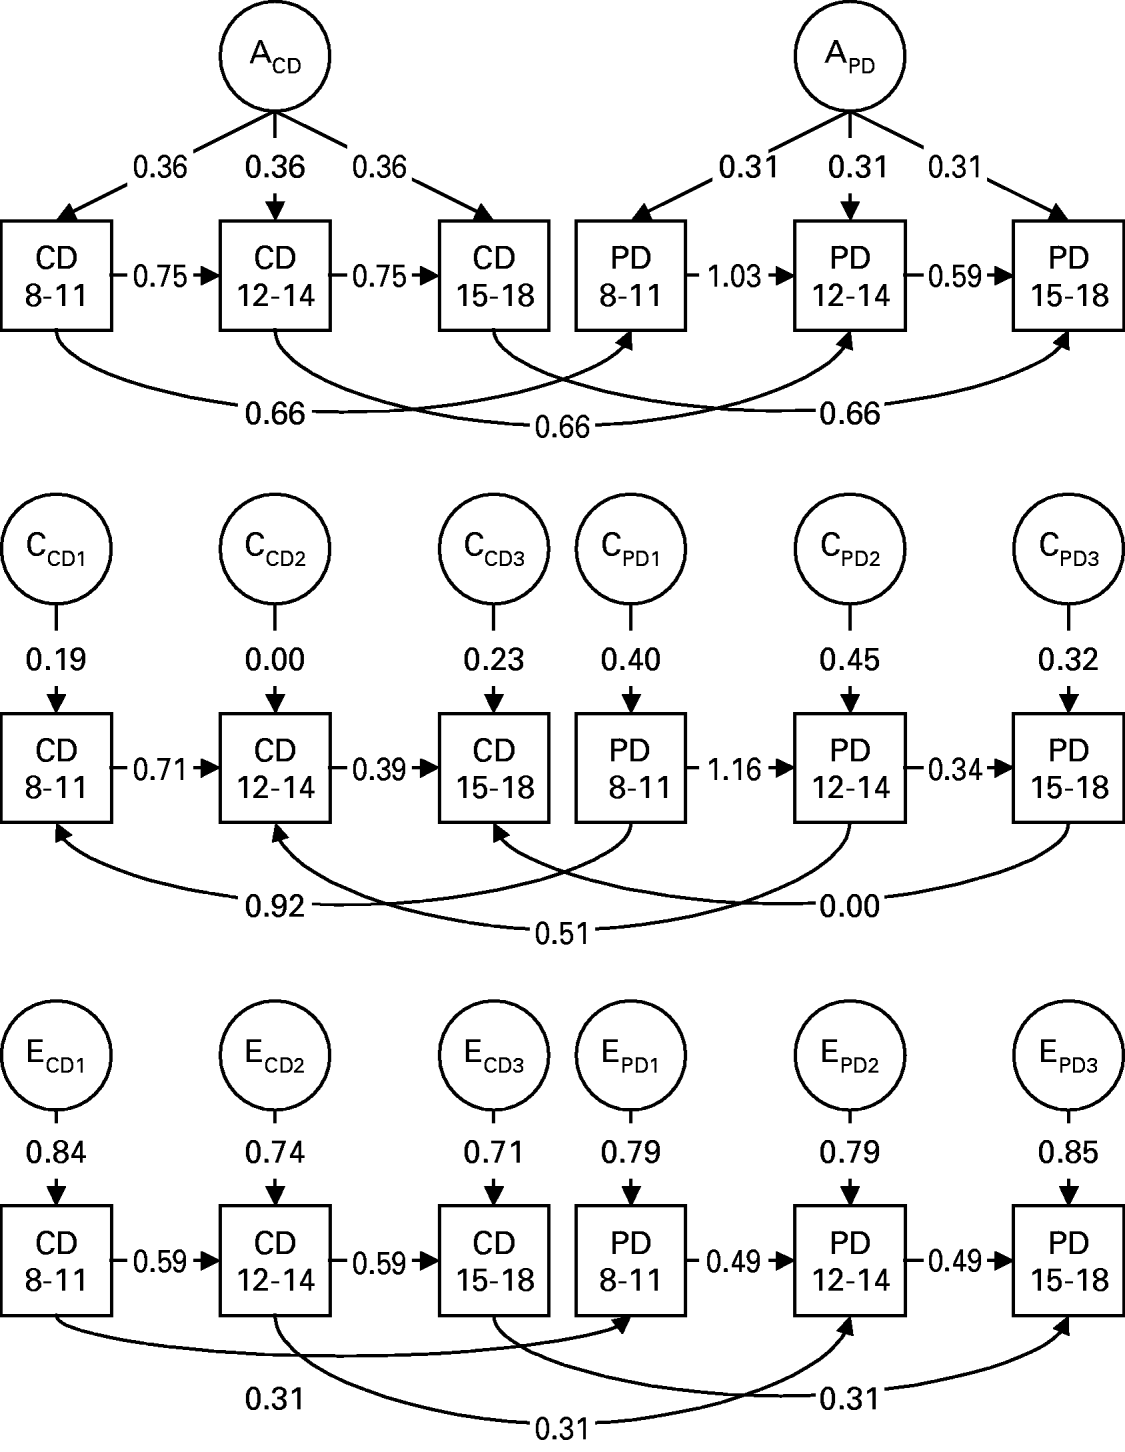
Fig. 2. Parameter estimates for the best-fit model XI (see Table 2) elucidating the impact of additive genetic effects (A), shared or common environmental factors (C) and individual-specific environmental effects (E) on levels of symptoms of conduct disorder (CD) and peer deviance (PD) for the ages of 8–11, 12–14 and 15–17. The subscripts CD and PD refer to genetic or environmental effects specific for conduct disorder or peer deviance respectively, and the subscripts 1, 2 and 3 refer to factors specific to the three age periods: 8–11, 12–14 and 15–17.
Sources of liability to CD and PD estimated from the best-fit model
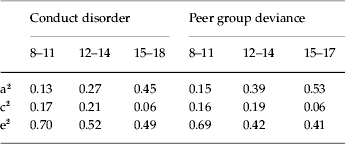
Estimates for a2, c2 and e2 for CD and PD at ages 8–11, 12–14 and 15–18 obtained from the best-fit model XI are shown in Table 3. Heritability increases over time for both phenotypes, somewhat more quickly for PD than for CD. This is expected because PD is influenced by the accumulating effects from the genetic factor for PD (APD) and indirectly by the genetic factor for CD (ACD). For both CD and PD, shared environmental effects are modest at ages 8–11, increase slightly at ages 12–14 and then decrease substantially by ages 15–18.
Table 3. Parameter estimates for conduct disorder and peer group deviance at ages 8–11, 12–14 and 15–18 from the best-fit model
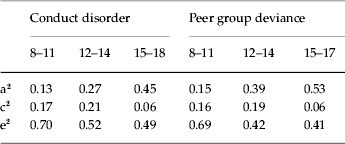
a2, Additive genetic effects; c2, shared environmental effects; e2, individual-specific environmental effects.
Discussion
Our analyses sought to clarify the developmental relationship between CD, a measure of individual-level deviant behavior, and PD, a measure of the deviance in the peer network. Prior studies have reported evidence for causal pathways both from individual to peer deviancy through social selection (Kandel, Reference Kandel1996; Gordon et al. Reference Gordon, Lahey, Kawai, Loeber, Stouthamer-Loeber and Farrington2004; Lacourse et al. Reference Lacourse, Nagin, Vitaro, Cote, Arseneault and Tremblay2006) and from peer to individual deviancy through social influence (Kandel, Reference Kandel1996; Wills & Cleary, Reference Wills and Cleary1999; Gordon et al. Reference Gordon, Lahey, Kawai, Loeber, Stouthamer-Loeber and Farrington2004). Would a genetically informative longitudinal design help us to clarify the causal processes involved?
Of the numerous results of our analyses, three are of particular developmental salience. First, our data were better explained by an active developmental model than by a static common factor model. CD and PD are dynamically interacting with themselves and each other over time. Second, the causal relationship between CD and PD differed strongly between the two sources of familial resemblance: genes and shared (or common) environment. Genetic factors impacted on levels of CD, which, in turn, through social selection, altered levels of PD. Shared environmental factors acting on PD through social influence impacted on levels of CD. When we examined our twins as an epidemiologic sample (phenotype analyses; Table 1), we observed a blending of these two mechanisms. Without using a genetically informative design, it is unclear how these distinct causal processes could be disentangled. Third, the time course of the genetic and shared environment influences on the CD–PD relationship differed substantially. While the genetically driven influence of CD on PD was constant over time, the impact of shared environment on CD mediated through PD, very strong in later childhood, declined dramatically over subsequent age periods.
What are the processes involved in the bidirectional causal relationships between CD and PD uncovered in our analyses? For the CD to PD pathway, the answer seems clear. In accord with other studies (e.g. Jacobson et al. Reference Jacobson, Prescott and Kendler2000; Gelhorn et al. Reference Gelhorn, Stallings, Young, Corley, Rhee and Hewitt2005), we find evidence for genetic influences on CD. Through processes alternatively termed assortative friendship (Rose, Reference Rose, Pulkkinen and Caspi2002), social selection (Patterson et al. Reference Patterson, Dishion and Yoerger2000) or the ‘shopping model’ (Dishion et al. Reference Dishion, Patterson, Griesler and Huesmann1994), individuals prone to deviant behavior actively seek out individuals who share and positively reinforce their own values, perspectives and favored activities. Our finding that a single set of genetic factors influenced CD, and, indirectly, PD, is also consistent with the concept of ‘deviance-proneness’, which suggests that disinhibited personality traits that are stable over the life course play an important role in externalizing and substance use behaviors throughout development (Krueger et al. Reference Krueger, Hicks, Patrick, Carlson, Iacono and McGue2002).
What might constitute the shared environmental influences on PD that in childhood and early adolescence can have strong causal impacts on CD? Other twin studies (Iervolino et al. Reference Iervolino, Pike, Manke, Reiss, Hetherington and Plomin2002; Walden et al. Reference Walden, McGue, Iacono, Burt and Elkins2004) and our own prior analyses in this sample (Kendler et al. Reference Kendler, Jacobson, Gardner, Gillespie, Aggen and Prescott2007) suggest important shared environmental risks for PD. These influences most probably exist at multiple levels, two of which, neighborhood and family, are likely to be of particular importance. Neighborhoods are important because antisocial boys typically find close friends within their own block (Dishion et al. Reference Dishion, Andrews and Crosby1995). Neighborhoods differ widely in their ‘collective efficacy’, their level of social cohesion and tolerance of adolescent deviance (Sampson et al. Reference Sampson, Raudenbush and Earls1997). Other neighborhood-level factors of importance would include poverty levels and quality of schooling (Hawkins et al. Reference Hawkins, Herrenkohl, Farrington, Brewer, Catalano, Harachi, Loeber and Farrington1998; Petraitis et al. Reference Petraitis, Flay, Miller, Torpy and Greiner1998). At the family level, factors likely to impact on PD directly (and thereby on CD indirectly) would include parental monitoring, family religious involvement and family support for prosocial teen activities (Steinberg et al. Reference Steinberg, Fletcher and Darling1994; Kandel, Reference Kandel1996; Hawkins et al. Reference Hawkins, Herrenkohl, Farrington, Brewer, Catalano, Harachi, Loeber and Farrington1998; Petraitis et al. Reference Petraitis, Flay, Miller, Torpy and Greiner1998; Ary et al. Reference Ary, Duncan, Duncan and Hops1999; Walden et al. Reference Walden, McGue, Iacono, Burt and Elkins2004).
Although our data are insufficiently fine-grained to provide insight into the specific mechanism by which contact with deviant peers influences CD, much work in this area has been carried out by Patterson and colleagues, focusing on what they term ‘deviancy training’ (Patterson et al. Reference Patterson, Dishion and Yoerger2000; Dishion et al. Reference Dishion, Bullock and Granic2002). While sociological theorists have suggested that deviant peers act largely at a cognitive level by influencing beliefs and values (termed ‘social modeling’; Allen et al. Reference Allen, Donohue, Griffin, Ryan and Turner2003), Patterson et al. (Reference Patterson, Dishion and Yoerger2000) suggest that the causal mechanism is rates of positive reinforcement for deviant behaviors provided by interactions with peers.
Our findings of greater causal effect of PD on CD at younger ages is consistent with models that predict that early association with deviant peers may be particularly potent at influencing the trajectory of future externalizing behaviors (Steinberg et al. Reference Steinberg, Fletcher and Darling1994; Wills & Dishion, Reference Wills and Dishion2004). Our results have direct relevance for intervention efforts in suggesting that alterations in levels of peer deviance, especially before age 15, can be expected to have a significant impact on levels of CD.
Of note, both shared and non-shared environmental influences on CD and PD are almost entirely age specific. This also has significance for intervention and prevention efforts, as it suggests that different environmental characteristics operate as risk and protective factors at varying developmental periods.
Sources of variation in CD and PD
Our results (Table 3) revealed a linear increase in the heritability of CD across adolescence and a non-linear decrease in the relative importance of shared environmental effects. This pattern is consistent with a developmental behavioral genetic perspective that predicts an increase in heritability with age as individuals create their own environments based in part on their genetic tendencies (Scarr & McCartney, Reference Scarr and McCartney1983). Estimates from this study are similar to those obtained using a previous wave of data from this same sample (Jacobson et al. Reference Jacobson, Prescott and Kendler2002) and are consistent with a recent meta-analysis showing significant increases in heritability for externalizing behavior from early adolescence to early adulthood (Bergen et al. Reference Bergen, Gardner and Kendler2007). This has not been seen as clearly in prior studies specifically of CD, although most such studies have focused on earlier time periods in childhood (e.g. Eley et al. Reference Eley, Lichtenstein and Moffitt2003; Bartels et al. Reference Bartels, van den Oord, Hudziak, Rietveld, van Beijsterveldt and Boomsma2004), where estimates of heritability tend to be stable or decline slightly.
In our sample, patterns of change in the relative importance of genetic and environmental influences on PD, as well as actual parameter estimates, are similar to those observed for CD. Furthermore, these estimates are broadly similar to those reported in a previous study in the same sample focusing solely on PD (Kendler et al. Reference Kendler, Jacobson, Gardner, Gillespie, Aggen and Prescott2007). As reviewed above, studies of genetic and environmental influence on PD are scarce, inconsistent and largely cross-sectional. Thus, it remains to be determined whether the developmental pattern we observed for PD is seen in other samples.
Limitations
The results of this report should be interpreted in the context of five potential methodological limitations. First, the sample was restricted to white males born in Virginia. These results may or may not extrapolate to women or other ethnic groups. Second, the greater resemblance for PD in MZ versus DZ twins could arise because, due to social expectations, MZ twins share more of their social network than do DZ twins. We have examined this question elsewhere (Kendler et al. Reference Kendler, Jacobson, Gardner, Gillespie, Aggen and Prescott2007) and shown that the broad pattern of results does not change when taking into account the tendency for MZ twins to co-socialize more frequently than DZ twins.
Third, given that not all eligible twins participated in this study, could our findings be unrepresentative? Using data from prior interviews, participation in this study was significantly predicted by educational status but not by age, cannabis use, cannabis abuse/dependence or number of DSM-IV adult antisocial symptoms. With respect to the externalizing symptoms strongly predicted by CD and PD, this sample is likely to be broadly representative of the original twin cohort.
Fourth, while our best-fit model indicated that all of the causal aspects of genetic factors flowed from CD to PD and a model containing bidirectional paths from CD to PD did not improve the fit, it is likely that a modest causal path existed for genetic factors going from PD to CD that we were unable to detect due to limited power.
Fifth, because information on CD and PD was collected retrospectively from adults, our findings could result from recall bias (Kandel, Reference Kandel1996). We consider this unlikely for three reasons: (1) our measures of CD and PD had good to excellent test–retest reliability; (2) it is difficult to construct a plausible pattern of recall bias that would produce evidence for causal CD→PD genetic paths and causal PD→CD shared environmental effects; and (3) we obtained our data using a life history calendar, which, by reflecting the structure of autobiographical memory and promoting sequential retrieval within memory networks, substantially improves the completeness and accuracy of retrospective recall (Freedman et al. Reference Freedman, Thornton, Camburn, Alwin and Young-DeMarco1988; Belli, Reference Belli1998; Yoshihama et al. Reference Yoshihama, Clum, Crampton and Gillespie2002).
Implications
Our ability to understand and intervene successfully in the development of externalizing behaviors requires us to understand causal pathways, a difficult goal in non-experimental designs. The present study demonstrates the potential value of genetically informative strategies to clarify important developmental processes. The next challenge will be to expand these analyses to include the key externalizing outcomes in young adulthood, including antisocial behaviors and drug abuse, that we know from this (Jacobson et al. Reference Jacobson, Prescott and Kendler2002; Kendler et al. Reference Kendler, Jacobson, Gardner, Gillespie, Aggen and Prescott2007) and other samples (Hawkins et al. Reference Hawkins, Herrenkohl, Farrington, Brewer, Catalano, Harachi, Loeber and Farrington1998; Petraitis et al. Reference Petraitis, Flay, Miller, Torpy and Greiner1998) are predicted by levels of CD and PD in childhood and adolescence.
Acknowledgments
This work was supported in part by grant DA-011287 from the US National Institutes of Health.
Declaration of Interest
None.


