


INTRODUCTION
Numerous studies have suggested significant changes of the East Asian monsoon (EAM) in the past on millennial to orbital timescales (An et al., Reference An, Porter, Kutzbach, Wu, Wang, Liu, Li and Zhou2000, Reference An, Wu, Li, Sun, Liu, Zhou and Cai2015; Wang et al., Reference Wang, Wang, Cheng, Fasullo, Guo, Kiefer and Liu2014) based on a range of different climate indicators or proxies, such as stalagmites (Wang et al., Reference Wang, Cheng, Edwards, An, Wu, Shen and Dorale2001, Reference Wang, Cheng, Edwards, He, Kong, An, Wu, Kelly, Dykoski and Li2005; Dykoski et al., Reference Dykoski, Edwards, Cheng, Yuan, Cai, Zhang, Lin, Qing, An and Revenaugh2005; Liu et al., Reference Liu, Wen, Brady, Otto-Bliesner, Yu, Lue and Cheng2014; Cheng et al., Reference Cheng, Edwards, Sinha, Spötl, Yi, Chen and Kelly2016), sandland profiles (Liu et al., Reference Liu, Xu and Cui2002; Yin et al., Reference Yin, Liu and Hao2015), peatland sediments (Xing et al., Reference Xing, Bao, Guo, Lu and Wang2015), and lake sediments (Chen et al., Reference Chen, Xu, Chen, Birks, Liu, Zhang and Jin2015; Goldsmith et al., Reference Goldsmith, Broeckera, Xu, Polissara, deMenocal, Porat, Lan, Cheng, Zhou and An2017). In addition, direct and robust evidence of hydrological changes can be obtained from lake-status records (e.g., Street-Perrott et al., Reference Street-Perrott, Marchand and Roberts1989; Harrison and Digerfeldt, Reference Harrison and Digerfeldt1993; Harrison et al., Reference Harrison, Yu and Tarasov1996). Such records have become a major proxy for past precipitation reconstruction (e.g., Yu and Harrison, Reference Yu and Harrison1995; Qin and Yu, Reference Qin and Yu1998), contributing to estimates of past atmospheric circulation and hydrological changes associated with the EAM, for instance, a northward expansion of the EAM in the mid-Holocene (ca. 6 ka; e.g., An et al., Reference An, Porter, Kutzbach, Wu, Wang, Liu, Li and Zhou2000; Cheng et al., Reference Cheng, Edwards, Sinha, Spötl, Yi, Chen and Kelly2016; Goldsmith et al., Reference Goldsmith, Broeckera, Xu, Polissara, deMenocal, Porat, Lan, Cheng, Zhou and An2017).
The EAM northern fringe at 6 ka was once reconstructed by an approach that adopted archives of several lakes or even a single lake to estimate limits of precipitation fields in all of northern China (e.g., Goldsmith et al., Reference Goldsmith, Broeckera, Xu, Polissara, deMenocal, Porat, Lan, Cheng, Zhou and An2017). Judging from spatial point data, however, there is still uncertainty in the magnitude and extent of past EAM precipitation. In addition, simulations of paleoclimate changes were performed that describe changes in the extent of the EAM in the mid-Holocene (Braconnot et al., Reference Braconnot, Otto-Bliesner, Harrison, Joussaume, Peterchmitt, Abe-Ouchi and Crucifix2007; Harrison et al., Reference Harrison, Bartlein, Brewer, Prentice, Boyd, Hessler, Holmgren, Izumi and Willis2014, Reference Harrison, Bartlein, Izumi, Li, Annan, Hargreaves, Braconnot and Kageyama2015; Goldsmith et al., Reference Goldsmith, Broeckera, Xu, Polissara, deMenocal, Porat, Lan, Cheng, Zhou and An2017). However, those simulations produce a variety of inconsistent or antagonistic EAM migration patterns, including either a large northward expansion or a great southward retreat (Braconnot et al., Reference Braconnot, Otto-Bliesner, Harrison, Joussaume, Peterchmitt, Abe-Ouchi and Crucifix2007; Harrison et al., Reference Harrison, Bartlein, Brewer, Prentice, Boyd, Hessler, Holmgren, Izumi and Willis2014, Reference Harrison, Bartlein, Izumi, Li, Annan, Hargreaves, Braconnot and Kageyama2015; Liu et al., Reference Liu, Wen, Brady, Otto-Bliesner, Yu, Lue and Cheng2014; Goldsmith et al., Reference Goldsmith, Broeckera, Xu, Polissara, deMenocal, Porat, Lan, Cheng, Zhou and An2017). In the Paleoclimate Modelling Intercomparison Project Phase III simulations (http://pmip3.lsce.ipsl.fr/) or the National Center for Atmospheric Research general circulation model (http://www.cesm.ucar.edu/experiments/cesm1.0 /#paleo), for instance, the northern fringe of the EAM at 6 ka was simulated to lie along a north–south band (31.65–52.27°N latitude) across China, Mongolia, and Russia (Goldsmith et al., Reference Goldsmith, Broeckera, Xu, Polissara, deMenocal, Porat, Lan, Cheng, Zhou and An2017). The aforementioned two approaches therefore reflected substantial uncertainties in estimating the magnitude and extent of past EAM precipitation.
Quantitative estimates of past precipitation at lake sites were conventionally made by the lake hydrological models. One typical model is a lake hydrological and energy budget model by Kutzbach (Reference Kutzbach1980), in which precipitation is determined by the combined hydrological and energy balances of a lake and its closed basin. The model has been used to reconstruct paleoprecipitation for many closed-basin lakes in Chad (Kutzbach, Reference Kutzbach1980; Hastenrath and Kutzbach, Reference Hastenrath and Kutzbach1983), India (Swain et al., Reference Swain, Kutzbach and Hastenrath1983), midwestern USA (Winkler, Reference Winkler, Swain and Kutzbach1986), and China (Li, Reference Li1992; Yu et al., Reference Yu, Harrison and Xue2001a; Wu et al., Reference Wu, Liu and Wang2004). However, the hydrological and energy-balance model was used to reconstruct past precipitation based on single lake records by estimating the lake and basin areas in the period 10 ka to 5 ka (Kutzbach, Reference Kutzbach1980). Therefore, it is not possible to directly use Kutzbach's model to estimate the extent of the EAM precipitation in northern China at 6 ka. Additionally, it is difficult to exclude factors like non-climatic lake-level changes at some lake sites, or to distinguish non-precipitation–controlled lake-level records (e.g., by snow/ice-melt input from adjacent mountains) from precipitation-controlled records in the reconstructions of lake level for a single lake (Liu et al., Reference Liu, Chen, Chen, Zhang and Chen2017).
In order to reduce uncertainty in estimates of the limit of the EAM shift, we attempt to study two groups of lakes in a large precipitation area covering roughly six million square kilometers across northern China and to provide direct evidence of hydroclimate changes of the EAM in the mid-Holocene. Our objectives here are to determine original lake levels, transfer them into lake areas, use the hydrological model to simulate precipitation, and compute the changing spatial limits of EAM precipitation.
Here we exploit a comprehensive set of lake-level records and provide an approach for simulating or estimating paleo values of precipitation that we refer to as the “1D lake level—2D lake area—3D catchment hydrology” model, and we apply it across northern China, including northeast China, North China, and northwest China. The aims of this paper are to determine how much the EAM precipitation differed relative to the present, to decipher how the EAM precipitation fields expanded or contracted, and to estimate where the EAM northern limits were in quantitative terms during the mid-Holocene.
DATA AND METHODS
Lake data and compilation
Forty-five lake records were derived from two public databases: the Chinese Lake Status Data Base (CLSDB; Yu et al., Reference Yu, Harrison and Xue2001a; Xue et al., Reference Xue, Yu and Zhang2017) and the Former Soviet Union and Mongolia Lake Status Data Base (Tarasov et al., Reference Tarasov, Pushenko, Harrison, Saarse, Andreev, Aleshinskaya and Davydova1996). From these databases, records from 18 lakes in China were chosen for modeling. These two databases provide data on long-term changes of lake status, a surrogate measure for relative water depth or lake level from closed or overflowing lakes during the late Quaternary (Harrison et al., Reference Harrison, Yu and Tarasov1996; Yu et al., Reference Yu, Harrison and Xue2001a; Xue et al., Reference Xue, Yu and Zhang2017). The primary sources of information used to reconstruct status changes in lakes from these two databases are changes in the nature of the lake bottom sediments (e.g., lithology, grain size, organic content, the position of the sediment limit, and chemical composition) and sedimentary structure (e.g., presence or absence of laminations, reworked sediments, sedimentary hiatuses) (Street-Perrott et al., Reference Street-Perrott, Marchand and Roberts1989; Harrison and Digerfeldt, Reference Harrison and Digerfeldt1993). Paleoecological evidence (e.g., changes in aquatic pollen and/or macrofossils, diatoms, algae, mosses, cladocera, ostracodes, and mollusk assemblages) of changes in water depth are also available for lakes in China (Yu et al., Reference Yu, Harrison and Xue2001a). Moreover, information on absolute changes in depth and/or level can be obtained from changes in the position of the geomorphological evidence (e.g., paleoshorelines or terraces above the modern level of the lake). In these databases, the reconstruction of lake-status changes at every site is based on a consensus interpretation of a minimum of two lines of evidence, such as sedimentary changes of lacustrine facies and changes of aquatic plant assemblages, following Harrison et al. (Reference Harrison, Yu and Tarasov1996).
For each lake record, we use a coding technique for semi-quantification of lake levels (e.g., Street-Perrott et al., Reference Street-Perrott, Marchand and Roberts1989; Yu and Harrison Reference Yu and Harrison1995; Harrison et al., Reference Harrison, Yu and Tarasov1996). A sedimentary hiatus is coded as class 0, the lowest water level is class 1, and then successively higher water levels are coded as classes 2, 3, 4 …, N (the maximum lake level and/or water depth). At some lakes, it is possible to derive a range of detailed depth records (e.g., with up to seven different status classes), while at other lakes the information is barely sufficient to distinguish intervals when lake levels are either higher or lower than present. The lake-status classes can be standardized for comparisons among lakes and for mapping purposes. Thus, an alternative scheme can be used in which the lake-status classes are defined as low, intermediate, or high. The class “high” or “low” corresponds to the upper or lower quartile of the lake's variation in depth or level during the entire record period (Harrison et al., Reference Harrison, Yu and Tarasov1996). This definition is adopted to ensure compatibility with the codings used in the CLSDB and its updated version (Yu et al., Reference Yu, Harrison and Xue2001a; Xue et al., Reference Xue, Yu and Zhang2017).
The chronology of changes in lake status at individual sites from the databases is based upon radiocarbon dating (both conventional and accelerator mass spectrometry), thermoluminescence, and optically stimulated luminescence dating. For the purposes of integrating the data and defining the precision of the information in the CLSDB, we organized a database workshop, invited more than 40 Quaternary experts who were main contributors to the first version of the CLSDB, and validated the dates (Yu et al., Reference Yu, Xue and Harrison1999). In recent years, the CLSDB has been updated to a second version, the Late Quaternary Chinese Lake Data Base (Xue et al., Reference Xue, Yu and Zhang2017). Radiocarbon ages (14C yr BP) in all the records (old and new versions) have been calibrated to calendar years (Reimer and Reimer, Reference Reimer and Reimer2013). Also, old carbon effects have been corrected. The ages were obtained from sediment samples in the mid-Holocene layer from lake profiles and from cores of lake bottoms. Because the dating methods have varied over time and because there are errors, to some extent, in the dating precision, the databases contain information that describes the quality of the dating control and the reliability of the dating method according to Webb (Reference Webb1985). For each site, a 500-yr interval is defined as a basic time unit to estimate the relative lake level or depth.
The lake records have been screened to meet standards of dating control and high consistency among different climatic indicators. The lakes chosen for inclusion have also been screened to rule out records influenced by non-climate factors, such as neotectonism, earthquakes, hydroseral development, changes in the fluvial network or human impact, or where the climatic impact is mediated by sea-level changes or glaciers. However, it seems unlikely to thoroughly avoid some instances of a lake experiencing a period of non-climate impact, such as ice-melt input or mud-flow input. Previous literature has suggested that long-term trends in lake status for many sites show a clear response to changes in climate over time (Street-Perrott et al., Reference Street-Perrott, Marchand and Roberts1989; Harrison et al., Reference Harrison, Yu and Tarasov1996; Xue et al., Reference Xue, Yu and Zhang2017). Therefore, to mitigate non-climate impacts, we investigated the lake status of two groups of lakes and then examined the patterns of regional precipitation changes through the Holocene. We plotted histograms of lake-level changes for the eastern group (19 lakes) and western group (26 lakes) since the last glacial maximum (21 ka; Fig. 1). The eastern group in the EAM precipitation region, where annual precipitation is higher than 200–400 mm/yr, is classed as the Asian humid monsoonal zone. In contrast, the western group in the Asian inland region, where annual precipitation is lower than 200 mm/yr, is classed as the Asian arid inland zone. Particularly at 6–8 ka, the frequency of high and intermediate lake levels is approximately 80–100% in the eastern group (Fig. 1A) and 70–100% in the western group (Fig. 1B). The geographical map and localities for 45 lakes are shown in Figure 1C.

Figure 1. Histograms of 45 lake-level changes and a map showing locations of lakes. (A) Annual precipitation >200–400 mm/yr of the East Asian monsoon precipitation domain (the eastern group, red dots in Fig 1C: 35–55°N and 100–135°E). (B) Annual precipitation <200 mm/yr of Asian inland region (the western group, blue circles in Fig 1C: 35–55°N and 75–110°E). (C) A map showing locations of studied lakes. (For interpretation of the references to color in this figure legend, the reader is referred to the web version of this article.)
Lake sites for modeling
The 18 lake sites selected for modeling (Table 1) were extracted from the above 45 lakes, and all data are derived from the CLSDB (Yu et al., Reference Yu, Harrison and Xue2001a) and its updated version (Xue et al., Reference Xue, Yu and Zhang2017). Most of these lakes lie both in the modern EAM precipitation domain (35–54°N) and in potential zones of the Holocene monsoon expansion. For the continental-scale mapping purpose, other lakes were selected from the same latitudinal zone of northwest China (Fig. 2). For climate reconstruction at 6 ka, we use the above lake-status records with ages between 5.5 and 6.5 ka for the mid-Holocene (Yu et al., Reference Yu, Harrison and Xue2001a; Reimer and Reimer, Reference Reimer and Reimer2013).

Figure 2. Schematic map of the lake locations for simulations (red dots) used in this study. Yellow dotted line denotes 400-mm isohyet, blue circle denotes the location of Dongge Cave (29.28°N and 108.08°E), red circle is Lake Dalainuoer (43.33°N and 116.62°E), frame 1 (black dashed line) denotes Hunshandak Sandland (40–44°N and 112–118°E), and frame 2 denotes Khingan Mountain peatland (42–54°N and 116–125°E). (For interpretation of the references to color in this figure legend, the reader is referred to the web version of this article.)
Table 1. Information on paleolake reconstructions in the present study.

Lake areas in the mid−Holocene were measured on individual digital maps based on the reconstructed paleolake elevation and associated surrounding shorelines. Three typical lakes—Dalainuoer Lake (Li et al., Reference Li, Zheng and Zhu1990), Daihai Lake (Wang et al., Reference Wang, Wu and Jiang1990), and Aibi Lake (Wu et al., Reference Wu, Wang and Wang1993)—were investigated, and the paleoshorelines for the Holocene were plotted. We digitized the maps and measured the areas of the three lakes. Paleoshorelines of the other 15 lakes are based upon reconstructions of the paleolake elevations, and these shorelines were plotted according to the reconstructed shoreline elevations in digital elevation models at a resolution of 50−500 m (Xue, Reference Xue2001; Zhang, Reference Zhang2014).
Modern climatology
The modern climate in mainland China (15–55°N, 74–135°E) depends on the interplay of Indian monsoon (southwest Asian monsoon) and Pacific monsoon (EAM) circulations. The EAM associated with the Pacific subtropical anticyclone brings warm and moist marine air masses from the western Pacific Ocean to eastern China as far as about 50°N, while the Indian monsoon circulation advects moist marine air from the Indian Ocean to southern Tibet and southern China (Editorial Committee of Physical Geography in China of Chinese Academy Sciences, 1985).
The intensity and range of the EAM influences regional temperatures and precipitation patterns across China. The EAM penetration today brings abundant precipitation, the amount of which ranges from 1800 mm/yr in the south to 300 mm/yr in the west (Fig. 3A). In particular, the 400-mm isohyet along the Khingan Mountains–the eastern Mongolian Plateau–the Loess Plateau–the central Tibetan Plateau (see yellow dotted line in Fig. 2), forms a division between the arid zone and the humid zone (Sheng, Reference Sheng1986). In the eastern region (annual precipitation higher than 400 mm/yr), climate in northeast China and the North China Plain is dominated by the EAM, with high summer precipitation (see Fig. 3B), and the annual precipitation increases southeastward from 400 mm/yr to >1500 mm/yr. In the northwestern region (annual precipitation less than 400 mm/yr), climate in the western slope of the Khingan Mountains, the Mongolian Plateau, and the central Tibetan Plateau is dominated by continental westerly winds in summer but is not affected by the Pacific or Indian monsoon. As a result, annual precipitation declines northwestward from about 400 mm/yr to less than 100 mm/yr (see Fig. 3A).

Figure 3. (color online) Precipitation patterns (1955–2005) from the 734 meteorology stations of China. (A) Isohyet map of 50-yr mean annual precipitation (mm/yr). (B) Isohyet map of 50-yr mean summer half-year precipitation (May, June, July, August, and September months) as a percentage of the whole-year mean annual precipitation. Lake names 1–18 are listed in Table 1.
Lakes close to the 400-mm isohyet (see Fig. 3A) are sensitive to subtle precipitation fluctuations that are controlled by the intensity and magnitude of the EAM in the present (Sheng, Reference Sheng1986; Ding and Chan, Reference Ding and Chan2005) and the past (Harrison et al., Reference Harrison, Yu and Tarasov1996; Goldsmith et al., Reference Goldsmith, Broeckera, Xu, Polissara, deMenocal, Porat, Lan, Cheng, Zhou and An2017). Across northern China, the precipitation from May to September account for 58–99% of annual precipitation (see Fig. 3B). Also, the 18 lake basins in this study reveal a concentrated precipitation pattern in the summer half year based on data (1955–2005) from 734 meteorological stations (Climate Center of National Meteorology Bureau of China, 2007). The meteorological stations are located <50 km from Lakes 1 to 10, 17, and 18, and <200 km from Lakes 11 to 16. The 50-yr mean monthly precipitation for each lake is plotted on Figure 4. The precipitation regimes suggest that precipitation is concentrated in summer in most lake basins owing to impacts of the EAM (see Fig. 4A–C). In contrast, some lake basins in northwest China are also dominated by summer precipitation but are mainly controlled by the westerly circulation (see Fig. 4D–F).
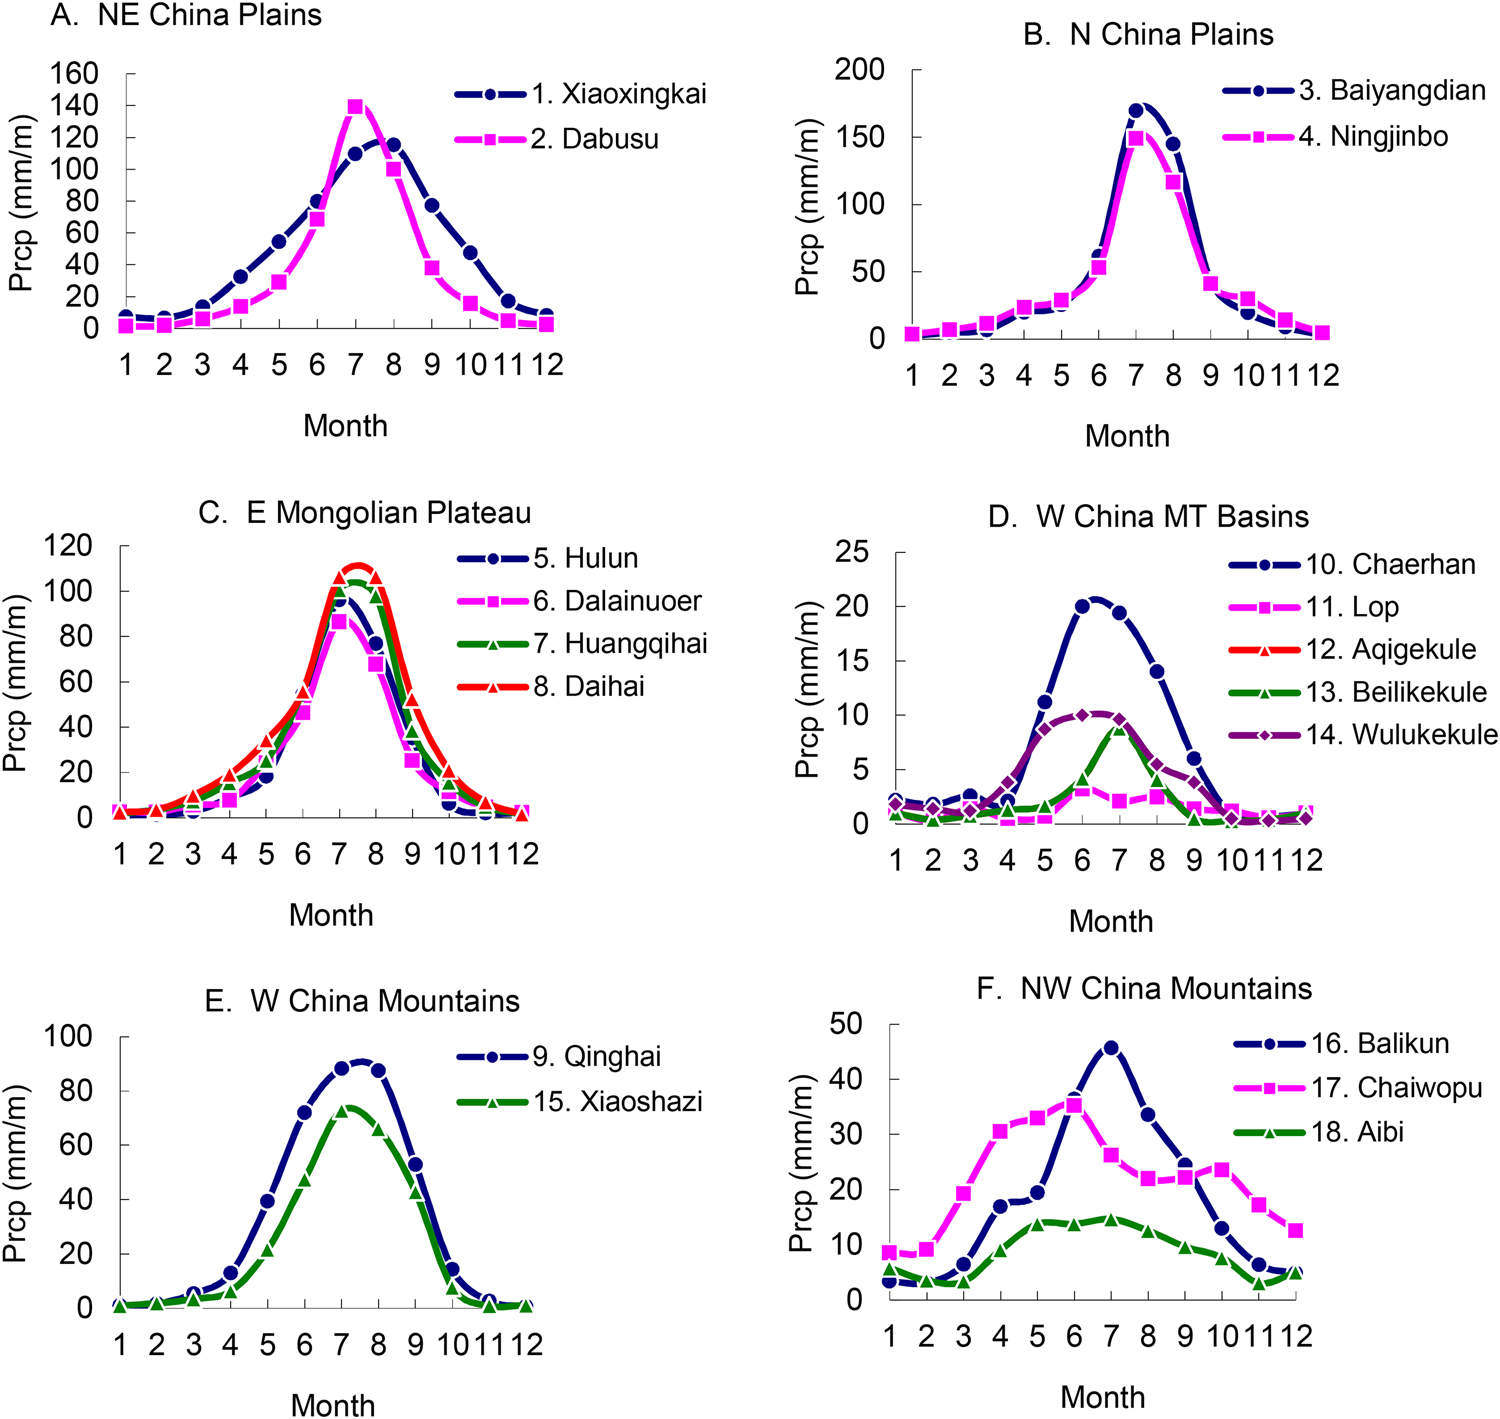
Figure 4. (color online) 50-yr mean monthly precipitation in the 18 lake basins based on meteorology data (1955–2005). Meteorological stations at Lakes 1–10 and 17–18 are <50 km away, and stations at the other lakes are <200 km away. Lake names are listed in Table 1.
Lake hydrological model
Fluctuations in lake level and area occur in response to changes in the moisture balance (precipitation minus evaporation) over the lake and its catchment (Harrison et al., Reference Harrison, Yu and Tarasov1996). Evaporation is strongly influenced by air temperatures, wind velocity, and radiation. Precipitation primarily responds to the general atmospheric circulation and to local factors (e.g., the locations of mountains and oceans). To rule out local factors that may influence individual lake records, multiple lakes covering a wide region were integrated to study regionally synchronous changes in lake behavior and to provide a good indicator of broad-scale climate changes (e.g., Street-Perrott et al., Reference Street-Perrott, Marchand and Roberts1989; Harrison and Digerfeldt, Reference Harrison and Digerfeldt1993; Harrison et al., Reference Harrison, Yu and Tarasov1996; Yu et al., Reference Yu, Harrison and Xue2001a; Xue et al., Reference Xue, Yu and Zhang2017). Furthermore, the past EAM precipitation reconstruction could be achieved on lake hydrological models.
A typical lake hydrological model is based on the water- and energy-balance model by Kutzbach (Reference Kutzbach1980). The original model has been modified into several versions (e.g., Qin and Yu, Reference Qin and Yu1998; Yu et al., Reference Yu, Xue, Liu, Chen and Zheng2001b; Wu et al., Reference Wu, Liu and Wang2004; Goldsmith et al., Reference Goldsmith, Broeckera, Xu, Polissara, deMenocal, Porat, Lan, Cheng, Zhou and An2017), which differ in their prescriptions of parameters and number variables. The water balance for a closed-basin lake is calculated by the equilibrium equation between precipitation and evaporation (Kutzbach, Reference Kutzbach1980), while the equilibrium equation for an overflowing lake is the balance between precipitation and evaporation-discharge (Dingman, Reference Dingman2002).
At steady state for a drainless (closed-basin) lake, precipitation is returned by evaporation from both the lake and its basin. If inputs equal outputs (i.e., precipitation equals evaporation), the equations for hydrological balance can be written as follows (after Kutzbach, Reference Kutzbach1980):


for a lake and its basin, where P is precipitation (which is assumed to be the same for both lake and basin), E1 is lake-surface evaporation, Eb is basin-area evaporation, A1 is lake area, and Ab is basin area.
Evaporation from the basin and lake are calculated based on energy-balance equilibrium using the following equations:


where R is the net radiation fluxes; Rb and R1 are net radiation fluxes for basin and lake, respectively; L is the latent head of vaporization (evaluated as 0.0769 W/m2); Bb and B1 are the basin and lake Bowen ratios, respectively; G is global radiation; α is surface albedo; c is fractional cloud cover; ε is surface emission, 0.96 for land and 0.90 for lake (Swain et al., Reference Swain, Kutzbach and Hastenrath1983); δ is the Stefan-Boltzmann constant (5.67×10⁻⁸ W/m2K−4); and T is surface temperature in Kelvin. Here A is designated as the Angstrom ratio:

where e is vapor pressure in hPa.
In contrast, water budget for an overflowing lake is the balance between precipitation (inputs) and evaporation plus the discharge from a lake and its basin (outputs). Thus, the equation can be written as follows:

where Q, P and E are long-term average values of runoff, precipitation, and evaporation and discharge, respectively. The runoff ratio (w) can be written as follows:

Equation 9 gives the relative change in runoff as a function of the present runoff ratio and the relative changes in P and E for overflowing lakes. The runoff ratio is estimated by runoff coefficient (β) in the modern overflowing lakes:

The β value is an empirical coefficient between 0 and 1. Representative values for β in China are obtained as follows (Editorial Committee of Physical Geography in China of Chinese Academy Sciences, 1985): arid zone, <200 mm/yr, β<0.1; semi-arid region, 200–400 mm/yr, 0.1<β<0.2; semi-humid regions, 400–800 mm/yr, 0.2<β<0.4; humid areas, 800–1600 mm/yr, 0.4<β<0.6; and humid regions >1600 mm/yr, β>0.6. Here we use a β value to estimate the runoff ratio for overflowing lakes of Xiaoxingkai, Baiyangdian, and Hulun based on the modern lake status (Wang, Reference Wang1983; Qiu et al., Reference Qiu, Wang and Wang1988, Reference Qiu, Wang, Li and Wang2007; Wang and Ji, Reference Wang and Ji1995; Li et al., Reference Li, Zhang and Duan2000; Xiao et al., Reference Xiao, Chang, Wen, Zhai, Itoh and Zaur2009; Yang, Wang, et al., Reference Yang, Scuderib, Wang, Scuderi, Zhang, Li and Forman2015).
The hydrological and climatic parameters for lake sites are listed in Table 2. Parameters (α, c, e, and B) are generalized and limited to a few categories for simplicity and consistency (Kutzbach, Reference Kutzbach1980; Li, Reference Li1992; Qin and Yu, Reference Qin and Yu1998; Wu et al., Reference Wu, Liu and Wang2004). Global radiation, G, at present (Sheng, Reference Sheng1986) and at 6 ka was determined using Berger (Reference Berger1978). Vegetation conditions for the lake basins were sourced from the paleolake studies (see Table 1). The parameters have been validated for the studied lake basins (Xue, Reference Xue2001; Zhang, Reference Zhang2014).
Table 2. Hydrological and climatic parameters for lake sites (see text for explanation of parameters).

Running the model requires two input variables: temperature and lake area at 6 ka. Lake-basin temperatures were estimated from paleotemperature proxies (Shi and Kong, Reference Shi and Kong1992; Xue, Reference Xue2001), while lake areas were reconstructed in the present study. We have done a control run for validating the simulated precipitation using the 50-yr mean annual precipitation data from meteorological observations (Climate Center of National Meteorology Bureau of China, 2007). High elevation, mountainous slope and aspect, or other local factors could result in spatial heterogeneity of precipitation, which may exert a tremendous impact on local precipitations in lakes of northern China. Therefore, we calibrated simulated precipitation by multiplying a coefficient derived from modeling error with the modern meteorological observations around lakes, as follows:

where δ is a calibrated coefficient, and Pcali and Pmod are observed precipitation and modeled precipitation, respectively.
Isoline mapping
Simulated precipitation for the 18 lakes at 6 ka is plotted on Figure 5. Precipitation isolines for the 18 lake sites at 0 ka and 6 ka were plotted using a Kriging interpolation method. Distance displacements of a specific isohyet between 6 ka and 0 ka could be grid-calculated on digital maps. In the geographic coordinate system, latitude and longitude as linear units can be used to calculate horizontal distances. One latitudinal second measures 30.92 meters, a latitudinal minute is 1855 meters, and a latitudinal degree is 111.3 kilometers (Tomlin, Reference Tomlin1990). Latitudinal distance in kilometer (Dθ) is the same at any latitude, calculated by the difference of south and north latitudes (θS and θN):


Figure 5. (color online) Magnitude and distribution of annual precipitation (mm/yr), (A) at 6 ka, (B) at 0 ka, and (C) at 6–0 ka, according to the lake hydrology modeling.
While longitudinal distance in kilometer (Dφ) is different at each latitude, it will be calculated by the difference of east and west longitudes (φE and φw) at the latitude (θ):

RESULTS
Reconstruction of paleolake areas
In this study, three lakes (Aibi, Daihai, and Dalainuoer) in semi-arid or arid regions expanded in area at 6 ka. In the arid region of northwest China, Lake Aibi had a vast area of 2330 km2 at 6 ka and an area of 540 km2 at present (Fig. 6A; Wu et al., Reference Wu, Wang and Wang1993), so the area of Aibi during the mid-Holocene was 4.3-fold that of the present (Fig. 5D). Lake Daihai once had an area of 386 km2 at 6 ka (Fig. 6B; Wang et al., Reference Wang, Wu and Jiang1990) which is 2.9 times that of today (Fig. 6D; Ma et al., Reference Ma, Yang, Duan, Jiang, Wang, Feng and Li2011). In the semi-arid region of the EAM domain, Lake Dalainuoer had an area of 350.7 km2 at 6 ka (Fig. 6C; Li et al., Reference Li, Zheng and Zhu1990), which is 1.6 times (Fig. 6D) that of today (Ma et al., Reference Ma, Yang, Duan, Jiang, Wang, Feng and Li2011). In northern China, the presence of many great lakes at 6 ka provides robust evidence of increased EAM precipitation during the mid-Holocene despite regional differences (Table 3). Paleolake area reconstructions suggest that the 18 lake areas at 6 ka ranged from 1.2 to ~11.4-fold bigger than those of the present, with the highest ratio of increase (11.4-fold) at Lake Chaiwopu and the lowest one (1.2-fold) at Lake Lop.

Figure 6. Reconstructions of lake areas at (A) Lake Dalainuoer, (B) Daihai, and (C) Aibi and Percent increase of lake areas during various geological periods compared to 0 ka (D). Lake areas are shown for different time slices: 6–8 ka (green), 9–12 ka (dark green), and 25–40 ka (navy blue); modern water area is in white. (For interpretation of the references to color in this figure legend, the reader is referred to the web version of this article.)
Table 3. Lake area reconstruction and the precipitation simulation at 6 ka relative to present.

Quantification of precipitation
The overall results for the mid-Holocene simulated from 18 lake records show a significant increase in precipitation throughout the EAM domain compared to the present (see Table 3). We discovered that annual precipitation in the North China Plain, where four studied lakes (see nos. 1–4 in Fig. 3; Ningjinbo, Baiyangdian, Dabusu, and Xiaoxingkai) are located, was as high as 700–1000 mm/yr at 6 ka (a humid climate), but ranges from 400 to 650 mm/yr (semi-humid climate) at present. Similarly, lakes Dalainuoer, Daihai, Huangqihai, and Hulun (see nos. 5–8 in Fig. 3) on the eastern Mongolian Plateau experienced an increase to 600–760 mm/yr at 6 ka, reflecting the interpretation that the eastern Mongolian Plateau had a semi-humid climate in the mid-Holocene; however, these lakes are characterized by a semi-arid climate with annual precipitation of 300–430 mm/yr at present. Also, Lake Qinghai (see no. 9 in Fig. 3) is located in the eastern part of the West China Mountains, where there was much higher precipitation (520 mm/yr; semi-humid climate) at 6 ka than that of today (337 mm/yr; semi-arid climate). Moreover, in northwest China, the mean annual precipitation of Lakes Chaerhan, Lop, Aqigekule, Beilikekule, Wulanwula, Xiaoshazi, and Balikun (see nos.10–16 in Fig. 3) fell from 6 ka (160–330 mm/yr) to the present (20–100 mm/yr). Although this region at both periods is still classified as an arid climate, the precipitation at 6 ka is 1.6–16.5 times that of today. In addition, the simulations at Lakes Chaiwopu and Aibi in the farthest northwest portion of China show a higher precipitation at 6 ka (611–626 mm/yr, semi-humid climate), which may have been controlled by the westerly jet (Qin et al., Reference Qin, Shi and Yu1998; Chen et al., Reference Chen, Xu, Chen, Birks, Liu, Zhang and Jin2015). By comparison, the precipitation at these two lakes is only 58–91 mm/yr (arid climate) at present (see nos. 17–18 in Fig. 3). Hence, the decrease in precipitation by 70–553 mm/yr from 6 ka to the present could be partly ascribed to penetration of the EAM precipitation belt into the modern arid inland regions and to the shift of the westerly jet transporting moisture from the upstream of the westerly wind at 6 ka (Harrison et al, Reference Harrison, Yu and Tarasov1996; Qin et al., Reference Qin, Shi and Yu1998; Chen et al., Reference Chen, Xu, Chen, Birks, Liu, Zhang and Jin2015).
The spatial pattern of precipitation also changed from 6 ka to the present (see Fig. 5A–B). The modern 400-mm isohyet was replaced at 6 ka by the 800-mm isohyet in the east and by the 600-mm isohyet in the center of the region. The EAM expansion can be further quantified in a grid-based computation. Four lines representative of the migration distances of the precipitation belts have been calculated in the south–north and east–west directions, respectively (see Fig. 5C). In a south–north direction, the modern 400-mm isohyet in the northeast China Plain was replaced by the 800-mm isohyet at 6 ka (see Line a1 in Fig. 5C), suggesting an ~1100 km northeastward expansion at 6 ka relative to the present. In the west, the 800-mm isohyet expanded northward to the location of the modern 500-mm isohyet (see Line a2 in Fig. 5C). Consequently, the 800-mm isohyet expanded northward by a distance of ~548 km at 6 ka relative to 0 ka. In the east–west direction, the 600-mm isohyet at 6 ka (see Line b1 in Fig. 5C) was replaced by the modern 400-mm isohyet in the northeastern Tibetan Plateau, showing an ~532 km westward expansion at 6 ka relative to the present. In North China, the 400-mm isohyet at 6 ka shifted westward to the modern 200-mm isohyet (see Line b2 in Fig. 5C), extending ~840 km farther inland into the Asian continent than at present.
Comparisons of the EAM precipitation proxies
The lake-level records of the 18 lakes have been coded according to their relative lake status. The lake-status coding across the Holocene is approximately consistent with the cave δ18O record (Fig. 7A; Dykoski et al., Reference Dykoski, Edwards, Cheng, Yuan, Cai, Zhang, Lin, Qing, An and Revenaugh2005; Wang et al., Reference Wang, Cheng, Edwards, He, Kong, An, Wu, Kelly, Dykoski and Li2005), and the levels of Lake Dalainuoer (see Fig. 7B; Goldsmith et al., Reference Goldsmith, Broeckera, Xu, Polissara, deMenocal, Porat, Lan, Cheng, Zhou and An2017), reflecting a high EAM precipitation pattern during the early and mid-Holocene but a gradually decreasing precipitation pattern since 5 ka. Also, the level records of Lake Dalainuoer based on studies of sedimentology and geomorphology (see Fig. 7B, shading bar; Geng and Zhang, Reference Geng and Zhang1988; Li et al., Reference Li, Zheng and Zhu1990; Xiao et al., Reference Xiao, Si, Zhai, Itoh and Lomtatidze2008; Liu et al., Reference Liu, Chen, Chen, Zhang and Chen2017) agree well with the reconstruction by Goldsmith et al. (Reference Goldsmith, Broeckera, Xu, Polissara, deMenocal, Porat, Lan, Cheng, Zhou and An2017) (see Fig. 7B, dotted line).

Figure 7. (color online) Comparisons of East Asian monsoon precipitation proxies in China across the Holocene. (A) Stalagmite δ18O ratios (‰) from Dongge Cave. Oxygen stable isotope records show responses to temperature, precipitation, and salinity. (B) Level of Lake Dalainuoer by reconstruction in elevation (m asl) and by the global-standard lake-status coding (the present study). Individual lake-status records show responses to precipitation and evaporation. Absolute heights (1220–1300 m asl) of Dali lake levels are plotted in vertical coordinates by Goldsmith et al. (Reference Goldsmith, Broeckera, Xu, Polissara, deMenocal, Porat, Lan, Cheng, Zhou and An2017), while the Dali Lake codings are relative classifications between categories 1 and 7 over the last 20 ka; thus, the lake coding curve is relatively matched with Goldsmith's curve. (C) Histograms of 18 lake-level changes by 3-category scheme of high, intermediate, and low levels (%) (the present study). Regional lake status shows responses to regional precipitation and evaporation. (D) Desertification development by coarse sand content (%) from two profiles in Hunshandak Sandland, the eastern Mongolian Plateau by Liu et al. (Reference Liu, Xu and Cui2002). Sandland deposits record responses to precipitation, drought, and temperature/evaporation. (E) Peatland initiation indicated by frequency of basal peatland ages (%) from the Greater and Lesser Khingan Mountains by Xing et al. (Reference Xing, Bao, Guo, Lu and Wang2015). Peatland records show responses to precipitation, humidity, and temperature/evaporation. In Figure 2, a blue circle, a red circle, red dots, frame 1, and frame 2 show the locations of the five proxies, respectively. The five proxies all indicate past precipitation changes to some extent.
All lakes in northwest China cover less than 1% of the total area of the region. For areas without glacier meltwater supply, the absolute amount of evaporation would greatly exceed the absolute amount of precipitation. In this arid zone, it is true that lake levels in the early Holocene were partially controlled by glacier meltwater variations. However, this small component can be filtered by investigating the regional lake-level pattern (see Fig. 7C). The composite lake-status record shows the variation over time in overall moisture status in northern China, which peaked during the early to mid-Holocene (see Fig. 7C). Lakes with high levels accounted for approximately 50% of the total, while lakes with low levels accounted for less than 15% of the total at 6–7 ka, while the percentage of high levels decreased to 15% and low levels increased to 45–50% after 5 ka.
Reconstruction of precipitation based on multiple lake records is seldom affected by the unique characteristics of individual lakes (Liu et al., Reference Liu, Wen, Brady, Otto-Bliesner, Yu, Lue and Cheng2014) because the trend of lake status from multiple lakes is roughly consistent even in different geographic regions (e.g., see two subgroups in Fig. 1A–B). This trend is also identical to other proxies of effective moisture in North China. Taking Hunshandak Sandland (see location in frame 1 of Fig. 2) as an example, paleoclimate reconstruction using pollen and land cover evidence suggests there was a broadleaf woodland before 6 ka, which is robust evidence of the EAM precipitation arriving there, while vegetation at present is steppe sandland (see Fig. 7D; Liu et al., Reference Liu, Xu and Cui2002; Liu et al., Reference Liu, Chen, Zhang, Li, Rao and Chen2015; Yin et al., Reference Yin, Liu and Hao2015). Furthermore, a huge shift of climate is reconstructed from records of peatland and swamps, which are located in the eastern fringe of the Khingan Mountains (ca. 42–54°N and 116–125°E; see frame 2 in Fig. 2). This region was once a moist forest-swamp before 6 ka that is consistent with higher-than-present EAM precipitation that has become a semi-arid peatland in the present (see Fig. 7E; Xing et al., Reference Xing, Bao, Guo, Lu and Wang2015).
DISCUSSION
The precipitation history of a single lake cannot fully represent the broad-scale monsoonal precipitation of northern China that may be affected by local variations of monsoon precipitation as well as non-climate factors on the lake itself (e.g., Liu et al., Reference Liu, Chen, Chen, Zhang and Chen2017). Indeed, it has long been recognized that regionally synchronous variability of lake levels from a number of lakes is essential for the reconstruction of broad-scale monsoon precipitation changes (Street-Perrott et al., Reference Street-Perrott, Marchand and Roberts1989; Harrison and Digerfeldt, Reference Harrison and Digerfeldt1993). To this end, lake databases were compiled for the reconstruction of paleoprecipitation, such as the Oxford Lake Level Data Base (Street-Perrott et al., Reference Street-Perrott, Marchand and Roberts1989), the European Lake Status Data Base (Yu and Harrison, Reference Yu and Harrison1995), the Former Soviet Union and Mongolian Lake Status Data Base (Tarasov et al., Reference Tarasov, Pushenko, Harrison, Saarse, Andreev, Aleshinskaya and Davydova1996), and the CLSDB and its updated database (Yu et al., Reference Yu, Harrison and Xue2001a; Xue et al., Reference Xue, Yu and Zhang2017). In particular, the CLSDB has provided the most comprehensive lake records for all of East Asia. The data from 45 lakes in the CLSDB show a clear pattern of change through the last deglaciation at 500-yr time intervals (see Fig. 1A–B). Generally, the lakes are relatively high at the advent of the last deglaciation but lower during the late-glacial period and then high again during the mid-Holocene. The high lake status for the eastern lake group accounts for no more than 35% during the last deglaciation but as much as 50% during the mid-Holocene (see Fig. 1A). The high lake levels for the western lake group account for no more than 28% during the last deglaciation but as much as 45% in the mid-Holocene (see Fig. 1B). This suggests that the lacustrine sediment records from different regions at 500-yr time intervals are reliable. In addition, in northwest China, there was a relatively high lake level during the late Holocene, though slightly lower than during the mid-Holocene, while lakes in East China show no such small peak in the late Holocene, which is consistent with Chen et al.’ research (Reference Chen, Chen, Holmes, Boomer, Austin, Gates, Wang, Brooks and Zhang2010). Wetter conditions in the late Holocene likely reflect an increase in precipitation resulting from the southward displacement of the westerlies (Chen et al., Reference Chen, Chen, Holmes, Boomer, Austin, Gates, Wang, Brooks and Zhang2010).
We selected 18 lakes in northern China including northeast China, North China, and northwest China to illustrate the temporal variations in lake status over the past 16 ka. These lakes were selected based on two criteria. First, they are located in the northern fringe of the present-day EAM precipitation area (200–800 mm/yr), which is sensitive to the EAM precipitation migration (Qin et al., Reference Qin, Shi and Yu1998; An et al., Reference An, Porter, Kutzbach, Wu, Wang, Liu, Li and Zhou2000, Reference An, Wu, Li, Sun, Liu, Zhou and Cai2015; Chen et al., Reference Chen, Xu, Chen, Birks, Liu, Zhang and Jin2015). Second, the modern precipitation is concentrated in summer at these lakes since over 80% of precipitation occurs from May to September (Climate Center of National Meteorology Bureau of China, 2007), showing a pronounced summer peak in moisture (Sheng, Reference Sheng1986; Ding and Chan, Reference Ding and Chan2005). Based on the aforementioned databases and methodology, the “1D lake level—2D lake area—3D catchment hydrology” model was constructed to obtain the magnitude and extent of the EAM at 6 ka.
The northward expansion extent of the EAM during the mid-Holocene in this study is largely consistent with the reconstruction from Lake Dalainuoer alone (Goldsmith et al., Reference Goldsmith, Broeckera, Xu, Polissara, deMenocal, Porat, Lan, Cheng, Zhou and An2017). Our comprehensive lake records, however, provide more direct and consistent evidence supporting the broad-scale expansion of EAM precipitation at 6 ka. In particular, the multiple lake reconstructions enable us to identify variations in precipitation expansion in different regions. During the mid-Holocene in the northeastern region, including Lake Dalainuoer, the area influenced by the EAM was larger than it is at present, with a twofold increase in annual precipitation from 400 to 800 mm/yr. Similarly, the area influenced by the EAM moderately expanded toward the west with an increase in precipitation from 400 to 600 mm/yr at 6 ka relative to the present. Therefore, the EAM precipitation belt at 6 ka extended northward by ~1100 km in northeast China as well as by ~550 km in North China, and westward by ~530–840 km. The variability in EAM precipitation expansion could be partly ascribed to land surface conditions and associated feedback on the EAM. When the EAM extends northeastward, it can penetrate into the northeast China Plain without difficulty after crossing the North China Plain. In contrast, toward the northwest, expansion of the EAM can be blocked by the high topography of the Tibetan Plateau and Mongolian Plateau. Overall, this EAM expansion is consistent with other environmental proxies in northern China (An et al., Reference An, Wu, Li, Sun, Liu, Zhou and Cai2015; Chen et al., Reference Chen, Xu, Chen, Birks, Liu, Zhang and Jin2015). For example, reconstruction of pollen-based vegetation suggests the northern fringe of temperate broadleaf forest migrated northward by ~500–800 km between 6 ka and 0 ka (Yu et al., Reference Yu, Chen, Ni, Cheddadi, Guiot, Han, Harrison, Huang, Ke and Kong2000). The boundaries of the shifting belt are equivalent to the 600-mm isohyet in northeast China and the 400-mm isohyet in North China, indicating the EAM expansion is consistent with our lake data synthesis.
Subsequently, the abrupt termination of the Holocene humid period at 5.5–5 ka (see Fig.7C) seemed to exert significant impacts on the social development of Chinese culture (Goldsmith et al, Reference Goldsmith, Broeckera, Xu, Polissara, deMenocal, Porat, Lan, Cheng, Zhou and An2017). Additional evidence suggests a great historic transition from a nomadic society at 6 ka to an agricultural one at 5 ka. Interestingly, this transition occurred in the northwestern fringe of the EAM, which probably could have been triggered by the decline of North China precipitation amounts (Wang et al., Reference Wang, Liu, Chang and An2009; Chen et al., Reference Chen, Shi and Cai2013; Yang, Scuderib, et al., Reference Yang, Scuderib, Wang, Scuderi, Zhang, Li and Forman2015).
CONCLUSIONS
Paleoclimate for the mid-Holocene warm period (ca. 6 ka), considered as an analog of the present-day global warming scenario, might provide a key baseline for constraining projections of future climate conditions. Although estimates of local precipitation at 6 ka have been reconstructed from numerous records of individual lakes, reconstruction of continental-scale precipitation and associated EAM shifts using quantitative measurement remain incomplete Our approach called “1D lake level—2D lake area—3D catchment hydrology” has been exploited here to address this issue.
The 1D lake levels were obtained from multiple lake records to fully examine the EAM spatial variability and consequently avoid an underestimate or overestimate of the extent of the EAM precipitation expansion or contraction on individual lake records. The records of 18 lakes were synthesized. These lakes lie in a transitional belt between arid and humid climate conditions and are sensitive to the magnitude and intensity of EAM precipitation fluctuations. The 2D lake area component of our approach was aimed at reconstructing lake areas using multiple lines of geomorphological and sedimentary evidence. The 3D catchment hydrological simulation was made by using the lake hydrological model, computing precipitation changes, and mapping them. Significant changes in spatial precipitation patterns at 6 ka were determined.
The lake-based precipitation reconstructions suggest an ~550–1100 km northward expansion and an ~530–840 km westward expansion of the EAM at 6 ka. The EAM precipitation domain covers up to 6 million square kilometers. The comparisons between precipitation simulations and multiple precipitation proxies are effective ways to validate the reliability of the simulation method and to understand the dynamic mechanism of climate changes.
Overall, the comprehensive lake records provide, to date, the most robust evidence supporting the hypothesis that a strengthened EAM in the Holocene is dynamically linked to enhanced moisture transport and consequently is the cause of an enormous increase in annual precipitation as well as a huge expansion into northern China. Thus, northern China was quite sensitive to EAM precipitation variations in the past and may also be a region sensitive to future climate fluctuations.
ACKNOWLEDGMENTS
This work was supported by the National Key Research and Development Program of China (2017YFC0405205 and 2017YFA0603801), the Natural Science Foundation of Anhui Province (1908085MD110 and 1808085QD107), and the National Natural Science Foundation of China (grants 41630527 and 41701577).


