INTRODUCTION
Durum wheat (Triticum turgidum var. durum) is a major crop in the Mediterranean basin of West Asia, North Africa, and Southern Europe (Elias and Manthey, Reference Elias, Manthey, Royo, Nachit, Fonzo, Araus, Pfeiffer and Slafer2005), whereas drought is the most important limitation to the durum wheat production in the Mediterranean environments and other areas (Mohammadi et al., Reference Mohammadi, Sadeghzadeh, Armion and Amri2011). Low water availability is the major yield limiting factor of crop plants and it continuously and greatly influences the natural distribution of plant species. Although physiological traits regulate the uptake, use, and distribution of resources such as carbon, water, and nutrients and finally determine growth and reproduction (Ackerly et al., Reference Ackerly, Dudley, Sultan, Schmitt, Coleman, Linder, Sandquist, Geber, Evans, Dawson and Lechowicz2000), yield is used as the main criterion in the selection of wheat varieties for dry Mediterranean environments. It has been proposed that selection of genotypes using yield assisted by morphological and physiological traits associated with yield under the drought stress is more efficient in selecting high yielding genotypes for dry environments (González-Ribot et al., Reference González-Ribot, Opazo, Silva and Acevedo2017).
Several plant–water relation parameters have been suggested for using in breeding programs. Among them, traits such as small plant size, reduced leaf area, early maturity and prolonged stomatal closure lead not only to reduce total seasonal evapotranspiration but also to reduce yield potential (Karamanos and Papatheohari, Reference Karamanos and Papatheohari1999). Assessment of water loss from excised leaves (ELWL) and leaf relative water content (RWC) have also been proposed as an important indicators of water status rather than water potential under the drought stress (Pellegrino et al., Reference Pellegrino, Lebon, Voltz and Werry2007). RWC is closely related with cell volume, therefore, it may more closely reflect the balance between water supply to the leaf and transpiration rate (Reynolds et al., Reference Reynolds, Dreccer and Trethowan2007). This trait also influences the recovery of plant from stress and consequently affects yield and yield stability (Mir et al., Reference Mir, Mainassara, Nese, Trethowan and Varshney2012). Chlorophyll fluorescence analysis may also provide a sensitive indicator of stress condition in plants, being useful to estimate the activity of the thermal energy dissipation in photosystem II, which protects photosystems from the adverse effect of light and heat stress (Murchie and Lawson, Reference Murchie and Lawson2013). Depending on the stress conditions (timing and intensity), some drought adaptive traits can be considered for yield improvement under the drought-prone environments if they enable plants to cope with a stress event, which tends to occur every year at the same growth stage. For instance, a good level of earliness is an effective breeding strategy for enhancing yield stability in Mediterranean environments, where wheat plants are exposed to terminal drought stress (Cattivelli et al., Reference Cattivelli, Delogu, Terzi, Stanca and Slafer1994; Shavrukov et al., Reference Shavrukov, Kurishbayev, Jatayev, Shvidchenko, Zotova, Koekemoer, de Groot, Soole and Langridge2017). However, breeding programs that aim to release commercially successful varieties typically grow many thousands of genotypes in a target set of environments in order to undertake phenotypic selection for grain yield as well as other key traits.
Genetic gain in yield is a function of the selection intensity, the extent of phenotypic variability for yield and its heritability. Heritability is reduced if genotype ×environment (GE) interactions are significant as they usually are in variable rainfed environments (especially genotype × year interaction). For future breeding and selection, it is important to identify the variation available for grain yield and agro-physiological traits in crop species. Genotype evaluation on the basis of multiple traits is another important issue in plant breeding. Numerous methods have been proposed to understand the causes of interactions. Although the strategies may differ in overall appropriateness, these methods usually lead to similar conclusions for a given dataset (Rubio et al., Reference Rubio, Cubero, Martin, Suso and Flores2004). The genotype by trait (GT) biplot analysis allows visualization of genetic correlation among traits (Rubio et al., Reference Rubio, Cubero, Martin, Suso and Flores2004; Yan and Frégeau-Reid, Reference Yan and Frégeau-Reid2008) and it has been used in genotype evaluation of soybean (Yan and Rajcan, Reference Yan and Rajcan2002), white lupin (Rubio et al., Reference Rubio, Cubero, Martin, Suso and Flores2004), bean (Gonzalez et al., Reference Gonzalez, Monteagudo, Casquero, De Ron and Santalla2006), wheat (Morris et al., Reference Morris, Campbell and King2004) and oat (Peterson et al., Reference Peterson, Wesenberg, Burrup and Erickson2005; Yan and Frégeau-Reid, Reference Yan and Frégeau-Reid2008). The GT biplot provides information on the usefulness of genotypes for production and on redundant traits, and also allows identification of traits that are appropriate for indirect selection for grain yield.
Therefore, the main objectives of this research were (i) to evaluate genetic variability among durum genotypes in response to drought for grain yield and agro-physiological traits and (ii) to compare among genotypes on the basis of multiple traits by GT-biplot technique.
MATERIALS AND METHODS
Plant material and experimental layout
Twenty-one rainfed durum wheat breeding lines (G1–G21) selected from the joint durum wheat breeding program of Iran/CIMMYT along with four check cultivars (G22–G25) were evaluated (Table 1) under the rainfed conditions during three cropping seasons (2010/11, 2011/12, 2012/13). The trials were conducted in one of the main Agricultural Research Stations of the Dryland Agricultural Research Institute (DARI) of Iran (Sararood station, Kermanshah, Iran, 34°19ʹN; 47°17ʹE; 1351 a.m.s.l.), a moderate cold location in rainfed durum wheat breeding program. The research station is located in the west of Iran with annual month averages of minimum and maximum air temperature of –20°C and 45°C, respectively, and 60–100 days of freezing temperatures annually. The long-term annual precipitation is estimated to 425 mm, consisting of 90% rain and 10% snow. The climate data were collected from a meteorological station established at Sararood station, with 500–1000 m away from the experiments. The soil at the station was clay loam. At each cropping season, experimental layout was a randomized complete block design with three replications. Plot size was 7.2 m2 (6 rows, 6 m long and 20 cm row spacing). Fertilizer rate was 50 kg N ha−1 and 50 kg P2O5 ha−1 applied at planting. Management practices recommended for each trial were followed in the all yield trials.
Table 1. Code, name and origin of tested genotypes.

Potential quantum efficiency of photosystem II (Fv/Fm), chlorophyll content (SPAD, Soil and Plant Analyzer Development), and stomatal conductance (SC) were measured on the flag leaf. Fv/Fm measurements were taken between 11:00 and 14:00 hours, by using leafclips placed on the flag leaf for at least 30 min. Following dark adaptation, Fv/Fm readings were taken with a fluorometer (MINI-PAM-II, Heinz Walz GmbH, Effeltrich, Germany), as done by Ristic et al. (Reference Ristic, Bukovnik and Prasad2007). The SPAD reading was recorded for three flag leaves in each plot by the SPAD chlorophyll meter (Minolta Co. Ltd., Tokyo, Japan). The genotypes with high SPAD under the drought condition are desirable. SC was measured using a leaf porometer (Decagon Devices, Inc., Pullman, WA, USA). Three random flag leaves were selected in each plot for determining SC. Genotypes with lower SC under the drought conditions are desired as this helps to conserve water and maintain an adequate leaf water status. However, low SC also reduces leaf internal CO2 concentration and then photosynthesis (Chaves et al., Reference Chaves, Pereira, Maroco, Rodrigues, Ricardo, Osório, Carvalho, Faria and Pinheiro2002).
CT was measured with a portable infrared thermometer (E200IR, Germany). Three measurements were taken per plot at approximately 0.5 m from the edge of the plot with an approximately 45° from the horizontal position. CTs were measured between 12:00 to 14:00 hours on a clear sunny day. Genotypes with low CT are desirable as it is associated with high SC, transpiration, and photosynthesis.
Relative water loss (RWL) of six of the youngest, fully expanded leaves was measured at the early heading stage. Leaves were weighed, wilted for 2 h at 30°C, reweighed and oven-dried for 48 h at 72°C to obtain the dry weight. The rate of water loss was calculated as done by Yang et al. (Reference Yang, Jana and Clarke1991):
 $$\begin{equation}
{\rm{RWL}} = \frac{{\left( {{\rm{W}}1 - {\rm{W}}2} \right)/{\rm{W}}3}}{{\left( {{\rm{t}}2 - {\rm{t}}1} \right)/60}}
\end{equation}$$
$$\begin{equation}
{\rm{RWL}} = \frac{{\left( {{\rm{W}}1 - {\rm{W}}2} \right)/{\rm{W}}3}}{{\left( {{\rm{t}}2 - {\rm{t}}1} \right)/60}}
\end{equation}$$
where W1, W2 and W3, are the initial, wilt and dry weights, and t1, and t2 are the times in minutes at the initial and wilt weights, respectively. Genotypes with low RWL under the drought conditions are suitable for selection.
RWC was calculated using the method given by Barrs (Reference Barrs and Kozolvski1968):
 $$\begin{equation}
{\rm{RWC}}\left( \% \right) = \frac{{\left( {{\rm{FW}} - {\rm{DW}}} \right)}}{{\left( {{\rm{TW}} - {\rm{DW}}} \right)}}*100
\end{equation}$$
$$\begin{equation}
{\rm{RWC}}\left( \% \right) = \frac{{\left( {{\rm{FW}} - {\rm{DW}}} \right)}}{{\left( {{\rm{TW}} - {\rm{DW}}} \right)}}*100
\end{equation}$$
where FW refers to the fresh weight, DW to the dry weight and TW to the turgid weight after soaking the leaf discs in water for an overnight. High RWC for genotypes grown under the drought condition are desired.
The relative growth rate (GR), as suggested by Hoffmann and Poorter (Reference Hoffmann and Poorter2002), was measured to quantify the speed of plant growth. Genotypes with high GR are desirable as they minimize evaporation of moisture from the soil surface by rapid soil cover and maximize soil–water available for transpiration and growth. It was calculated as follows:
 $$\begin{equation}
{\rm{GR}}\left( \% \right) = \frac{{{\ln}( {{\rm{PH}}2) - \ln ({\rm{PH}}1})}}{{{\rm{t}}2 - {\rm{t}}1}}
\end{equation}$$
$$\begin{equation}
{\rm{GR}}\left( \% \right) = \frac{{{\ln}( {{\rm{PH}}2) - \ln ({\rm{PH}}1})}}{{{\rm{t}}2 - {\rm{t}}1}}
\end{equation}$$
where ln(PH1) and ln(PH2) are the natural logarithms for measurements of plant height in initial stem-elongation (t1) and after two weeks (t2), respectively, for each genotype.
At maturity, the agronomic traits recorded for each genotype were plant height (PH), peduncle length (PL), flag-leaf length (FL), spike length (SL), days to heading (DH), days to maturity (DM), grain yield (YLD), thousand-kernel weight (TKW) and number of seeds per spike (NSPS). Heading date was recorded as the number of days from the emergence to the time when the spikes of ~50% of the tillers had emerged from the flag leaf sheaths for approximately half of their length (stage 55 in the Zadoks scale; Zadoks et al., Reference Zadoks, Chang and Konzak1974). Days to maturity were recorded when ~50% of the plants in a plot had yellow leaves. PH, PL, FL, SL and NSPS were measured based on five randomly samples for each genotype at the physiological maturity. After harvest, TKW was recorded based on weight of 1000 grains for each genotype. The plot yields were converted to productivity per hectare (kg ha−1) and subjected to statistical analyses.
Statistical analysis
The recorded data were subjected to combined analysis of variance using MSTAT-C software to ascertain existence of statistically significant variability among the genotypes. The phenotypic coefficient of variation (PCV), genotypic coefficient of variation (GCV), broad-sense heritability (H2b), expected genetic advance (GA), and expected genetic advance as percentage of mean (GAM), as suggested by Burton and DeVane (Reference Burton and DeVane1953) and Johnson et al. (Reference Johnson, Robinson and Comstock1955) were estimated for grain yield and each agro-physiological trait.
The GT biplot analysis (Yan and Rajcan, Reference Yan and Rajcan2002) was performed on the 25 durum genotypes and 16 agro-physiological traits. The GT biplots were constructed by plotting PC1 scores against PC2 scores for each genotype and each trait. The biplots were generated using the standardized values of the trait means and analyses were based on Model 2 i.e., dataset was not transformed (Transform=0) within-trait standard deviation standardized (Scale=1) and trait-cantered (Centering=2). The polygon views were based on genotype-focused singular value partitioning (SVP=2), while the vector views were based on the trait-focused SVP and is, therefore, appropriate for visualizing the relationships among traits and genotypes (Yan, Reference Yan2001). The GT biplots were generated using the GGEbiplot software (Yan, Reference Yan2001). In GT biplot, a vector drawn from origin to each trait facilitates the visualization of relationships among traits. The correlation coefficient between any two traits is approximated by the cosine of the angle between their vectors. Two traits are positively correlated if the angle between their vectors is an acute, while they are negatively correlated if their vectors are at an obtuse angle. The length of the vector describes the discrimination ability of the investigated traits. A short vector may indicate that the trait is not related to other traits, the lack of variation or usefulness for genotype discrimination (Yan and Rajcan, Reference Yan and Rajcan2002).
RESULTS
Environmental conditions
The cropping seasons differed in amount and distribution of rainfall as well as in average air temperature (Figure 1), which caused contrasting growing conditions and therefore a range of yield potentialities under the rainfed conditions. Rainfall distribution pattern remarkably varied among cropping seasons and genotypes were exposed to different levels of drought stress, which is a limiting factor in moderate cold rainfed areas of Iran. The all three seasons were characterized by lower rainfall (342.5, 302.9 and 394.3 mm, respectively in 2010/11, 2011/12 and 2012/13 seasons) than the average long-term rainfall (425 mm). No significant variation in minimum air temperature was observed among cropping seasons, but the winter in 2012/13 season was warmer than the other two seasons. In the three cropping seasons, drought and high temperature are key stress factors during the post-flowering (i.e., during anthesis and grain-filling stages of growth), with high potential impact on crop yield. This phenomenon often shortened grain filling period, reducing grain weight and consequently yield loss in wheat experiments under the rainfed conditions of Iran.

Figure 1. Monthly patterns of rainfall and temperature of air (T air) recorded during the course of the experiment
Combined analysis of variance and trait values for genotypes
The results of combined ANOVA for grain yield and 15 agro-physiological traits are given in Table 2. Highly significant differences (P<0.01) were observed among genotypes (G) (except for GR, Fv/Fm, RWL and NSPS), years (Y) and G × Y interaction effects for grain yield and related traits. Depending on trait, the year accounted for 7.2% (for SL) to 86.0% (for TKW) of total sum of squares, followed by G × Y interaction that captured 5.0% (corresponding to TKW) to 49.2% (corresponding to NSPS), and genotype accounting for 1.9% (corresponding to PL) to 36.1% (corresponding to SPAD). This indicates that for the majority of traits, the year accounted for most of the variation followed by G × Y and genotype effects. On average, year, genotype and G × Y interaction were accounted for 46.6%, 16.8% and 18.9% of total variation, and the rest variation was captured by the error.
Table 2. Combined analysis of variance and expected mean squares among 25 durum genotypes tested in three cropping seasons.

*and **Significant at 5% and 1% level of probability, respectively.
%TSS: Percentage relative to total sum of squares.
DH: days to heading; DM: days to maturity; GR: relative growth rate; RWL: relative water loss; RWC: relative water content; SPAD: chlorophyll content; CT: canopy temperature; Fv/Fm: chlorophyll fluorescence; SC: stomatal conductance; PH: plant height; TKW: thousand kernel weight; NSPS: number of seeds per spike; SL: spike length; PL: peduncle length; FL: flag-leaf length; YLD: grain yield; ns: not-significant.
According to the least significant difference (LSD) test, the genotypes significantly differed based on studied traits (Table 3). No genotype was best for all traits; so genotypes should be characterized by their trait profiles. Based on YLD, genotype G2, followed by G22 and G3 performed well across years, whereas G24, G16 and G8 showed lower yield performance. The best genotypes in early flowering were G22, G3 and G15, while the best genotypes in maturity were G13, G4 and G3. The plant height ranged between 52.3 (G14) and 91.3 cm (G24) among genotypes, while TKW ranged from 22.7 (G4) to 29.4 g (G3). The genotype with the highest relative GR was G25, followed by G22 and G12. The spike length varied between 6.0 (G16) and 10.0 cm (G25) among tested genotypes and the highest peduncle length was found in G21, G23 and G1. Genotypes with the highest flag-leaf length were G17, G28 and G8 and number of seeds per spike (NSPS) was the highest for G15, G17 and G2 (Table 3).
Table 3. Genotypic mean values based on 16 agro-physiological traits across three cropping seasons.

DH: days to heading; DM: days to maturity; GR: relative growth rate; RWL: relative water loss; RWC: relative water content; SPAD: chlorophyll content; CT: canopy temperature; Fv/Fm: chlorophyll fluorescence; SC: stomatal conductance; PH: plant height; TKW: thousand kernel weight; NSPS: number of seeds per spike; SL: spike length; PL: peduncle length; FL: flag-leaf length; YLD: grain yield.
Taking into account physiological traits, G1, G15 and G8 had the least RWL, while G22, G19 and G16 had the highest RWL (Table 3). The genotypes with highest RWC were G16, G9 and G2, while G24 followed by G21 and G15 had the least RWC. The highest SPAD values were found in G6, while the three genotypes G25, G23 and G24 had the lowest SPAD readings. The genotype G25 had lowest CT, while the genotypes G24, G3 and G17 showed the highest CTs. The highest Fv/Fm was measured in G2, while the lowest was found in G24. The genotype G23 had the lowest SC, while G4 showed the highest SC (Table 3).
Estimation of genetic variability
GCV values varied from 1.2% (for days to maturity) to 29.2% (for RWL), while PCV ranged from 1.7% (for days to maturity) to 42.5% (for RWL), as shown in Table 4. High genotypic and phenotypic variances in the quantitative traits, particularly for RWL, SC, PH, PL and YLD, are pre-requisite for successful breeding practice. Similar values between GCV and PCV were observed for most of the traits. DH, DM, Fv/Fm and CT exhibited low PCV and GCV (Table 4), indicating that breeders should look for other sources of high variability among durum wheat genotypes for improvement through indirect selection. H2b was highest for plant height, (90.8%), SPAD reading (77.7%) and TKW (60.8%). GAM ranged from 1.7% (DM) to 52.7% (PH). High heritability in broad sense and GAM were observed in plant height (90.8%, 52.7%), grain yield (53.6%, 23.5%) and RWL (47.2%, 41.3%), respectively.
Table 4. Estimate of genetic parameters for the studied trait of 25 tested genotypes across three cropping seasons.

PCV: phenotypic coefficient of variation; GCV: genotypic coefficient of variation, H 2b: broad-sense heritability; GA: expected genetic advance; GAM: expected genetic advance as percentage of mean. DH: days to heading; DM: days to maturity; GR: relative growth rate; RWL: relative water loss; RWC: relative water content; SPAD: chlorophyll content; CT: canopy temperature; Fv/Fm: chlorophyll fluorescence; SC: stomatal conductance; PH: plant height; TKW: thousand kernel weight; NSPS: number of seeds per spike; SL: spike length; PL: peduncle length; FL: flag-leaf length; YLD: grain yield.
Graphic analysis of genotype by trait data
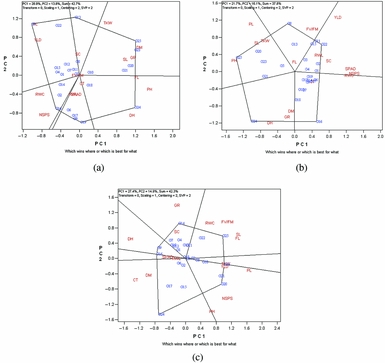
The GT biplot generated from data on 16 agro-physiological traits of 25 genotypes in each cropping season is presented in Figure 2. The biplots explained 37.8–42.7% of the total variation of trait-standardized data in each environment. The relatively low variation accounted by the biplots reflects the complexity of the trait relations. In 2010/11 cropping season (Figure 2a), G3 had the highest values for YLD and PL, G25 (bread wheat variety) had the highest values for TKW, DM, GR and SL, G24 (durum old variety) had the highest values for DH, PH, and FL and G16 presented the highest values for RWC and NSPS. Breeding line G19 had the highest values for SPAD reading, RWL and CT and breeding line G13 had the highest value of SC in 2010/11 season.

Figure 2. The polygon view of the genotype by trait (GT) biplot for comparison of 25 durum wheat genotypes based on 16 agro-physiological traits in 2010/11 (a), 2011/12 (b) and 2012/13 (c) cropping seasons. DH: days to heading; DM: days to maturity; GR: relative growth rate; RWL: relative water loss; RWC: Relative water content; SPAD: chlorophyll content; CT: canopy temperature; Fv/Fm: chlorophyll fluorescence; SC: stomatal conductance; PH: plant height; TKW: thousand kernel weight; NSPS: number of seeds per spike; SL: spike length; PL: peduncle length; FL: flag-leaf length; YLD: grain yield.
In 2011/12 season (Figure 2b), G22 (new cultivar) had the highest values for YLD, SPAD reading, RWC, NSPS, RWL and SC, whereas G25 (bread wheat old variety) had the highest values for PH, SL, TKW and PL. G24 (durum old variety) with the highest value for GR and tended to flower and reach maturity later than the other genotypes. Breeding line G8 with the highest value for FL exhibited higher Fv/Fm than the other genotypes. Finally, breeding line G16 had the highest value of CT in 2011/12.
In 2012/13 cropping season (Figure 2c), G20 had the highest values for YLD, TKW, NSPS, PL and PH, G25 (bread wheat old variety) had the highest values for Fv/Fm, FL, RWL and SL, and G14 presented the highest values for GR and SC. G24 (durum old variety) had the highest values for DM and CT, breeding line G16 had the highest values of SPAD reading and RWL, and breeding line G9 with the highest DH value, tending to flower later than the other genotypes.
Inter-relationships among agro-physiological traits
In 2010/11, positive correlations were found between yield and PL, as indicated by the acute angle between their vectors (Figure 3a). These traits were negatively associated with DH, PH and FL, indicating that selection for earliness, shorter plant height and flag-leaf length directly enhanced the productivity under the drought condition. Positive correlations were observed between DM, SL and GR, as well as between RWC and NSPS, and between RWL, SPAD, and Fv/Fm, as indicated by the acute angles between their vectors. A negative association existed for TKW with NSPS, RWC, SPAD and RWL, as indicated by the large obtuse angles between vectors of these five traits and that of TKW (Figure 3a). These negative associations appeared to be strong because the traits had long vectors. No relations were found between YLD with NSPS and TKW, as indicated by the right angles between their vectors.

Figure 3. The genotype by trait (GT) biplot for viewing trait relations of 25 durum wheat genotypes in 2010/11 (a), 2011/12 (b) and 2012/13 (c) cropping seasons. DH: days to heading; DM: days to maturity; GR: relative growth rate; RWL: relative water loss; RWC: relative water content; SPAD: chlorophyll content; CT: canopy temperature; Fv/Fm: chlorophyll fluorescence; SC: stomatal conductance; PH: plant height; TKW: thousand kernel weight; NSPS: number of seeds per spike; SL: spike length; PL: peduncle length; FL: flag-leaf length; YLD: grain yield.
Relationships among traits in 2011/12 were not similar to those in 2010/11 (Figure 3a and b), which indicated a differential response of genotypes to cropping seasons. The positive most prominent correlations were found between YLD and Fv/Fm; between TKW, SL and PL; between DH, DM and GR; between SPAD reading, RWC and NSPS (Figure 3b). A strong negative correlation existed for YLD with DH, DM, and GR, as indicated by the large obtuse angles between vectors of these three traits with YLD. These negative associations appeared to be strong because the traits had long vectors.
The relationships among traits in 2012/13 were different from two other seasons (Figure 3). Positive relationships were found among YLD, TKW, and PL, as indicated by the acute angles between their respective vectors. The traits SL, FL, Fv/Fm and RWC were highly correlated with one another, and CT and DM had strongest correlation, almost absolute (Figure 3c). YLD highly negatively correlated with phenological traits (DH, DM) and CT, as supported by the long vectors of traits. The vectors of some traits made nearly a 180 degree angle with each other, indicating they were opposite in genotypes ranking (Figure 3c).
In general, the length of trait vectors varied from year to year indicating the information of a trait may be masked by the effect of year. A short vector may indicate that the trait has no variation and cannot be efficient in showing differences among genotypes or it is not related to other traits. The vectors length for some traits was not influenced by year effect, indicating their efficiency to show genetic variability among genotypes in variable years. The studied traits contributed for the variation as indicated by the large vector lengths included DH, PH, PL, YLD, Fv/Fm, TKW, SL, RWC and DM (Figure 3).
DISCUSSION
Significant variation for the genotypes over the years and environments may be attributed to changes over the years, which may affect drought hardening of plants leading to changes for grain yield and plant–water relations (Basu et al., Reference Basu, Ramegowda, Kumar and Pereira2016). High heritability in a broad sense and expected genetic advance as percent of mean was observed for plant height (90.8%; 52.7%), grain yield (53.6%, 23.5%) and RWL (47.2%, 41.3%), respectively. These traits also showed high to moderate coefficient of variation and high to moderate heritability values, which indicated a major role of additive gene action in the inheritance of these traits and their amenability for their improvement through breeding practice. Low expected genetic advance as percent of mean values for most of traits (Table 4) indicated the major role of non-additive gene action in the transmission of the characters from one to next generation (Shukla et al., Reference Shukla, Bhargava, Chatterjee, Srivastava and Singh2006).
Choosing traits with higher heritability than yield across the target environments would be useful for indirect selection, as PH, SPAD reading, TKW, DH, RWC, FL, PL and SL (Table 4). For this reason, several authors have proposed that genotype selection under the Mediterranean rainfed conditions may be improved by selecting traits associated with yield under the water stress (Gizaw et al., Reference Gizaw, Garland-Campbell and Carter2016; McIntyre et al., Reference McIntyre, Mathews, Rattey, Chapman, Drenth and Ghaderi2010). To further aid genetic gain for yield, the three traits with higher genetic gain than yield included PH, RWL, and SC (Table 4). Yield generally maps opposite to plant height (Figure 3), indicating that shorter plants have higher yield in these environments. The results showed that RWL and SC map closely in all three years (Figure 3), being these two traits related to water use. In addition, days to heading maps opposite yield in all three years (Figure 3) and the genetic gain for DH was low as it has already been selected for. Thus, breeders should continue to select for earlier heading.
The GT-biplot is a useful technique to visualize the patterns of GT interaction as a graphic method and helped in finding promising durum genotypes for future breeding programs. Biplot analysis revealed that grain yield, and yield-related traits were affected by the drought, with DH, PH, PL, YLD, Fv/Fm, TKW, SL, RWC and DM being more responsive to drought and showing high variability among genotypes (Figure 2). However, breeders looking for new indirect selection traits for screening genotypes, detecting yield differences and finding traits with strong associations with grain yield (Fufa et al., Reference Fufa, Baenziger, Beecher, Graybosch, Eskridge and Nelson2005; Gutierrez et al., Reference Gutierrez, Reynolds, Raun, Stone and Klatt2012). Although many traits have been studied for their use in breeding strategies for drought resistance, only a few traits are currently recommendable for application in practical breeding programs. Lafitte et al., (Reference Lafitte, Blum, Atlin, Fischer, Lafitte, Fukai, Atlin and Hardy2003) recommend the use of days to flowering and maturity, CT and spike fertility as selection indicator under the drought conditions. However, phenology is the most widely used secondary trait because of ease of measurement and relatively high heritability (Banziger et al., Reference Banziger, Edmeades, Beck and Bellon2000).
Positive association of YLD with Fv/Fm, TKW and PL under the stress conditions and negative strong association of these traits with DH, DM and PH were found (Figure 3), suggesting that it is relatively easy to develop high yielding durum genotypes with increased Fv/Fm and TKW, and decreased heading date and plant stature. No correlation between yield with RWC, SPAD, NSPS and SL was found (Figure 3), which suggests that grain yield could potentially be improved without decreasing these traits under the drought stress conditions. The negative association of YLD and Fv/Fm with heading date, PH, DM and CT (Figure 3) showed that genotypes with high grain yield, high Fv/Fm, and relatively high TKW and PL values tended to flower earlier than other genotypes and were shorter in stature under the drought stress conditions. The results indicated that the grouping of traits under the drought conditions was not consistent from year to year, and the performance of genotypes was influenced by year (Table 2 and Figures 2 and 3).
However, drought stress is the most prevalent environmental factor limiting crop productivity, and global climate change is increasing the frequency of severe drought conditions. During plant vegetative phase, the yield reduction due to drought was smaller than that during the reproductive phase, e.g., grain filling (Barnábas et al., Reference Barnábas, Jäger and Fehér2008; Fischer et al., Reference Fischer, Fukai, Kumar, Leung, Jongdee, Monneveux and Ribaut2011; Monneveux et al., Reference Monneveux, Jing and Misra2012). Since most of the carbohydrate in wheat grains is derived from post-anthesis photosynthesis (Evans et al., Reference Evans, Wardlaw, Fischer and Evans1975), potential yield loss due to drought during vegetative stage is usually small. Some exceptions exist, however, when water stress inhibits spike development and therefore storage capacity (Evans et al., Reference Evans, Wardlaw, Fischer and Evans1975). Early heading and a shorter vegetative phase can be very important for the wheat production under the terminal drought conditions as this can minimize exposure to dehydration during the sensitive flowering and post-anthesis grain filling periods. However, a gradual shift toward early flowering has been observed over the last century of wheat breeding in countries with a Mediterranean-type climate and frequent terminal drought. This trend is predicted to continue for the wheat production in the coming years in response to global climate warming (Shavrukov et al., Reference Shavrukov, Kurishbayev, Jatayev, Shvidchenko, Zotova, Koekemoer, de Groot, Soole and Langridge2017).
In conclusion, there is large variability in phenology, physiological and agronomic traits among the durum wheat genotypes. Among the breeding lines, there was enough genetic diversity for phenological (DH), physiological (RWC, Fv/Fm, SC) and agronomic aspects (YLD, TKW and PH) for improvement in durum wheat breeding program. Among physiological traits, CT was highly variable among genotypes across years suggesting options for water use, drought adaptation and mitigation. G2 and G3 had high CT without yield penalty, suggesting lower water use and higher tolerance to limited moisture and high air temperatures. The breeding lines were superior to checks in their agro-physiological characteristics, indicating that they would be useful for selection in durum wheat breeding program. The development and release of high yielding genotypes with good agronomic attributes and adaptation to drought-prone environments could support the expansion of the durum wheat area in Iran. Based on across-year analyses, Fv/Fm, TKW, heading date, plant height and CT are the most important traits for indirect selection of durum wheat genotypes for drought tolerance.
Acknowledgements
The authors thank the two anonymous reviewers and the editor of Experimental Agriculture for provided helpful comments and corrections on earlier drafts of this manuscript.