


INTRODUCTION
The standard of accountability is the set of expectations developed by human rights monitoring organizations about the specific responsibilities that governments around the world have, and ought to meet, with respect to the treatment of individuals. It is also the core concept from a theory about how the organizational structures and procedures of human rights monitoring organizations produce information about state behaviors over time (Fariss Reference Fariss2014). In short, the standard of accountability continues to evolve as activists, lawyers, jurists, norm entrepreneurs, regional human rights courts, NGOs, IGOs, government agents, and other actors call attention to state behaviors, create innovative legal arguments, and build new institutions designed to protect the rights of individuals (e.g., Brysk Reference Brysk1994; Clark Reference Clark2001; Dancy and Fariss Reference Dancy and Fariss2017; Sikkink Reference Sikkink2017). If the standard of accountability has meaningfully changed over time, then the categorized variables from human rights documents will mask real improvements in human rights over time (Fariss Reference Fariss2014, Reference Fariss2018a, Reference Fariss2018b).
In a critique, Cingranelli and Filippov (Reference Cingranelli and Filippov2018) question whether the standard of accountability is changing and whether data on mass killings are part of the same conceptual process of repression as other human rights abuses such as torture and political imprisonment. The authors base their argument on a mischaracterization of the theory from Fariss (Reference Fariss2014). Summarizing the theory, Cingranelli and Filippov (Reference Cingranelli and Filippov2018, 1085) state that “[h]uman rights scores may be inconsistent over time, because: (a) human rights reports have gotten longer, and more information, by itself, may have influenced coders to assign lower scores; (b) coders may have applied more stringent standards in more recent years; and (c) there may be new types of critiques included in more recent reports.” By focusing on how political scientists code documents, Cingranelli and Filippov (Reference Cingranelli and Filippov2018) misunderstand that the standard of accountability is about the original documentation process by monitoring organizations and not the academic coding process.Footnote 1
The theoretical distinction between actors (document producers versus academic coders) is important for making conceptual distinctions between different indicators of repression and when introducing modifications to latent variable models. Building on the mischaracterization of the theory of standard of accountability, Cingranelli and Filippov (Reference Cingranelli and Filippov2018) make two related claims that they use to justify two alternative latent variable modeling decisions. First, the coding process for all the existing human rights data is potentially affected by the standard of accountability. Second, data on mass killings are not part of the same underlying concept of repression as other human rights abuses such as torture and political imprisonment and should be considered independently. Cingranelli and Filippov (Reference Cingranelli and Filippov2018) use these claims to suggest that the latent variable models of human rights presented by Fariss (Reference Fariss2014) are misspecified. Then, using the estimates from one alternative latent variable model specification that includes all variables and one that includes only standards-based variables, Cingranelli and Filippov (Reference Cingranelli and Filippov2018) conclude that human rights are not improving over time.
I first discuss the critique of the standard of accountability as it relates to the documentation process conducted by monitoring organizations that generates qualitative reports and the coding process conducted by academics that generates categorical data from those reports. I also discuss the use of evidence from data on mass killings in conjunction with data on other forms of human rights abuse. These discussions are important because they form the theoretical justification for the different latent variable model specifications presented in Fariss (Reference Fariss2014) and here. Second, I present a simulation, which illustrates the identification problem in latent variable models where all of the item-difficulty parameters vary year-to-year. The evidence from the simulations demonstrates that the model suggested by Cingranelli and Filippov (Reference Cingranelli and Filippov2018) is not identified with respect to time because it resets the yearly average of the latent variable to zero no matter the values of the data. Relatedly, randomly generated data, as presented by Cingranelli and Filippov (Reference Cingranelli and Filippov2018), do not meaningfully change latent variable model estimates because the simulated values only add random noise to the models, which average out to zero each year. Third, I present an updated version of the latent variable model of human rights and use construct validity and posterior predictive evidence to compare the two original models presented in Fariss (Reference Fariss2014) and the alternative version presented by Cingranelli and Filippov (Reference Cingranelli and Filippov2018). These validity assessments show the substantive consequences of not accounting for time in a substantively meaningful way. Fourth, I present yearly estimates from several additional latent variables models, which are based on different subsets of the available human rights variables (see Appendix A). Nearly all models, with the exception of models that contain information about torture derived from the US State Department reports, show an improving trend in human rights. These new model comparisons reveal which variables are driving the differences between estimates from the changing standard of accountability model and its alternatives. These new results are also consistent with new expert-coded human rights data from VDEM (Coppedge et al. Reference Coppedge, Gerring, Lindberg, Teorell, Pemstein, Tzelgov, Wang, Glynn, Altman, Bernhard, Fish, Hicken, McMann, Paxton, Reif, Skaaning and Staton2014), which validates the conclusion that human rights are improving over time. Overall, what this evidence demonstrates is not that the improving yearly average of human rights in (Fariss Reference Fariss2014) is being driven by large-scale event-based indicators, but rather, that certain standards-based variables are masking the yearly improvements across many indicators (see Appendix B) and the latent variables estimates because monitors are increasingly likely to observe and report insistences of torture and ill-treatment in more recent years. Additional details are presented in the supplementary material Appendix Sections A–J.
CONCEPTUAL FOUNDATIONS FOR HUMAN RIGHTS LATENT VARIABLES
The Documentation Process and Coding Process of Human Rights
The goal of measurement is to define an operational procedure that takes information and creates data free from conceptual (translational) error and measurement error (Fariss and Dancy Reference Fariss and Dancy2017). A categorization process such as the Political Terror Scale (PTS) (Gibney et al. Reference Gibney, Cornett, Wood, Haschke, Arnon and Pisanò2017) or the CIRI human rights project (Cingranelli and Richards Reference Cingranelli and Richards1999) is an operational procedure designed to be consistently applied to human rights documents in order to categorize aggregated country-year human rights practices. Fortunately for these academic teams, large-scale monitoring efforts systematically produce yearly human rights reports that are publicly available and cover nearly every country in the world. The political science teams that work to categorize the information contained in these human rights reports can take advantage of the fact that these reports are produced using a standardized process each year. This is what the human rights community means when they refer to the PTS and CIRI variables as standards-based. Conceptually, it is important to note that these standards are not in reference to the coding procedures used to code the data but rather the standardized procedures used by the monitoring organizations to produce the human rights reports each year. It is this standardized information which is then used by the political science teams to categorize information into human rights data. But what if the standards used to produce the primary source human rights documents change?
The theory of the standard of accountability helps answer this question because it is focused on the organizational structures and procedures that are developed and implemented to document human rights abuses by monitoring organizations such as Amnesty International and the US State Department. The PTS and CIRI teams have very little input into these organizational processes. The categorical indicators coded from the reports are manifest of a complex process that begins with the human rights abuses themselves, the observation, collection, and corroboration of allegations about those human rights abuses, the organization of those allegations into a structured narrative account contained within the country reports, and finally the coding/categorization process of that content by academics. To compare categorical values, the CIRI and PTS teams must assume that the processes that build up to the publication of the human rights reports are constant for each report, in every year and for every country, and that variation in the content of each report is only attributable to differences in the underlying human rights condition for each country-year unit. Though the categorized values coded from the human rights reports by PTS and CIRI reliably reflect the content of the human rights reports, these values are not able to directly capture any differences in the processes that lead up to their publication.
The theoretical distinction between actors (document producers versus academic coders) is important for making conceptual distinctions between different indicators of repression and when introducing modifications to latent variable models. In order to justify the specification of their alternative latent variable model, Cingranelli and Filippov (Reference Cingranelli and Filippov2018, 1087) suggest that the changing standard of accountability can affect the coding process of the events-based variables. They suggest that “[t]here is a higher likelihood now that mass killings in remote places will be recorded. Coding rules for recording mass killings may be changing. Coders may have applied more stringent standards in more recent years. And coding rules across mass killing recording projects may be becoming more or less consistent with one another.”
These variables cover specific forms of repression, mostly related to state-sanctioned killing: mass killings, mass repression, genocide, politicide, executions, negative-sanctions, or one-sided government killings. The standard of accountability likely affects the documentation used to code these variables as well. However, unlike the CIRI, PTS, Hathaway, and ITT data projects, the event-based variables are not direct categorizations of documents but rather are binary indicators that are coded 1 if sufficient documentary information exists in the historical record to support such a categorization. For the standards-based variables, the documents are directly categorized. Because the documents are never updated or revised, the standards-based variables are rarely updated. For the event-based variables, documentary evidence is taken from multiple sources and used to look for evidence that a particular type of repressive event occurred. If new documentary evidence emerges about a specific type of repressive event, the categorized value for the country-year unit is updated. Thus, these are fundamentally distinct categorization processes. The first categorization process relies exclusively on the content from the individual country-year report. The second relies on a set of documents and, for many of the variables considered in this paper, is updated and repeated when new information enters the historical record. The event-based categorization process is therefore able to address variation in the underlying documentation processes that generates information because these variables are each based on set of different documents and are updated periodically. The standards-based coding process cannot directly account for this variation.
Fariss (Reference Fariss2014) does not argue that mass killing are recorded more accurately than other forms of violations in any particular documentary source, when that documentary source is produced. Rather, the distinction between standards-based and events-based variables in Fariss (Reference Fariss2014) is about how the documentary evidence is used to create categorical data. Fariss (Reference Fariss2014) distinguishes between the direct categorization of the documentary evidence (standards-based variables) and the broader use of documents to find evidence of a specific type of event. It need not be the case that large scale events are recorded more accurately in the historical record than other violations because evidence for many repressive events does not necessarily enter the historical record as they are occurring. It is therefore important to continue to update the historical source material used to create event-based categorical variables as all of the events-based coding teams have done a various points in time (e.g., Eck and Hultman Reference Eck and Hultman2007; Harff Reference Harff2003; Harff and Gurr Reference Harff and Gurr1988; Rummel Reference Rummel1994; Taylor and Jodice Reference Taylor and Jodice1983). The difference between the specification of the constant standard model and the changing standard model presented in Fariss (Reference Fariss2014) is based on the difference in how these two types of variables are categorized. The standard of accountability is likely changing all of the documentary evidence used by the different coding teams but the event-based variables are categorized using many sources and updated over time, which helps to account for bias from particular sources. This makes the event-based variables suitable to act as a baseline for comparison with the standards-based variables that do not share this feature.
The Concept of Physical Integrity Rights: One or Two Dimensions?
Cingranelli and Filippov (Reference Cingranelli and Filippov2018) also suggest that large-scale killing events are a distinct repertoire of state-sanctioned repression in comparison with other forms of physical integrity abuses such as political imprisonment, and ill-treatment and torture because governments adopt different tactics to implement these polices. As such, they should be treated as independent dimensions in analysis. However, these types of repressive practices are conceptually and empirically related to state-sanctioned practices that are associated with disappearances, extra-judicial killings, and the large-scale occurrence of killings as well. This theoretical understanding forms the basis for the primary conceptual definition of “repression” or violations of “physical integrity rights,” which include arrests and political imprisonment, beatings and torture, extrajudicial executions, mass killings, and disappearances, all of which are practices used by political authorities against those under their jurisdiction.
This argument by Cingranelli and Filippov (Reference Cingranelli and Filippov2018) is similar to the one made by McCormick and Mitchell (Reference McCormick and Mitchell1997), who argued that physical integrity rights should be considered along two dimensions: killing and disappearances, which often end in death, and torture and political imprisonment, which are about the treatment of the living. In the article that introduced the four CIRI physical integrity variables, Cingranelli and Richards (Reference Cingranelli and Richards1999) argued against the two-dimensional conceptualization and used a statistic from Mokken (Reference Mokken1971) to demonstrate the indicators of these four types of physical integrity violations scale together along one dimension.
The scaling result from Cingranelli and Richards (Reference Cingranelli and Richards1999) is supported by additional evidence about the relationship between all of the CIRI variables presented by Fariss and Schnakenberg (Reference Fariss and Schnakenberg2014), which shows a high degree of complementarity and no evidence of substitution between the four physical integrity rights at the aggregate country-year level, and in Schnakenberg and Fariss (Reference Schnakenberg and Fariss2014), which provided additional validation of the scalability of the four physical integrity variables. Finally, Fariss (Reference Fariss2014) discusses a multidimensional IRT model in the appendix of that article and finds no empirical support for a second dimension from the 13 indicators considered in that article. In summary, contrary to the argument from McCormick and Mitchell (Reference McCormick and Mitchell1997) and now from Cingranelli and Filippov (Reference Cingranelli and Filippov2018), there is no empirical evidence from Cingranelli and Richards (Reference Cingranelli and Richards1999), Fariss and Schnakenberg (Reference Fariss and Schnakenberg2014), or Schnakenberg and Fariss (Reference Schnakenberg and Fariss2014) that repressive tactics scale on more than one dimension at the country-year level of aggregation. This does not mean that, below the country-year level of aggregation, substitution between repressive practices might be occurring or that different tactical choices are associated with specific forms of repression, which is consistent with the argument about violence in Colombia from Guitiérrez-Sanín and Wood (Reference Guitiérrez-Sanín and Wood2017). It only means that empirically, these physical integrity variables are conceptually related and are useful for scaling and comparing country-year units.
It is important to further consider the aggregation of government policies or tactics as they relate to the use and observability of different forms of repression. Substantively, there is substantial evidence that certain forms of human rights abuses, what Cingranelli and Filippov (Reference Cingranelli and Filippov2018) label “lesser forms of abuse,” were under-reported in earlier periods, particularly during the periods when more egregious forms of abuse were prevalent. If the presence of one repressive tactic reduces the probability that another tactic is observed by a monitoring organization or dampens the retribution faced by a leader caught using the tactic, those tactics may be complements, which makes observing each type of abuse difficult as the scale of other abuses increases (Fariss and Schnakenberg Reference Fariss and Schnakenberg2014). This is consistent with Brysk (Reference Brysk1994, 681), who argues that “[i]ncidents of kidnapping and torture which would register as human violations elsewhere did not count in Argentina. The volume of worse rights abuses set a perverse benchmark and absorbed monitoring capabilities.”
This logic implicates how the documentation of abuses occurs in respectful cases. For example, the CIRI human rights project codes the highly transparent case of Sweden as a state that uses ill-treatment and torture every year since 2005 (Eck and Fariss Reference Eck and Fariss2018). What the insights from Brysk (Reference Brysk1994) and Eck and Fariss (Reference Eck and Fariss2018) reveal is that certain forms of abuse are relatively easier to observe when the overall level of human rights abuse is low but relatively more difficult to observe when the overall level of human rights abuse is high. This is because monitoring capacity is not limitless but is increasingly effective as the volume of abuses decreases. This seems to be especially the case for documenting instances of ill-treatment and torture.
As a tactic, torture and ill-treatment may be intended to extract information from some individuals, whereas it may be used to the intimidation of others. Though the goals of torture or the ability of the state to structure institutions that completely eliminate the practice likely vary, the overall aggregation of information about the practice at the country-year level is empirically related to other instances of physical integrity abuse (Brysk Reference Brysk1994; Eck and Fariss Reference Eck and Fariss2018). Thus, it is more difficult for monitoring organizations to detect torture in comparison with the other forms of physical integrity rights abuse as the scale of abuses increases. Below, I demonstrate that, consistent with this logic, information on torture and ill-treatment derived from the State Department reports is the most sensitive to the changing standard of accountability relative to the other event-based data but also all of the other standards-based categorical indicators as well.
SIMULATION ANALYSIS: CONSTANT DIFFICULTY PARAMETERS COMPARED TO TEMPORALLY VARYING DIFFICULTY PARAMETERS
Cingranelli and Filippov (Reference Cingranelli and Filippov2018) charge that Fariss (Reference Fariss2014) failed to assess the assumptions of the two latent variables models. To support this claim, Cingranelli and Filippov (Reference Cingranelli and Filippov2018) create random-ordered categorical variables and reestimate the latent variable model with these simulated variables in place of the standards-based variables. They wish to draw the inference that the standards-based variables do not provide meaningful information by comparing yearly mean point estimates. But this inference is not valid. Because the simulated data are not generated from any underlying model related to the other data, Cingranelli and Filippov (Reference Cingranelli and Filippov2018) have just added random noise to the estimates. Unfortunately, there is nothing we can learn from this simulation other than what the unchanged events-based variables already show. Though adding random data to the units in the latent variable model will randomly shift the position of some units, it will not change the average for these units in each year.
Relatedly, Cingranelli and Filippov (Reference Cingranelli and Filippov2018) state that Fariss (Reference Fariss2014, 1083) relies on “stringent assumptions,” which “heavily weighted rare incidents of mass killings such as genocide.” This is incorrect. The latent variable models in Fariss (Reference Fariss2014) incorporate the event-based variables in exactly the same way across specifications. The standards-based variables are treated differently, but it is not through the item-weights, but rather through their item-difficulty parameters. The term item-weights is usually used to describe the item-discrimination parameters in the IRT models, which are analogous to slope parameters in a logit or ordered-logit, whereas the item-difficulty parameters are analogous to intercepts or cut-points. The assertion made by Cingranelli and Filippov (Reference Cingranelli and Filippov2018) is misleading for two reasons: first, because they do not clearly discuss which of the parameters they are criticizing, and second, because they provide no evidence to support their claim about the size of either the item-difficulty or item-discrimination parameters.
The country time-series plots that Cingranelli and Filippov (Reference Cingranelli and Filippov2018) provide are discussed without any systematic statistical analysis. Contrary to their claim, the evidence in these graphs supports the use of both the events-based and standards-based data to measure the same theoretical concept of physical integrity because they are strongly related even though they are estimates from different sets of human rights variables. Thus, each of the standards-based variables provides meaningful information for the placement of each of the country-year units relative to all the others (see Appendix C). The rest of the evidence for the Cingranelli and Filippov (Reference Cingranelli and Filippov2018) critique is based on the estimates from two alternative latent variable models that show that human rights have not improved. However, the first of these alternative models is not identified with respect to time, which makes the latent variable estimates from this model not comparable year-to-year (country comparisons within years are possible).
I demonstrate this issue with a simulation. I set the number of units N = 30, the number of time periods T = 10, and the number of binary items J = 5. The simulation takes an initial draw from θ, the latent variable for each unit: θ t,1 ∼ N(−2, 1). It takes the remaining draws from θ i,t ∼ θ n,t−1 + c t + N(0, σ), where c t is a constant value for each time period so that the average value of θ t increases by  ${4 \over 9}$ over the 10 time periods, which beings at −2 and ends at 2. The innovation standard deviation is set to σ = 0.05, which approximates this parameter from Schnakenberg and Fariss (Reference Schnakenberg and Fariss2014). J = 5 item-difficulty parameters are set to α j = 0 and the item-discrimination parameters are set to β j = 1. The following data-generating process generates the simulated items for each unit: y i,t,j ∼ Bernoulli(Φ(2(α j + β jθ i,t))) where Φ is the cumulative distribution function of the standard normal distribution (Reuning, Kenwick, and Fariss Reference Reuning, Kenwick and FarissForthcoming).
I estimate posterior distributions for the latent variables with the simulated data in six models. The first model is a dynamic latent variable model with a single, fixed or constant difficulty parameter that is estimated for each of the items (α j). This model matches the constant standard model from Fariss (Reference Fariss2014). The other models are also dynamic but with a set of difficulty parameters (α t,j) which are allowed to vary for each of the 10 time periods. For these models, α t,j parameter is estimated for each of the 10 time periods for 1, 2, 3, 4, or all 5 items, while only a single α j parameter is estimated for the remaining item(s) (i.e., one constant α j parameter is estimated for 4, 3, 2, 1, or 0 items, respectively). The model that estimates the varying difficulty parameters for all 5 items (0 constant) matches the setup of the all-varying standard model proposed by Cingranelli and Filippov (Reference Cingranelli and Filippov2018). The models in between are similar to the changing standard of accountability model (Fariss Reference Fariss2014).
Figure 1 plots the true mean for each time period from the simulated data in dark points. The gray bars represent the estimated posterior distribution for each time period mean. The model in the top left is estimated with constant item-difficulty parameters, which is analogous to a standard dynamic latent variable model (dynamic with respect to the latent trait for each unit but constant or fixed with respect to each item-difficulty parameter). The model on the lower right side is estimated with time-specific item-difficulty parameters for all items, which is analogous to the model proposed by Cingranelli and Filippov (Reference Cingranelli and Filippov2018). This model is not identified with respect to time because it centers the mean for the units in each time period at zero, which makes it impossible to make over time comparisons of the latent variables estimated from the model on the right. Any latent variable model that allows all the item-difficulty parameters to vary over time will behave in this way. As long as the item-difficulty parameter for at least one item is constant, the model recovers evidence for the change over time. Note in this simulation, the observed data are increasing on average because they are generated from a latent trait that is increasing over the 10 time periods, which is not the case for the standards-based human rights data (Fariss Reference Fariss2014).
FIGURE 1. Simulation of Latent Variable Model Specifications
The dark points represent the true mean for each time period from the simulated data. The gray bars represent the posterior distribution for each time period mean from the models. The model on the lower right side is estimated with a time-specific item-difficulty parameter for every item. This model is not able to estimate the over time change because there are no observed indicators used to relate the latent estimates year-to-year. The model is therefore forced to center the mean for the units in each time period at zero. All of the other models are identified with respect to time, which makes it possible to make over time comparisons of the latent variables estimated from these other models.
Figure 2 demonstrates the ability of the models to estimate the latent mean across time periods as the number of constant item-difficulty parameters decreases to zero [the all-varying model proposed by Cingranelli and Filippov (Reference Cingranelli and Filippov2018)]. Like the other four models in Figure 1, the latent variable model that incorporates the changing standard of accountability is specified by allowing some of the item-difficulty parameters to change over time but not all of them. Unlike the all-varying difficulty parameter model however, such a model is identifiable with respect to time because it allows only some of the difficulty parameters to vary over time while keeping half of these parameters fixed or constant. The changing standard of accountability can only be accounted for when information that it influences is assessed in relation to the information generated consistently over time. The model does this by assessing the yearly frequency of some of the standards-based variables to the overall frequency of the events-based variables.
FIGURE 2. Correlation Between Estimate Latent Trait and Simulated Trait
Each bar corresponds to each of the models presented in Figure 1. The model on the right most side is estimated with a time-specific item-difficulty parameter for every observed item and is similar to the model suggested by Cingranelli and Filippov (Reference Cingranelli and Filippov2018). This model is not able to estimate the over time change because there are no observed indicators used to relate the latent estimates year-to-year. Increasing the number of constant difficulty-parameters relative to the number of varying difficulty parameters is useful because it increases the amount of information used to relate the estimates of the latent trait across time periods.
COMPARING ESTIMATES FROM THREE LATENT VARIABLE MODELS
To estimate the latent variable model, each item or categorized human rights variable is linked to the latent trait—the relative level of human rights respect of one country-unit relative to all the others—using a generalized linear function. The latent variable model places each of the country-year units relative to one another along a single interval-level dimension with a score of 0 acting as the global average for all country-year units. All country-year units are placed relative to this average. The model proposed by Cingranelli and Filippov (Reference Cingranelli and Filippov2018) also places each of the country-year units relative to one another along a single interval-level dimension with a score of 0 acting as the mean for each year, which contrasts with the other latent variable models that have a global mean for units across all years. Units are not comparable between years for this model specification. The all-varying standard model produces a flat trend line which, by coincidence, is similar, to the trend of the constant standard model from Fariss (Reference Fariss2014). This similarity occurs because, in the all-varying standard model, it is not possible to estimate a change over time and, in the constant standard model, there is not a change over time due to the influence of the standards-based variables. Table 1 summarizes the specification of parameters for three competing models. Figure 3 displays the distribution of the latent variable point estimates for three models.
TABLE 1. Summary of Prior Distributions for Latent Variable and Model Level Parameter Estimates


FIGURE 3. Distributions of Point Estimates From Three Competing Models
The interquartile range is contained within the boxes with the median value at the center line. The dashed lines represented the values beyond the interquartile range (plots do not incorporate uncertainty). The model proposed by Cingranelli and Filippov (Reference Cingranelli and Filippov2018) (left) produces a very similar trend to the constant standard model from Fariss (Reference Fariss2014) (middle) because in the Cingranelli and Filippov (Reference Cingranelli and Filippov2018) model it is not possible to estimate a change over time. In the constant standard model, there is not a change over time because of the influence of the standards-based variables. Because the model proposed by Cingranelli and Filippov (Reference Cingranelli and Filippov2018) resets the mean estimate for all the countries each year, the mean estimate can never move away from zero. Small changes year-to-year are due to new states that enter the dataset in the later years.
Correlation between Latent Variable Estimates
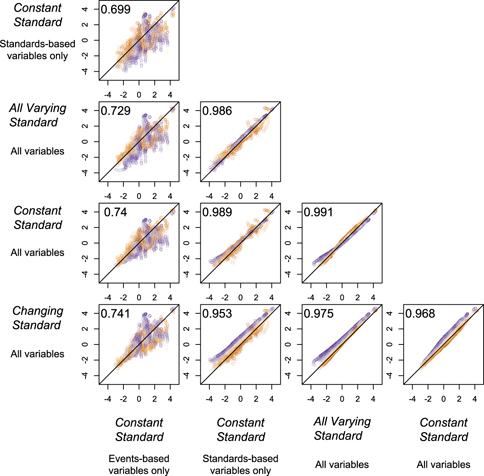
Cingranelli and Filippov (Reference Cingranelli and Filippov2018) argue that the event-based variables are responsible for most of the variation in the latent variable estimates. However, the standards-based variables provide more information than the event-based variables. Moreover, all of the latent variable models, even the ones based on only some of the observed variables, are strongly related to one another. Figure 4 demonstrates high levels of agreement between estimates. This is because most of the variation in the human rights indicators is cross-sectional. Key differences emerge when considering temporal variation as the simulation from above reveals. Cingranelli and Filippov (Reference Cingranelli and Filippov2018, 1086) present one of these relationships, reporting the squared correlation from a bivariate linear regression. They use this statistic to suggest that the estimates from the latent variable generated from only the event-based variables explain most of the variance in the latent variable from the model that uses all the variables. This is not what the correlation coefficient here reveals because each of the different latent variables is not independent of one another (even when they are estimated with non-overlapping sets of human rights variables). The high correlation between the different latent variable estimates occurs because each of the indicators is manifest of the same underlying concept. Though not reported by Cingranelli and Filippov (Reference Cingranelli and Filippov2018), the correlation coefficient is smaller than the same statistic from a latent variable model that is based on just the standards-based variables and the latent variable based on all of the items. This is because there are more standards-based variables than event-based variables and because there are more categories for each of the standards-based variables than for the events-based variables, which all happen to be binary. Because the event-based variables and standards-based variables are both capturing evidence of the same underlying physical integrity concept, they are all related and strongly correlated. Even constant standard models that use only events-based variable or standards-based variables (but not both) are strongly correlated, which evidences that all variables are tapping into the same underlying theoretical concept. Appendix E discusses additional issues of construct validity, and Appendix F discusses why the latent variables estimates from 1946 to 1975 are not from an extrapolation or interpolation.

FIGURE 4. Correlation between Latent Variables Estimates from Five Models
Correlations between five different latent variable estimates reveals a high level of agreement between the different model specifications including models with only events-based or standards-based variables. The x-axis and y-axis are the latent variable estimates from the row and column latent variables estimates. Though substantively meaningful differences exists between time periods for these estimates, the high level of agreement between estimates indicates that each latent variable estimate is tapping into the same underlying concept of physical integrity abuse. Even constant standard models that use only events-based variable or standards-based variables (but not) both are strongly correlated, which is evidence that all of these variables are tapping into the same underlying concept. Note that, for the period 1946–75, the correlation between the latent variable point estimates based on just the event-based item and the latent variable point estimates based on all of the items is approximately one because there are not standards-based variables as part of the model until 1976.
Identifying the Top One Percent Worst Cases
To assess the validity of the three competing models (all-varying standard, constant standard, and changing standard), I consider the ability of the latent variable estimates from each model to categorize the worst 1% of country-year cases each year. Figure 5 shows that the model proposed by Cingranelli and Filippov (Reference Cingranelli and Filippov2018) suggests that the worst cases of human rights abuse are happening in the most recent years for which we have data, while both the constant standard model and changing standard of accountability model suggest that earlier decades contain the worst cases of abuse.

FIGURE 5. Concurrent Validity Assessment of the Top One Percent Worst Cases of Human Rights Abuse
Stacked units in the barplot are the country-years that have the 1% worst scores from three models (all-varying model, constant standard model, changing standard model). The constant standard model and changing model are in close agreement about which cases are in the top 1% worst.
The top 20 worst cases for the Cingranelli and Filippov (Reference Cingranelli and Filippov2018) model are Sudan 1999–2015 and Syria 2013–15. These are indeed cases with poor human rights practices; however, compare these cases with those identified by the changing standard of accountability model: China 1968–71; Uganda 1976; Afghanistan; 1980–87; Sudan 1959, 1965–66; and Iran 1982–85. The constant standard model and changing standard model are in close agreement about which cases are in the top-1% worst because they are specified with respect to time. A binary indicator for whether or not the case falls in this worst case category for these two models correlates at about 0.85. The same indicator for the all-varying model correlates with either the constant standard model or changing standard model at about 0.50 or 0.43, respectively. The all-varying standard model leads to an inference that the worst levels of human rights abuse have just occurred. Though a careful analysis of each case is beyond the scope of this article, it is important to highlight that the cases selected by the Cingranelli and Filippov (Reference Cingranelli and Filippov2018) model are artifacts of the resetting of the mean to zero for each year of estimates. The worst cases today are forced further down into the negative portion of the latent variable space because these positions are not estimated relative to the units in previous years but only the units in the same year. If there are more good or mediocre cases in a given year, then the bad cases need to be placed further away from the mean zero to give space to these other cases. The all-varying standard model proposed by Cingranelli and Filippov (Reference Cingranelli and Filippov2018) leads to an inference that the worst levels of human rights abuse have just occurred or are possibly even yet to come because it is not identified with respect to time.
Posterior Predictions of the Yearly Means for Human Rights Variables
Figure 6 displays the differences in correlation coefficients calculated between the yearly mean for each of the 16 human rights variables and the estimated yearly mean of one of the three latent variables. The positive differences demonstrate the greater explanatory ability of the changing standard of accountability model relative to the all-varying model and constant standard model. The all-varying standard model does poorly because it resets the mean value of the latent estimate to zero each year, so it is unable to account for changes over time for any variables except for the Rummel and Harff and Gurr events-based variables.

FIGURE 6. Spearman Correlation Between Yearly Observed Variable Means and Latent Variable Means
Each panel displays the difference in Spearman correlation coefficients calculated between the yearly mean for the human rights variable and estimated yearly mean of one of the three latent variables. Positive values for either distribution indicate a stronger relationship between the yearly mean for the human rights variable and the estimated mean from the changing standard of accountability model. Negative values indicate a stronger relationship for either the all-varying standard model (left distribution) or the constant standard model (right distribution) compared with the changing standard of accountability model.
Alternative Constant Standard Estimates Show Improvements Over Time
Cingranelli and Filippov (Reference Cingranelli and Filippov2018) report that a model with only standards-based variables shows a stagnant trend in human rights respect over time. This is true. However, not all of the standards-based variables show a stagnant trend in their original categorical form (see Appendix B) or as part of a constant standard latent variable model. To unpack the difference between the yearly averages for the changing standard model and the constant standard model from Fariss (Reference Fariss2014), I estimate alternative versions of the constant standard of accountability model that make use of only the standards-based variables. The first model includes the ITT torture and ill-treatment variable and the CIRI political imprisonment variable, which Fariss (Reference Fariss2014) shows are consistently documented year-to-year relative to the frequencies of the event-based variables included in the standard of accountability model. I then estimate the constant standard latent variable models (one intercept or one set of cut-points per item), adding in new items in the following order: CIRI Disappearance, PTS Amnesty, CIRI Extrajudicial Killing, Hathaway torture, CIRI torture, and finally PTS State Department.
Variables most sensitive to the changing standard of accountability are the CIRI torture, PTS State Department, and Hathaway torture variables. Only when all of these observed variables are included in the estimation of the yearly average of the latent variable, does the trend line flatten out and become stagnant in Figure 7. The reduction in the slope of the latent variable model is similar to the change when the standards-based variables are added to the constant standard model starting with the seven event-based variables in Figure 8. Yearly patterns suggest that the Amnesty International reports are more consistently produced year-to-year than the State Department reports relative to the event-based variables. Within State Department reports, torture is the topic most sensitive to the affects of the changing standard of accountability (see the Appendix D for graphs of the yearly cut-points and probabilities of each category of all of human rights variables). Thus, it may be more difficult for monitoring organizations to detect torture and ill-treatment in comparison with the other forms of physical integrity rights abuse as the scale of other abuses increases (Brysk Reference Brysk1994) and easier as the scale decreases (Eck and Fariss Reference Eck and Fariss2018). Appendix G and Appendix H provide details on case study designs for comparing human rights information.

FIGURE 7. Trends in Latent Variable Estimates for Models Based on Just the Standards-Based Human Rights Variable Over Time Using the Constant Standard Model Specification from Fariss (Reference Fariss2014)
All of the models are estimated with constant item-difficulty cut-points (constant standard of accountability). The baselines models begin with the PTS HRW, ITT torture, and CIRI political imprisonment. These variables change the least relative to the baseline event-based variables (see Figure 4, Figure 5, and Appendix F in Fariss (Reference Fariss2014) for evidence for this ordering). Beginning from the upper left panel, one additional standards-based variable is added to the latent variable model in order: 3 + CIRI Disappearance, 4 + PTS Amnesty, 5 + CIRI Extrajudicial Killing, 6 + Hathaway Torture, 8 + CIRI torture, and finally 9 + PTS State Department.

FIGURE 8. Trends in Latent Variable Estimates for Models Based on the Event-Based Human Rights Variables Over Time with an Additional Standards-Based Human Rights Variable Over Time Using the Constant Standard Model Specification from Fariss (Reference Fariss2014)
All of the models are estimated with constant item-difficulty cut-points (constant standard of accountability). The baselines models begin with the seven event-based variables and then one additional standards-based variables is added in the same order as above and based on Fariss (Reference Fariss2014) (see Appendix D for the statistics that demonstrate the relative strength of the change over time for the standards-based items). Beginning from the upper left panel, one additional standards-based variable is added to the latent variable model in order: 7 items + PTS HRW (not shown for space reasons), 8 items + ITT torture, 9 items + CIRI Political Imprisonment, 10 items + CIRI Disappearance, 11 items + PTS Amnesty, 12 items + CIRI Extrajudicial Killing, 13 items + Hathaway Torture, 14 items + CIRI torture, and finally 15 items + PTS State.
VDEM Human Rights Variables Show Improvement Over Time
Finally, in Figure 9, the VDEM torture and killing variables show a substantial increase in respect after the end of the Cold War, which is discussed in another response to Cingranelli and Filippov (Reference Cingranelli and Filippov2018) (Fariss Reference Fariss2018a). The trend from the VDEM human rights variables are consistent with the latent human right variable that incorporates the changing standard of accountability (Fariss Reference Fariss2018a) and the new trends presented in this section. Appendix I presents the latent variable trends over time for democracies and nondemocracies, and Appendix J reviews the suggestions for using the latent variable estimates in applied research.
FIGURE 9. Yearly Average for the Two Expert-Coded V-DEM Physical Integrity Variables From 1946 to 2015 (Coppedge et al. Reference Coppedge, Gerring, Lindberg, Teorell, Pemstein, Tzelgov, Wang, Glynn, Altman, Bernhard, Fish, Hicken, McMann, Paxton, Reif, Skaaning and Staton2014)
The upward trend in human rights respect after the end of Cold War is consistent with the pattern of the latent variable that accounts for the changing standard of accountability reported in Fariss (Reference Fariss2014). These similar patterns provide evidence of the convergent validity of the latent human rights variable that incorporates the changing standard of accountability.
CONCLUSION
Human rights estimates developed by Fariss (Reference Fariss2014) and extended in this article support the conclusion that human rights practices are improving. These new findings are only possible because of the years of reliable coding conducted by the coding teams discussed above. Until the publication of the theory of the changing standard of accountability and the new latent variable estimates by Fariss (Reference Fariss2014), the academic discourse around human rights progress was becoming increasingly pessimistic (e.g., Hopgood Reference Hopgood2013; Posner Reference Posner2014). This is because, for the past fifteen years, scholars have puzzled over the stagnating trend in country-year human rights and the negative correlation between UN human rights treaty ratifications and human rights (e.g., Hafner-Burton and Tsutsui Reference Hafner-Burton and Tsutsui2005; Hathaway Reference Hathaway2002). But these negative patterns are not valid because they did not account for changes in the source material used to generate the categorical data (Fariss Reference Fariss2014, Reference Fariss2018a, Reference Fariss2018b; Fariss and Dancy Reference Fariss and Dancy2017). Thus, there is reason for new hope, new theorizing, and new data collection, which is the promise of the science of human rights (Schnakenberg and Fariss Reference Schnakenberg and Fariss2014).
SUPPLEMENTARY MATERIAL
To view supplementary material for this article, please visit https://doi.org/10.1017/S000305541900025X.
Replication materials can be found on Dataverse at: https://doi.org/10.7910/DVN/EB8DD8.


Comments
No Comments have been published for this article.