


1. Introduction
Global warming and rising sea levels are two major components of long-term climate change that are highly likely to affect many economic outcomes in the coming decades [see Dell et al. (Reference Dell, Jones and Olken2014)]. However, the magnitude of these long-term economic consequences is uncertain, as the predicted effects of climate change have barely started to materialize. It is indisputable that sea levels and the global mean surface temperature of the world have increased since the beginning of the nineteenth century (by 0.9 °C and by 0.2 m, respectively), and that the process has accelerated since 1980. However, climatologists predict larger changes for the decades ahead. Leaving aside extreme scenarios, temperatures are expected to increase by 1–4° over the twenty-first century, and the sea levels are expected to rise by 0.5–2 m by 2050 [e.g., Rigaud et al. (Reference Rigaud, de Sherbinin, Jones, Bergmann, Clement, Ober, Schewe, Adamo, McCusker, Heuser and Midgley2018)]. Hence, researchers are in uncharted territory and long-term extrapolation of existing empirical estimates is questionable.
In this context, we propose a structural approach to investigate the long-term effects of climate change on the size, skill composition, and dyadic structure of human mobility. Literature to date has mostly looked at the short-term impact of fast-onset variables (weather anomalies, storms, hurricanes, torrential rains, floods, landslides, etc.), as opposed to slow-onset variables (e.g., temperature trends, desertification, rising sea level, coastal erosion, etc.).Footnote 1 By contrast, we focus on long-term climate change, subsumed in temperature and sea level scenarios. Damage from long-term climate change is expected to vary across and within countries according to the proximity of seas and oceans, land topography, industry structure, and initial temperature levels. Empirical estimates consistently show that the impact of climate change on productivity will be greater in agriculture than in manufacturing [e.g., Dell et al. (Reference Dell, Jones and Olken2014); Desmet and Rossi-Hansberg (Reference Desmet and Rossi-Hansberg2015)]. In particular, climate change is expected to negatively affect crop production in low-latitude countries, while inducing much smaller or even positive effects in northern latitudes. Poor countries that have contributed the least to climate change will be the most adversely affected, and migratory pressures—both internal and international—will presumably be strongest in poor countries.
To provide a quantitative economic evaluation of the size and structure of climate migration, we use a micro-founded overlapping generations model of the world economy. The model distinguishes between 179 countries, each with two regions—agricultural and non-agricultural—and two areas per region—flooded and non-flooded. The regional dimension allows us to model sector-specific responses to climate change, including voluntary migration decisions (i.e., decisions driven by economic incentives), while the identification of flooded areas allows us to model forced displacements. Each area is initially populated by two types of natives (college graduates and the less educated) who exhibit heterogeneous migratory behaviors. Their mobility decisions determine the geographic distribution and skill structures of the labor force, productivity, and wage rates.
The essence of our approach is in line with Desmet and Rossi-Hansberg (Reference Desmet and Rossi-Hansberg2015) or Shayegh (Reference Shayegh2017), although we use a different level of spatial aggregation and climate change is exogenously subsumed in the simulation scenario rather than being a result of explicitly modeled mitigation decisions. We also differ in the way we formalize migration decisions. We assume a random utility structure, which allows us to account for the interplay between alternative forms of migration: international, inter-regional (i.e., rural-to-urban), and local (i.e., within a region). We thus explicitly model the choice of the destination country/region/area in a dyadic structure, with both OECD (Organisation for Economic Co-operation and Development) destinations and developing countries. We parameterize our model so as to match socio-demographic and economic moments for the year 2010 or for the period 1980–2010. We use this calibrated model to simulate the trajectory of the world economy under alternative climate change scenarios and under constant migration laws and policies.Footnote 2
We find that climate change reinforces divergence in total factor productivity (TFP) between rich and poor countries, and between urban and rural regions. It thus creates conditions that are conducive to increasing urbanization and international migration. Our baseline scenario corresponds to the mean emissions scenario (termed RCP-4.5) and its mean temperature variant, available from the CCKP (Climate Change Knowledge Portal) [Taylor et al. (Reference Taylor, Stouffer and Meehl2012)].Footnote 3 This scenario can be considered as moderate as it involves mean increases in temperature and sea level of 1.8 °C and 0.47 m, respectively [Stocker et al. (Reference Stocker, Qin, Plattner, Tignor, Allen, Boschung, Nauels, Xia, Bex and Midgley2014)]. For RCP-4.5, our model predicts 29.5, 20.9, and 19.1 million climate migrants in 2040, 2070, and 2100, respectively. This corresponds to a total of about 70 million individuals aged 25–64 years over the course of the twenty-first century (adding dependent children, this means a total of 130 million climate migrants approximately). More than half of these climate-related moves are local (forced displacements) or inter-regional (from rural to urban). Consistently, long-term climate change has a small effect on South–South (S–S) migration (i.e., migration between countries sharing similar climate patterns) and a limited impact on South–North (S–N) migration. This is particularly true for the first half of the twenty-first century. On average, under constant migration laws and policies, climate change induces a 4.6% permanent increase in the number of immigrants living in the OECD countries by 2040, and a 7.2% increase by 2100. Climate-driven pressures on S–N migration are small compared with those induced by the expected socio-demographic changes in developing countries. Importantly, S–N climate migrants are positively selected along the skill dimension, implying that international climate migration is of the brain drain type, and thus reinforces the inequality effects of climate change [Biavaschi et al. (Reference Biavaschi, Burzyński, Elsner and Machado2020)]. The greatest projected income losses are for the poorest workers trapped in the poorest regions (i.e., rural regions in low-latitude countries); climate change increases extreme poverty on the extensive and intensive margins. Given positive selection, relaxing international migration restrictions may exacerbate the brain drain and the poverty response to climate change if policymakers are unable to select/screen the extreme poor.
When doubling the predicted changes in temperature, the number of climate migrants reaches 108 million over the course of the twenty-first century (i.e., an additional 38 million compared with RCP-4.5). This includes 41.1 million people moving from developing to high-income countries, inducing a permanent increase by 9% in the total number of immigrants to OECD countries. This is relatively small given the huge impact of climate change on productivity. When doubling the predicted rise in sea levels, local movements increase by 21 million compared with RCP-4.5, while additional inter-regional and international migration flows are small. Overall, our results suggest that forced displacements due to rising sea levels are mostly local (i.e., from flooded to non-flooded areas within the same region), while inter-regional and international mobility responses are limited and overwhelmingly governed by the TFP responses to temperature changes.
The rest of the paper is organized as follows. Section 2 describes the two-sector, two-skill-group model used to predict the behavioral and market responses to climate change (CLC). We summarize our parameterization strategy in section 3. Section 4 presents the results obtained under various climate scenarios. Section 5 concludes.
2. Model
To estimate the mobility responses to climate change, we set up an overlapping generations model of the world economy that endogenizes the dyadic and skill structures of migration. We model migration decisions as an outcome of a micro-founded, random utility maximization (RUM) model that jointly accounts for the main migration mechanisms through which climate change affects long-term migration. The RUM structure allows us to model the long-term mobility responses to climate change at various spatial scales, taking into account the interplay between alternative forms of migration: specifically local (i.e., very short distance), rural to urban (i.e., short distance), and international (i.e., long distance). Endogenous migration decisions are embedded in a general equilibrium framework with endogenous income distribution. Therefore, the effects of climate change on human mobility, global income inequality, and extreme poverty are jointly determined. Our framework assumes exogenous socio-demographic trends in line with the United Nations median scenario, and does not account for capital and trade. We discuss these assumptions in section 2.4. The model relies purely on a production technology and a migration technology.
More specifically, our model depicts a large set of countries and regions. Countries are denoted byj = 1, …, J, and comprise two regions (a region is equivalent to a production sector in our context) having heterogeneous productivity levels, with r ∈ {a, n} denoting agriculture (a) and non-agriculture (n). The double index jr is used to identify a country-region location. Each region consists of two areas of time-varying size, with the subscript b ∈ {f, d} denoting the flooded area (f) and the non-flooded/dry area (d). Floods are permanent and caused by rising sea levels; they materialize at the beginning of the period. There is no economic activity and no one can live in the flooded area. Hence, we distinguish between individuals who grew up in a region that becomes flooded and were forced to move in adulthood, and those who grew up in a non-flooded region and could choose between staying or leaving. This allows us to distinguish between forced displacements (driven by the sea level rise) and voluntary migration (driven by economic incentives).
Individuals live for two periods (childhood and adulthood). One period represents the active life of one generation (30 years); for simplicity, we ignore the retirement period. Adults are the only decision makers. For each location jr and each period, we distinguish between two types of adults, with s ∈ {h, l} denoting college-educated workers (h) and the less educated (l). This allows us to account for the high degree of heterogeneity in migratory behavior between people of different places of origin and levels of education. We use $N_{b, s, t}^{jr}$ to denote the number of new adults of type s born in the area b of location jr at time t − 1 (i.e., becoming adult at timet). The total native population in location jr is defined as $N_{s, t}^{jr} = N_{d, s, t}^{jr} + N_{f, s, t}^{jr}$
 . Adults maximize their utility by deciding where to live. That is, whether to stay in the region where they grew up (if the area where they were born does not become flooded), to move locally within the same region (if the area where they were born becomes flooded), to emigrate to the other region within the same country, or to emigrate abroad. This choice depends on the livability of the area of origin, on economic disparities across regions and countries, and on the cost of moving. It determines the number of residents in each (non-flooded) location, denoted by $L_{s, t}^{jr}$
 .
.
In this section, we describe our production and migration technologies (sections 2.1 and 2.2), and derive the profit and utility maximization conditions. We then define the world-economy intertemporal equilibrium in section 2.3. We discuss our simplifying assumptions in section 2.4.
2.1 Production technology
The production technology determines the wage rates in each location. Production is feasible only in the non-flooded area of each location jr. Output is proportional to labor in efficiency units, and for simplicity, we assume that firms in both sectors produce the same good. Each location is characterized by a constant elasticity of substitution production function with two types of workers [as in Burzyński et al. (Reference Burzyński, Deuster and Docquier2020); Gollin et al. (Reference Gollin, Lagakos and Waugh2014); Vollrath (Reference Vollrath2009)]. The output level in location jr at time t is given by:

where $A_t^{jr}$ denotes the productivity scale factor in location jr at time t (referred to as TFP henceforth), $\eta _t^{jr}$
 is a sector-specific variable governing the relative productivity of college-educated workers at time t (i.e., a skill bias in productivity), and σ r is the sector-specific elasticity of substitution between the two types of workers. Remember the number of adult workers of type s employed in location jr at time t is denoted by $L_{s, t}^{jr}$
 .
.
The labor market is competitive. Wage rates are determined by the marginal productivity of labor:

It follows that the wage ratio between high-skilled and low-skilled workers in location jr at time t is given by:

where $z_t^{jr} \equiv L_{h, t}^{jr} {\rm /}L_{l, t}^{jr}$ is the skill ratio in employment in location jr at time t.
In our setting, climate change affects production and income differentials through two channels. First, variations in temperature influence TFP in agricultural and in the non-agricultural sector. Second, climate change affects mobility decisions, which in turn impact on the skill ratio in the labor force. To account for these effects, damage functions and technological externalities are factored in. For TFP, we assume that the aggregate TFP level in each sector depends on the temperature level and the average level of workers' education. We thus have:

where γ t is a time trend in productivity that is common to all countries (γ > 1), $\bar{A}^{jr}$ is the exogenous component of TFP in location jr (reflecting specific local factors such as the proportion of arable land, soil fertility, land ruggedness, etc.), $G( {T_t^{jr} })$
 links TFP to temperature $( {T_t^{jr} })$
 , while $F( {z_t^{jr} })$
 is a simple Lucas-type aggregate externality [see Lucas (Reference Lucas1988)] capturing the fact that college-educated workers facilitate innovation and/or the adoption of advanced technologies. We assume $F( {z_t^{jr} } ) = ( {z_t^{jr} } ) ^{\epsilon _r}$
 is a concave function of the skill ratio in employment, where ε r ∈ (0, 1) is the sector-specific elasticity of TFP to the skill ratio in region/sector r of all countries. With regard to the effect of temperature, existing literature suggests that TFP levels in agriculture and non-agriculture can be represented by sector-specific, inverted-U-shaped functions of $( {T_t^{jr} })$
 , as discussed in section 3 [Desmet et al. (Reference Desmet, Nagy and Rossi-Hansberg2018); Shayegh (Reference Shayegh2017)].
With regard to the skill bias, we assume directed technical change that affects different types of workers non-uniformly. As technology improves, the relative productivity of college-educated workers increases, particularly in the non-agricultural sector [Acemoglu (Reference Acemoglu2002); Restuccia and Vandenbroucke (Reference Restuccia and Vandenbroucke2013)]. The observed relative demand shift favors college-educated over non-college-educated labor. We thus have:

where $\bar{\eta }_{jr}$ is an exogenous term and κ r ∈ (0, 1) is the sector-specific elasticity of the skill bias to the skill ratio in sector/region r of all countries.
2.2 Migration technology
To model migration decisions, our RUM model assumes that the utility of moving to a given location is the sum of deterministic and random components. The deterministic part has a logarithmic functional form and depends on the local wage rate at destination and the costs of moving. The random part captures heterogeneity in preferences or in moving costs. Hence, the utility of an adult of type s, born in the area b of a location of origin jr, moving to the (non-flooded) area of a location j′r′ is given by:

where $\ln w_{s, t}^{{j}^{\prime}{r}^{\prime}} \in {\rm {\opf R}}$ is the deterministic level of utility that can be reached in the location j′r′ at period t and $x_{b, s, t}^{jr, {j}^{\prime}{r}^{\prime}} \le 1$
 captures the effort required to migrate from location jr to location j′r′. Migration costs are exogenous; they vary across location pairs and education levels. The individual-specific random taste shock for moving from location jr to j′r′ is denoted by $\xi _{b, s, t}^{jr, {j}^{\prime}{r}^{\prime}} \in {\rm {\opf R}}$
 and follows an i.i.d. type I extreme value distribution with a common scale parameter μ > 0. This scale parameter governs the responsiveness of migration decisions to changes in $w_{s, t}^{{j}^{\prime}{r}^{\prime}}$
 and to $x_{b, s, t}^{jr, {j}^{\prime}{r}^{\prime}}$
 . Although $\xi _{b, s, t}^{jr, {j}^{\prime}{r}^{\prime}}$
 is individual specific, we omit individual subscripts for notational convenience.
It should be remembered that the number of new native adults of type s at time t is denoted by $N_{s, t}^{jr}$ . Depending on the elevation structure of the location and on the sea level rise, part of the location of birth may be flooded at the beginning of the period. If so, a proportion $\Theta _t^{jr}$
 of the native-born population is forced to leave. We label the number of forcibly displaced people as $N_{f, s, t}^{jr} = \Theta _t^{jr} N_{s, t}^{jr}$
 , and the rest of the native population as $N_{d, s, t}^{jr} = ( {1-\Theta_t^{jr} } ) N_{s, t}^{jr}$
 . Only the latter can decide whether to stay in the area of birth. Hence, those who grew up in the non-flooded area of location jr have the choice between emigrating to another region jr′ within the same country (at a cost $x_{d, s, t}^{jr, j{r}^{\prime}}$
 ), emigrating to a foreign country (at a cost $x_{d, s, t}^{jr, {j}^{\prime}{r}^{\prime}}$
 ), or staying. In the last case, they incur no cost associated with moving. This means that $x_{d, s, t}^{jr, jr} = 0$
 .
.
By contrast, individuals who grew up in the flooded area have the option to relocate within the same region (from a flooded to a non-flooded area). They incur a welfare loss that corresponds to a fraction $x_{f, s, t}^{jr, jr} > 0$ of their lifetime utility (which is equivalent to an income loss of $x_{f, s, t}^{jr, jr}$
 percent in our context). They can also emigrate to another region or to another country at the same cost as those who grew up in the non-flooded area (i.e., $x_{f, s, t}^{jr, {j}^{\prime}{r}^{\prime}} = x_{d, s, t}^{jr, {j}^{\prime}{r}^{\prime}}$
 ).
).
We first focus on people who grew up in the non-flooded area (d) of their location of birth. Given their taste characteristics (captured by ξ), each individual chooses the location that maximizes her utility, defined in equation (6). Under the type I extreme value distribution of ξ with a scale parameter μ, McFadden (Reference McFadden and Zarembka1974) shows that the probability of choosing region j′r′ for individuals originating from region jr is governed by a logit expression. Therefore, the emigration rate is given by

Hence, emigration rates are endogenous, destination- and skill-specific, and fall between 0 and 1. The choices of emigrating internally or internationally are interdependent. Staying rates $( M_{d, s, t}^{jr, jr} {\rm /}N_{d, s, t}^{jr} )$ are expressed by a similar logit expression. It follows that the emigrant-to-stayer ratio $( m_{d, s, t}^{jr, {j}^{\prime}{r}^{\prime}} )$
 is governed by:

such that $m_{d, s, t}^{jr, jr} = 1$ .
.
Equation (8) is a gravity-like migration equation, which states that the ratio of emigrants from location jr to location j′r′ to stayers in region jr (i.e., individuals born in jr who remain injr) is an increasing function of the wage rate in the destination location j′r′ and a decreasing function of the utility in jr. The proportion of migrants from jr to j′r′ also decreases with the bilateral migration cost $x_{d, s, t}^{jr, {j}^{\prime}{r}^{\prime}}$ . Labor is not perfectly mobile across sectors/regions; internal migration costs capture all private costs that migrants must incur to move between regions.Footnote 4 Similarly, international migration costs capture private costs as well as the legal/visa costs imposed by destination countries. They are also assumed to be exogenous. Heterogeneity in migration tastes implies that emigrants select all destinations for which $x_{d, s, t}^{jr, {j}^{\prime}{r}^{\prime}} < 1$
 (if $x_{d, s, t}^{jr, {j}^{\prime}{r}^{\prime}} = 1$
 , the corridor is empty).
Individuals raised in the flooded area of location jr (denoted by the superscript f) are forced to move. If they relocate to the non-flooded area of their region of birthjr, they face a local relocation cost equivalent to $x_{f, s, t}^{jr, jr} > 0$ . If they move to another country or region, they will incur the same moving costs as individuals born in the non-flooded area (i.e., $x_{f, s, t}^{jr, {j}^{\prime}{r}^{\prime}} = x_{d, s, t}^{jr, {j}^{\prime}{r}^{\prime}} \;\forall jr\ne {j}^{\prime}{r}^{\prime}$
 ). The local relocation cost influences decisions to emigrate to another region or country. The emigrant-to-stayer ratio $( m_{r^\ast r, s, t}^f )$
 for forcibly displaced people is governed by:

such that $m_{f, s, t}^{jr, jr} = 1$ . In addition, since $x_{f, s, t}^{jr, jr} > 0$
 , $m_{f, s, t}^{jr, {j}^{\prime}{r}^{\prime}} > m_{d, s, t}^{jr, {j}^{\prime}{r}^{\prime}}$
 , forcibly displaced people are more likely to migrate than those who grew up in non-flooded regions.
For simplicity, we assume that international migrants settle in the urban region of their destination country. This choice is guided by the fact that the data used to calibrate the migration technology do not document the region of destination for international migrants. This means that $m_{b, s, t}^{jr, {j}^{\prime}a} = 0$ or, equivalently, $x_{b, s, t}^{jr, {j}^{\prime}a} = 1\;\forall j\ne {j}^{\prime}$
 . We can define the ratio of international emigrants to stayers as:

Once emigrant-to-stayer ratios are determined, we can characterize the equilibrium structure of the resident labor force in (the non-flooded area of) all regions and by education level. We thus have:

2.3 Dynamics and intertemporal equilibrium
The dynamics of the native population are governed by fertility and education decisions. In contrast to Burzyński et al. (Reference Burzyński, Deuster and Docquier2020) and Burzyński et al. (Reference Burzyński, Deuster, Docquier and de Melo2019), we assume that these decisions are exogenous. We use $n_{s, t}^{jr}$ to denote the number of children of parent of type s living in (the non-flooded area of) location jr at time t. We denote by $p_{s, t}^{jr}$
 the proportion of children acquiring a college education. It follows that the dynamic structure of the model is totally recursive. Accordingly, we have:

An inter-temporal equilibrium for the world economy can be defined as follows:
Definition 1 For a set {μ, γ, σ r, ε r, κ r} of common parameters, a set of location-specific exogenous characteristics $\{ {\bar{A}_t^{jr} , \;\bar{\eta }_t^{jr} , \;\Theta_t^{jr} , \;n_{s, t}^{jr} , \;p_{s, t}^{jr} , \;x_{b, s, t}^{jr, {j}^{\prime}{r}^{\prime}} } \}$ , and a set $\{ {N_{s, 0}^{jt} } \}$
 of predetermined variables, an intertemporal competitive equilibrium is a set of endogenous variables $\left\{ {w_{s, t}^{jr} , \;A_{r, t}, \;\eta_t^{jr} , \;m_{d, s, t}^{jr, {j}^{\prime}{r}^{\prime}} , \;m_{f, s, t}^{jr, {j}^{\prime}{r}^{\prime}} , \;L_{s, t}^{jr} , \;N_{s, t + 1}^{jr} } \right\}$
 , that simultaneously satisfies profit maximization conditions and technological constraints (2), (4) and (5), utility maximization conditions (8) and (9) in all countries and regions of the world, and such that the equilibrium structure and dynamics of population satisfy equations (11) and (12).
2.3 Caveats and value added
Our model inevitably omits a number of features. First, it abstracts from physical capital accumulation. Assuming production is proportional to labor expressed in efficiency units is equivalent to assuming a constant capital-to-labor ratio [i.e., Burzyński et al. (Reference Burzyński, Deuster and Docquier2020); Delogu et al. (Reference Delogu, Docquier and Machado2018); Kennan (Reference Kennan2013); Klein and Ventura (Reference Klein and Ventura2009)]. Such a condition holds in the context of a small open economy with perfect mobility of capital between countries and regions, or on the long-run balanced growth path of a closed economy model. This assumption is in line with the time structure of our model (one period represents about 30 years), acknowledging that we disregard the effects induced by potential variations in the worldwide level of the capital-to-labor ratio.
Second, the model abstracts from trade. Assuming that firms in the two sectors produce the same good, the model disregards variations in the relative price of the agricultural good. In a context with heterogeneous goods, variations in the relative price of the agricultural good would mitigate or reinforce the urbanization process. In their benchmark scenario, Desmet and Rossi-Hansberg (Reference Desmet and Rossi-Hansberg2015) show that changes in relative prices are small. In addition, Burzyński et al. (Reference Burzyński, Deuster and Docquier2020) show that migration and inequality responses to various types of shocks are quantitatively similar when considering that agricultural and non-agricultural goods are identical or imperfect substitutes as in Boppart (Reference Boppart2014).
Third, we assume that fertility and education decisions are exogenous, which basically means that the dynamics of the size and structure of before-migration populations are assumed to be independent of climate change. Richer results with endogenous population movements can be found in a companion working paper [Burzyński et al. (Reference Burzyński, Deuster, Docquier and de Melo2019)], where the deterministic part of the RUM is itself an outcome of a (second-stage) utility-maximization problem over consumption, fertility, and education. These simulations reveal that socio-demographic responses to climate changes are small.
3. Parameterization
Our model is calibrated for 179 countries accounting for more than 99% of the world population. Our parameterization strategy involves three steps. First, we calibrate common and location-specific parameters in order to (perfectly) match socio-demographic and economic moments for the year 2010 (referred to as the year 0 below) or for the period 1980–2010. The set of socio-demographic moments includes internal and international migration flows. Second, we define a socio-demographic trajectory for the twenty-first century that is in line with official projections of population, urbanization, and human capital. Third, we describe our climate damage functions under three climate scenarios.
Matching the current state of the world: We collect data on the socio-demographic and economic characteristics of 179 countries in 1980 and 2010. We use data on Gross Domestic Product (GDP) from the United States Department of Agriculture (USDA) and the proportion of agricultural production in value added from the Food and Agriculture Organization of the UN (FAOSTAT). This determines $Y_0^{jr}$ . For the structure of the resident labor force by education level and by sector $( L_{s, 0}^{jr} )$
 , we use the estimates described in Burzyński et al. (Reference Burzyński, Deuster and Docquier2020). Data on wages by education level $( w_{s, 0}^{jr})$
 are obtained from Biavaschi et al. (Reference Biavaschi, Burzyński, Elsner and Machado2020) for the non-agricultural sector and from the Gallup World Polls for the agricultural sector. We extract the dyadic numbers of international migrants by education level for 2010 from the Database on Immigrants in OECD and non-OECD countries. Within each country, we split the number of emigrants by region of origin and education level, assuming that the structure of migration aspirations (obtained from the Gallup World Polls) is identical to the structure of actual emigration stocks. This gives $M_{s, 0}^{jr, {j}^{\prime}{r}^{\prime}}$
 .
.
With regard to technological parameters are concerned, we calibrate the elasticity of substitution between college graduates and less educated workers (σ r), relying on existing studies. For the non-agricultural sector we follow Ottaviano and Peri (Reference Ottaviano and Peri2012), who suggest setting the elasticity close to 2, whereas for the agricultural sector, it is usually assumed that the substitution is perfect [e.g., Lucas (Reference Lucas2009); Vollrath (Reference Vollrath2009)]. Using equation (3), we then calibrate the skill-bias term, $\eta _t^{jr}$ , so as to match the observed income ratio between skill groups. Using equation (1), we calibrate the TFP level, $A_0^{jr}$
 , in order to match the observed level of GDP. Regressing the logs of $\eta _0^{jr}$
 and $A_0^{jr}$
 on the log of the skill ratio, we identify the size of the technological externalities (ε randκ r). Last, $\bar{A}^{jr}$
 and $\bar{\eta }^{jr}$
 are identified as residuals from equations (4) and (5).
With regard to the migration technology, Bertoli and Fernández-Huertas Moraga (Reference Bertoli and Fernández-Huertas Moraga2013) find a value between 0.6 and 0.7 for the migration elasticity to income disparities, captured by 1/μ in our model. Hence, we use μ = 1.4. We obtain international and internal migration costs $( x_{s, 0}^{jr, {j}^{\prime}{r}^{\prime}} )$ as residuals from equation (8). As climate change is expressed in terms of deviations from the current state of the world, we do not account for any climate change-related flooded areas in the year 2010. For internal migration costs, we assume positive migration from rural to urban regions (i.e., $x_{s, 0}^{ja, jn} < 1$
 ), but no migration from urban to rural region $( x_{s, 0}^{jn, ja} = 1)$
 . For local migration costs in flooded areas, we pessimistically assume $x_{f, s, t}^{jr, jr} = 0.5$
 (i.e., relocating within the location where a person was born induces an income loss equal to 50% of the lifetime utility), in line with literature on conflict-related displacements [e.g., Fiala (Reference Fiala2015); Ibáñez and Moya (Reference Ibáñez and Moya2006); Kellenberg and Mobarak (Reference Kellenberg and Mobarak2011)]. Using a similar parameterization strategy, Burzyński et al. (Reference Burzyński, Deuster and Docquier2020) predict variations in the dyadic stocks of migrants between 1950 and 1980 and obtain a close fit to the observed values.
Socio-demographic environment: Unless otherwise stated, we assume constant migration costs over the twenty-first century (i.e., $x_{s, t}^{jr, {j}^{\prime}{r}^{\prime}} = x_{s, 0}^{jr, {j}^{\prime}{r}^{\prime}} \forall t$ ). For $n_{s, t}^{jr}$
 and$p_{s, t}^{jr}$
 , we use the projections of Burzyński et al. (Reference Burzyński, Deuster and Docquier2020), who endogenize the trajectory of socio-demographic variables in a similar overlapping generations framework without climate change. They constrain their baseline trajectory to be compatible with medium-term official demographic projections, as reflected by the UN projections of the national adult population and the proportion of college graduates for 2040. This can be achieved by assuming a process of quadratic convergence in access to education. This implies that middle-income countries converge towards high-income countries, while low-income countries diverge or converge less rapidly. For subsequent years and in all climate variants, we assume a continuation of this quadratic convergence process. The resulting changes in the size and structure of the population partly determine the skill ratio and the level of the technology in all locations.
Climate scenarios: Our climate scenarios involve temperature changes and rising sea levels. Temperature and sea level projections are available from the CCKP portal [Taylor et al. (Reference Taylor, Stouffer and Meehl2012)], which distinguishes between several emissions scenarios labeled as representative concentration pathways (RCP) [Moss et al. (Reference Moss, Edmonds, Hibbard, Manning, Rose, van Vuuren, Carter, Emori, Kainuma, Kram, Meehl, Mitchell, Nakicenovic, Riahi, Smith, Stouffer, Thomson, Weyant and Wilbanks2010)]. They are organized in 20-year climatological windows. The median-emissions scenario is termed RCP-4.5, which predicts that emissions will peak around 2040 before declining. For each RCP, the CCKP provides data for 16 models obtained from different research institutes. When these 16 models are ranked in ascending order according to the secular temperature variation, the medium resolution model of the Institute Pierre Simon Laplace (the ipsl_cm5a_mr variant) takes the eighth (median) position in RCP-4.5. We select this “median of the medians” variant as our baseline scenario and consider three alternative scenarios:
• No climate change (No CLC): No change in temperature and in sea levels. Most probably unattainable, this scenario serves as the no climate change reference.
• Baseline (RCP-4.5): Median temperature scenario corresponding to the median emissions scenario (RCP-4.5). This baseline involves mean increases in temperature and sea levels of 1.8 °C and 0.47 m, respectively.
• Higher temperature (Higher T): Starting from the baseline, we double the predicted changes in temperature in all regions, keeping the rise in the sea levels identical to that used in the baseline.
• Higher sea levels (Higher SL): Starting from the baseline, we double the predicted rise in the sea levels in all parts of the world, keeping temperature changes identical to those used in the baseline.
Projections of temperature and changes in sea levels by pixel of 1 km × 1 km can be obtained from Giorgetta et al. (Reference Giorgetta, Jungclaus, Reick, Legutke, Brovkin, Crueger, Esch, Fieg, Glushak, Gayler, Haak, Hollweg, Kinne, Kornblueh, Matei, Mauritsen, Thorsten, Mikolajewicz, Müller, Notz, Raddatz, Rast, Roeckner, Salzmann, Schmidt, Schnur, Segschneider, Six, Stockhause, Wegner, Widmann, Wieners, Claussen, Marotzke and Stevens2012). With regard to temperature, and for the baseline, Figure 1(a) illustrates the predicted variations in temperature between 2010 and 2100 by latitude and longitude. The largest variations are observed in the extreme north as well as some regions located close to the equator and in the east. Similarly, global changes to sea levels will not be uniform, but will exhibit substantial regional deviations [Oppenheimer et al. (Reference Oppenheimer, Glavovic, Hinkel, van de Wal, Magnan, Abd-Elgawad, Cai, Cifuentes-Jara, DeConto, Ghosh, Hay, Isla, Marzeion, Meyssignac and Sebesvari2019)]. Thermal expansion, ocean dynamics, and land ice loss contributions will generate regional departures from the global mean sea-level rise of about ±30%. Figure 1(b) shows that the rise in sea levels will be more pronounced in the extreme north, in the northern part of the Atlantic Ocean, and in the south-east of the Cape of Good Hope. This determines the surface of flooded areas. In order to account for such heterogeneities, we combine sea level projection data by pixel with high-resolution, geo-referenced information on topography [Tadono et al. (Reference Tadono, Ishida, Oda, Naito, Minakawa and Iwamoto2014)] and distance to coastlines [Stumpf (Reference Stumpf2012)].

Figure 1. RCP-4.5 scenario and its effects on TFP and forced displacement.
Notes: Own calculations based on climate data by Giorgetta et al. (Reference Giorgetta, Jungclaus, Reick, Legutke, Brovkin, Crueger, Esch, Fieg, Glushak, Gayler, Haak, Hollweg, Kinne, Kornblueh, Matei, Mauritsen, Thorsten, Mikolajewicz, Müller, Notz, Raddatz, Rast, Roeckner, Salzmann, Schmidt, Schnur, Segschneider, Six, Stockhause, Wegner, Widmann, Wieners, Claussen, Marotzke and Stevens2012). Subfigures (a) and (b) represent deviations from the baseline situation in 2010 at the pixel level. Subfigures (c)–(f) represent relative deviations from the NoCLC scenario in the year 2100 and at the region level.
Climate damage functions: To predict the long-term implications of climate change, we consider two mechanisms of transmission. First, we allow changes in the mean level of temperature to affect productivity, expected income, and incentives to migrate [as in Dallmann and Millock (Reference Dallmann and Millock2017); Desmet and Rossi-Hansberg (Reference Desmet and Rossi-Hansberg2015); Shayegh (Reference Shayegh2017)]. Second, we model forced displacements linked to rises in sea levels [as in Desmet et al. (Reference Desmet, Nagy and Rossi-Hansberg2018); Rigaud et al. (Reference Rigaud, de Sherbinin, Jones, Bergmann, Clement, Ober, Schewe, Adamo, McCusker, Heuser and Midgley2018)].Footnote 5
To model the effect of temperature, we follow Desmet and Rossi-Hansberg (Reference Desmet and Rossi-Hansberg2015), who estimate the relationship between temperature and TFP in agricultural and manufacturing sectors. This function corresponds to $G( {T_t^{jr} })$ in equation (4). The curve is inverted-U-shaped for both sectors but flatter in manufacturing. Desmet and Rossi-Hansberg (Reference Desmet and Rossi-Hansberg2015) find an optimal temperature of 21.1 °C for agriculture, and 17.4 °C for non-agriculture. The level of TFP increases with temperatures in regions with average temperatures below these optimal levels; it decreases with temperature in warmer regions.
It is important to note that our two-sector model does not distinguish between pixels and only establishes a difference between rural/agricultural and urban/non-agricultural regions within each country. Climate literature suggests that temperature levels observed at the centroid of each country may not accurately reflect the impact of climate change. This may be due to the fact that aggregate measurements poorly capture population concentration and individuals' average exposure to temperature change in large countries with regions of heterogeneous population densities. Hence, we use population-weighted changes in temperature from Dell et al. (Reference Dell, Jones and Olken2012). Figures 1(c) and 1(e) show the direct effect of temperature on agricultural and non-agricultural TFP levels for each country and for the year 2100. On average, in the RCP-4.5 scenario, agricultural productivity decreases by 20–25% in countries close to the equator and increases by the same amount at high latitudes. Similarly, non-agricultural productivity decreases by 10–15% in countries close to the equator, and increases slightly at high latitude levels.
This implies that climate change will affect income convergence over the twenty-first century. From equation (4), it appears that TFP levels are also affected by changes in the skill ratio $( z_t^{jr} )$ , which result from our (exogenous) socio-demographic hypotheses and (endogenous) migration outcomes. For each climate scenario and sector, we can run a cross-country regression of the mean annual growth rate of TFP over the twenty-first century on its initial level (in logs). The results of these beta-convergence regressions are illustrated in Figure 2. The left-hand panel gives the results obtained for agriculture (each country is represented by a red bubble), while the right-hand panel shows the results for non-agriculture (each country is represented by a blue bubble).

Figure 2. Convergence vs. divergence in TFP under alternative climate scenarios.
Notes: Mean annual growth rates of TFP levels over the period 2010–2100 are represented on the vertical axes. The 2010 levels of TFP (in logs) are represented on the horizontal axes. The trends correspond to the quadratic relationship between the two variables. A negative slope indicates a convergence process; a positive slope indicates divergence.
In the No CLC scenario (top panel), we abstract from climate change. The beta-convergence regression results are governed by the assumed quadratic convergence process in human capital formation (i.e., in domestic investment in education). In line with the median socio-demographic scenario of the United Nations, our socio-demographic environment assumes that progress in education is greater in middle-income countries than in rich and in poor countries. The resulting effect on the skill ratio and TFP is reinforced by internal and international mobility responses—people moving from low-productivity to high-productivity regions and countries. Hence, this scenario implies quadratic convergence in TFP levels. Roughly speaking, in both sectors, TFP levels converge among countries and regions belonging to the top quartile of the initial TFP distribution. Countries and regions below the top quartile diverge.
The convergence implications of climate change are illustrated in the bottom panels in Figure 2. Under the RCP-4.5 scenario, the divergence forces are strengthened. Variations in temperature will induce dramatically different effects on productivity in countries above and below the 35th parallel. Over the twenty-first century, agricultural productivity decreases by 20–25% in countries close to the equator, and increases by 10–15% at high latitudes. Non-agricultural productivity decreases by 10–15% in countries close to the equator, and slightly increases at high latitudes. Over the twenty-first century, the annual growth rate of TFP is 2 percentage points higher in the wealthiest regions compared with the poorest ones. Hence, low-latitude countries in general, and their rural regions in particular, will be the most adversely affected by climate change. The magnitudes of these effects are greater when temperature variations are doubled (see Higher T), whereas higher sea level rise has almost no impact on TFP convergence (see Higher SL).
We now turn our attention to forced displacements, which are predicted by combining sea level projection data from Giorgetta et al. (Reference Giorgetta, Jungclaus, Reick, Legutke, Badedr, Bottinger, Brovkin, Crueger, Esch, Fieg, Glushak, Gayler, Haak, Hollweg, Ilyina, Kinne, Kornblueh, Matei, Mauritsen, Mikolajewicz, Müller, Notz, Pithan, Raddatz, Rast, Redler, Roeckner, Salzmann, Schmidt, Schnur, Segschneider, Six, Stockhause, Timmreck, Wegner, Widmann, Wieners, Claussen, Marotzke and Stevens2013) with high-resolution geo-data on population density [CIESIN-Columbia University (2018))] and data on the rural/urban divide from Balk et al. (Reference Balk, Deichmann, Yetman, Pozzi, Hay and Nelson2006). Our approach by pixel enables us to proxy the number of individuals at risk from coastal flooding on a 1 km × 1 km grid and by region. Coupling this information with data on the geographical extent of urban/rural areas [Balk et al. (Reference Balk, Deichmann, Yetman, Pozzi, Hay and Nelson2006)] allows us to compute the fraction of population affected by rises in sea levels $( \Theta _t^{jr})$ by country.
Figures 1(d) and 1(f) give the total number of displaced persons over the twenty-first century in rural and urban regions, respectively. Rising sea levels mostly affect countries where a large proportion of the population is located along the coasts of seas and oceans, or in the major river deltas. The proportion of displaced persons is large in South Asian and East Asian countries. Some Pacific islands situated a few centimeters above sea level (e.g., Tuvalu, Kiribati) are in a position of extreme vulnerability. Wealthy and poor countries will be equally adversely affected by rising sea levels.
4. Results
As the relationship between temperature and productivity is nonlinear and sector specific, climate change increases income disparities between and within countries. Table 1 summarizes the macroeconomic implications of climate change for the world and by region. The bottom lines of this table show the worldwide responses, computed as the weighted averages of the positive and negative effects observed in high-income and developing countries. The values shown in bold are the projections obtained in the No CLC scenario. The values underneath are the variations induced by the RCP-4.5, Higher T, and Higher SL scenarios, expressed as deviations from the No CLC scenario.
Table 1. Aggregate effects of climate change by world region
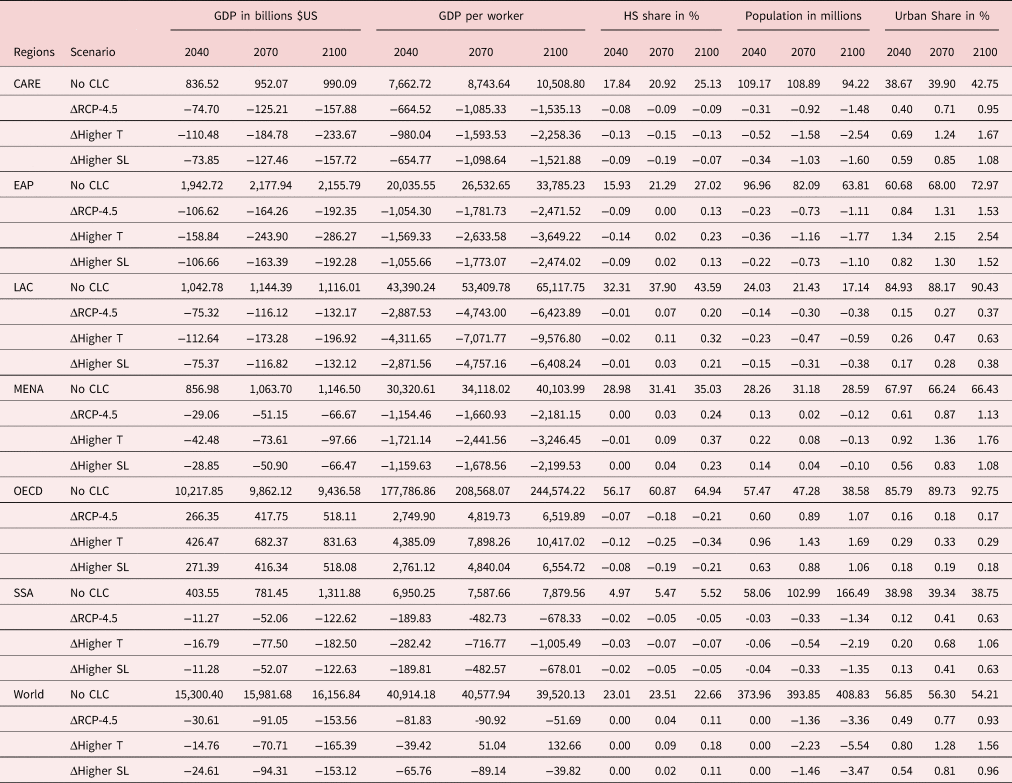
Notes: This table depicts our aggregated projections of income and population indicators for the No CLC scenario and contrasts them with the RCP-4.5, Higher T, and Higher SL scenarios. For example, ΔRCP-4.5 $=$ RCP-4.5 − No CLC. Regions: Central Asia and the Rest of Europe (CARE), East Asia and Pacific (EAP), Latin America and Caribbean (LAC), Middle East and North Africa (MENA), OECD, Sub-Saharan Africa and the world. Population counts refer to those aged 25 years and above.
In a nutshell, we find that climate change barely affects the worldwide average level of GDP per worker, but does make its distribution more unequal. Under the RCP-4.5 scenario, the worldwide level of GDP per worker decreases by 0.2%, 0.2%, and 0.1% in 2040, 2070, and 2100, respectively. Similar changes are obtained under the Higher SL scenario. Under the Higher T scenario, the worldwide loss is even smaller in 2040 (−0.1%) and turns into a small gain in 2070 ( + 0.1%) and in 2100 ( + 0.3%). There are two reasons for aggregate GDP effects being small and potentially positive. First, higher temperature levels induce positive changes in TFP at high latitudes (where income per worker is initially higher) and negative changes in TFP close to the equator (where income per worker is initially lower). Second, climate change reallocates people from poorer to richer countries and regions. As movers adopt the fertility and education norms of the destination country/region, climate change increases the worldwide average proportion of college graduates and reduces the size of the world's working-age population. It is worth noting that the utility costs of these movements are not accounted for in our GDP responses to climate change, nor are unpredictable income losses due to extreme weather events. This implies that we can expect a (larger) decrease in global welfare.
When looking at the region-specific effects, climate change increases GDP per worker in OECD countries only; the effects in 2040, 2070, and 2100 amount to 1.5%, 2.3%, and 2.7%, respectively, under the RCP-4.5 scenario, and to 2.5%, 3.8%, and 4.3%, respectively, under the Higher T scenario. By contrast, climate change decreases GDP per worker in developing regions despite the fact that it reallocates some people from lower-productivity rural regions to higher-productivity urban regions. The losses are important. In sub-Saharan Africa, the poorest region of the world, the effects amount to −2.7%, −6.4%, and −8.6% in 2040, 2070, and 2100, respectively, under the RCP-4.5 scenario, and by −4.1%, −9.4%, and −12.8%, respectively, under the Higher T scenario. In relative terms, similar losses are obtained in East Asian and Pacific countries, as well as in the Middle East and Northern Africa. Larger long-term effects are obtained in Central Asia (−21.5%) and in Latin America (−14.7%) in the Higher T scenario.
Climate change thus creates conditions that are conducive to increasing urbanization and international migration from developing countries and regions to high-income ones. In section 4.1, we quantify the number of climate migrants per period and characterize the geography of these movements. Section 4.2 identifies some notable country-specific implications. The effect of climate change on urbanization is discussed in section 4.3. Then, section 4.4 investigates the skill structure of climate migration. The rest of the section focuses on the poverty implications of climate change and on the role of migration policies (section 4.5).
4.1 Climate migrants worldwide
The migration implications of climate change are presented in Figure 3 and summarized in Table 2. The top panel of Table 2 gives the benchmark number of movers obtained in the absence of any climate change, distinguishing between local movements (nil under a constant sea level), inter-regional, and international movements. For the latter, we classify these as North–North (N–N), North–South (N–S), S–N and S–S. Countries from the North are meant to represent high-income OECD countries. The next two panels give the number of additional climate migrants predicted under the two climate scenarios. In the RCP-4.5 scenario, we identify 29.5, 20.9, and 19.1 million climate migrants in 2040, 2070, and 2100, respectively. This corresponds to a total of 69.5 million migrants aged 25 years and above over the course of the twenty-first century. Adding dependent children gives a total number of ~130 million movers. These estimates are close to those obtained by Rigaud et al. (Reference Rigaud, de Sherbinin, Jones, Bergmann, Clement, Ober, Schewe, Adamo, McCusker, Heuser and Midgley2018), although we use a radically different approach.
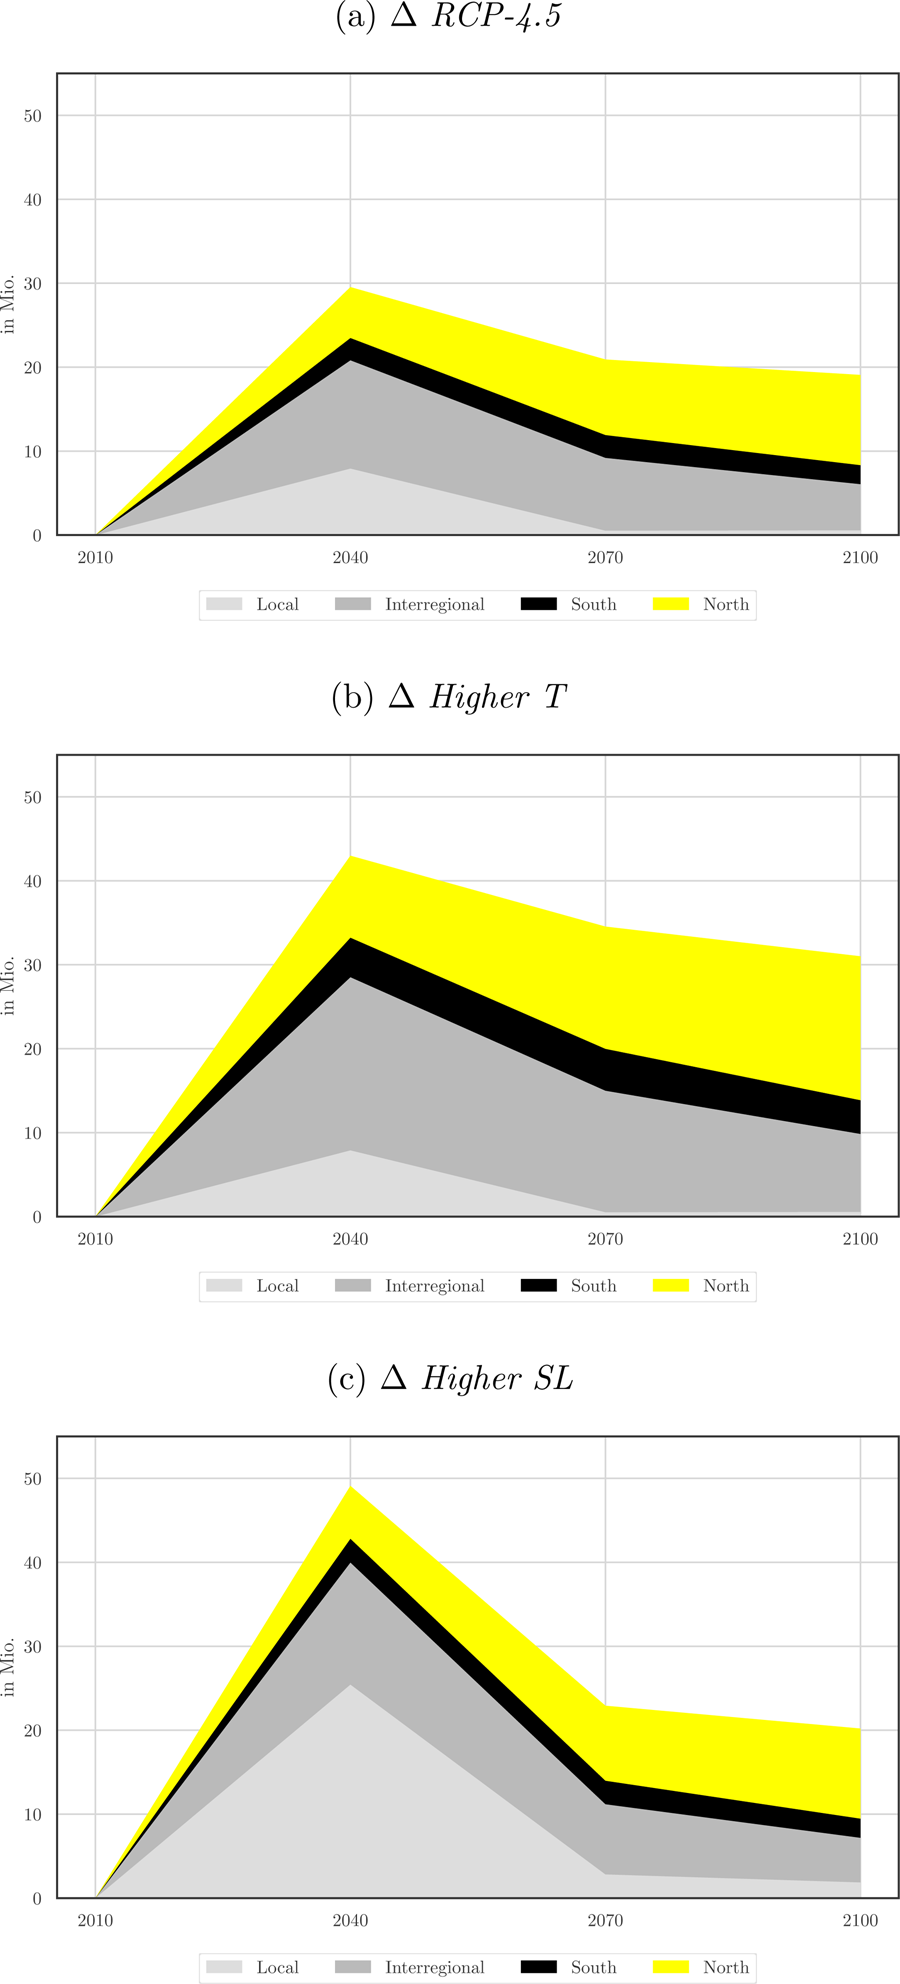
Figure 3. Climate migration worldwide.
Table 2. Climate migration worldwide (in millions)

Our model allows us to endogenize the preferred destinations of these climate migrants, assuming that migration costs and policies remain constant. Summing up over the three periods, climate change has negligible impacts on N–N and N–S migration, and a small impact on S–S international movements (the black area in Figure 3). Under the RCP-4.5 scenario (panel (a) in Figure 3), 13% of climate-related moves are local (forced displacements) and 39% are inter-regional (rural to urban); these internal movements are depicted by the light gray and dark gray areas in Figure 3. In addition, long-haul movements from developing to OECD countries (roughly corresponding to the yellow areas in Figure 3, as N–N movements are negligible) account for 37% of climate migration. S–N climate migration involves 25.7 million people over the twenty-first century (i.e., about 8.5 million per period). On average, this represents an increase by 5–7% in the total number of immigrants to OECD countries depending on the period. The rise in sea levels will have the most significant effects between 2010 and the middle of the century. By the year 2040, the projected number of climate migrants reaches 29.5 million people, including 27% of local movements, 44% of inter-regional movements, and 20% of S–N migrants. S–S migration involves 2.8 million movers (9% of the total).
In the Higher T scenario, we predict 43.0, 34.6, and 31.0 million adult migrants in 2040, 2070, and 2100, respectively, which corresponds to a total of 108.5 million individuals over the course of the twenty-first century (i.e., 39.0 million more than under the RCP-4.5 scenario). Adding dependent children brings this number up to around 200 million movers. Over the century, we now find that 8% of climate-related moves are local, 41% are inter-regional, and 38% are S–N. In total, S–N climate migration involves 41.1 million people over the twenty-first century, which represents about 13 million per period. On average, this induces a 7–11% increase in the total number of immigrants to OECD countries depending on the period. By the 2040, the number of climate migrants reaches 43.0 million people, including 18% of local movements, 48% of inter-regional movements, and 22% of S–N migrants. S–S migration involves 4.8 million movers (11% of the total).
There is great uncertainty about the extent of the rise in sea levels because the dynamics of ocean heat uptake as well as the creation and decay of ice sheets and glaciers are poorly understood. It is thus important to examine whether our results are robust to the magnitude of sea level rise. In the Higher SL scenarios, we double the sea level rise compared with RCP-4.5. This scenario is represented in panel (c) of Figure 3 and in Table 2. This scenario induces movements of 49.1, 22.9, and 20.2 million climate migrants in 2040, 2070, and 2100, respectively. This corresponds to a total of 92.2 million migrants over the course of the twenty-first century (i.e., 22.2 million more than under the RCP-4.5 scenario). Over the century, 33% of climate-related moves are local and 31% are inter-regional. Compared with the RCP-4.5 scenario, doubling the magnitude of the sea level rise increases local movements by 21.1 million people, while it only increases rural-to-urban migration by 1.2 million people. Sea level rise has negligible impacts on N–N and N–S migration, and a small impact on S–S international movements. Long-haul movements from developing to OECD countries account for 28% of climate migration. Hence, S–N climate migration now involves 25.8 million people over the twenty-first century; only 0.2 million more than under the RCP-4.5 scenario.
Our results suggest that forced displacements due to sea level rise are mostly local (i.e., from flooded to non-flooded areas within the same region), while inter-regional and international mobility responses are overwhelmingly governed by the TFP responses to temperature changes.
4.2 Country-specific effects
Table 3 translates our international migration projections into country-specific emigration rates (left-hand panel) and immigration rates (right-hand panel). Emigration rates are expressed as the ratio of the number of international emigrants to the native population aged 25–65 years in the country of origin. Immigration rates are expressed as the ratio of foreigners to the total population aged 25–65 years in the destination countries. In each panel, the first four columns give the evolution of migration rates in the No CLC scenario; the next three columns give the variation in migration rates induced by climate change in the RCP-4.5, Higher T, and Higher SL scenarios, respectively. Countries are ranked in decreasing order, according to the variation obtained in the RCP-4.5 scenario.
Table 3. Effect of climate change on migration rates

The left-hand panel lists the 30 countries exhibiting the largest climate-driven variations in international emigration rates by the end of the century. These mostly include small countries and developing island states located in the Pacific, Caribbean, and Central American regions. Hence, although the variation in emigration rates is substantial (e.g., + 8.3 percentage points in Micronesian islands in the RCP-4.5 scenario, and + 14.4 percentage points in the Higher T scenario), the number of people involved is relatively small. By contrast, the right-hand panel lists the 30 countries exhibiting the largest climate-related variations in immigration rates by the end of the century. These include OECD countries. It should be noted that the immigration rates reported for the year 2010 are roughly twice as large as those reported in official statistics. The reason for this is that our immigration rates are computed as a proportion of the population aged 25–65 years, rather than as a proportion of the total population. As immigrants mostly belong to this age group, their proportion within the working-age population is much higher than in the total population.
Under constant migration policies and without climate change (i.e., in the No CLC scenario), the proportion of immigrants in the total population increases by a factor between 2 and 3 in most OECD countries. These variations are induced by population growth differentials between South and North countries, as well as by the progress in education in the South. Climate change contributes only a little to the rise in migration pressures to the North. In most European countries, the RCP-4.5 scenario increases the proportion of foreigners by 1–2 percentage points, whereas socio-demographic imbalances increase it by 20–30 percentage points. In the United States, climate change increases the immigration rate by 2.4 percentage points, against 30 percentage points for socio-demographic imbalances. Compared with the RCP-4.5 scenario, the effect of climate migration is 1.5 times greater in the Higher T scenario.
4.3 Effect on urbanization
Turning to internal migration, climate change prompts people to relocate from lower-productivity rural regions to higher-productivity urban regions. Table 1 shows that under the RCP-4.5 and Higher SL scenarios, climate change increases the proportion of the world population living in urban areas by 1 percentage point over the twenty-first century. On average, the largest responses are observed in East Asia and the Pacific, and in Middle East and Northern African countries. Under the Higher T scenario, the urbanization responses are 1.5 times greater in all regions. Although these changes may seem small, Figure 4 shows that they mask marked differences between countries and between skill groups. A slight decrease in the urban share is observed in Western European (OECD) countries. By contrast, the urban share increases more rapidly in far north countries and in most countries close to the equator. On average, changes in urban shares are more pronounced among low-skilled workers.

Figure 4. Urbanization due to climate change.
Notes: Figure 4 depicts the percentage point changes in the proportion of urban population that is due to climate change (RCP 4.5). It distinguishes between low-skilled and high-skilled populations. ΔUrbanization ≙ Urban share(2100, RCP 4.5) − Urban Share(2100, No CLC).
Table A1 in the Appendix lists the 30 countries exhibiting the largest climate-driven changes in urbanization. The urban share increases by more than 5 percentage points in five countries under RCP-4.5, and in 15 countries under Higher SL. Small developing states such as Guyana, Surinam, Fiji, Sao Tome and Principe, Jamaica, and the Micronesian islands are among the most affected.
4.4 Skill structure of climate migration
We now turn to the self-selection of climate migrants in terms of education level. For each region of origin and for each period, Figure 5 compares the proportions of college graduates among natives (X-axis) with the proportions of college graduates among climate emigrants (Y-axis). The bubble sizes increase with the number of migrants concerned, while the colors refer to periods. The number of climate migrants is defined as the difference between the number of emigrants in the RCP-4.5 (top panel) or Higher T (bottom panel) scenario, and the number of emigrants in the No CLC one. We focus on the three categories of migrants that are strongly impacted by climate change—namely local movers (left-hand panel), rural-to-urban movers (center panel), and S–N migrants (right-hand panel)—and exclude region-wave observations with a negative number of climate migrants. This mostly pertains to rural-to-urban migration in high-income countries, as agricultural productivity increases in countries located above the 35th parallel. Hence, the center panel only includes 140 observations.

Figure 5. Self-selection in climate migration.
Notes: Figure 5 compares the proportion of college graduates among climate migrants (Y-axes) and natives (X-axes). It distinguishes between three categories of migrants (local, internal, and South–North) and two climate scenarios [RCP-4.5 in (a)–(c), and Higher T in (d)–(f)]. Bubble sizes are proportional to the square root of the number of movers.
Self-selection varies across regions. Nevertheless, whatever the climate scenario, we find that local movers from a majority of regions are slightly less educated than the native population. The process of negative selection is stronger among internal (i.e., rural-to-urban) migrants. Natives born in rural regions of the poor countries are usually poorly educated; those deciding to emigrate within their country are even less educated. By contrast, S–N climate migrants are positively selected along education levels. The proportion of college graduates among S–N migrants exceeds the natives by a factor of 2–3 in most regions. In particular, in relative terms, the intensity of positive selection is large in low-income regions. Hence, high-skilled people from poor regions exhibit a much greater propensity to emigrate to industrialized countries than the less educated when they are confronted with the damage resulting from climate change. The fact that international climate migration is of the brain drain type reinforces the adverse impact of climate change in low-income countries.
4.5 Extreme poverty and migration policies
As stated above, climate change makes the world distribution of income more unequal. The income loss is even greater for low-skilled workers trapped in the poorest regions (i.e., rural regions). In our long-term context with sustained TFP growth, we define Extreme Poverty in relative terms as the percentage of workers earning <2% of the worldwide average level of income per worker. Figure 6 compares the world distribution of income in 2100 across climate change scenarios. The income level of all types of workers is expressed as percentage of the world average. By considering four groups of workers per country (i.e., two skill groups times two regions) and by ignoring within-group heterogeneity, the density shown in Figure 6 is an approximation of the actual income distribution. The model predicts three peaks by the end of the twenty-first century: one at around 5% of the world average, one slightly below the world average, and one at 10 times the world average. The relative poverty line is represented by the vertical dashed gray line.

Figure 6. Effect of climate change on income distribution in 2100 (under RCP-4.5).
Notes: Figure 6 depicts smoothed predicted distributions of income in 2100 under the No CLC (black solid curve), and RCP-4.5 (gray dashed curve) scenarios. The gray vertical line represents the relative poverty threshold (2% of average income).
Climate change affects the distribution of income below the worldwide average level. We focus here on the extensive margin of poverty, measured by the proportion of the world's population below the relative poverty line, as well as on the intensive margin of poverty. The latter is computed as the mean income of workers in extreme poverty, expressed as percentage of the worldwide average income level. Figure 6 shows that climate change adversely affects extreme poverty. In the RCP-4.5 scenario, the proportion of the world's population living in extreme poverty increases by 1.9 percentage points (from 11.0% to 12.9%), and the relative income of the extreme poor decreases by 0.07 percentage points compared with the world average. In the Higher T scenario (not shown in Figure 6), the extensive margin increases by 6 percentage points (from 11.0% to 17.0%) and the relative income of the extreme poor decreases by 0.15 percentage points.
It is thus natural to explore whether changes to immigration and urbanization policies could help to limit the effect of climate change on extreme poverty. Predicting mobility responses to a partial or total liberalization of international migration is a complex task [see Delogu et al. (Reference Delogu, Docquier and Machado2018); Docquier et al. (Reference Docquier, Machado and Sekkat2015)]. Hence, to shed light on the potential effect of future international migration and urban development policies, we compare the RCP-4.5 scenario with two extreme (and somewhat unrealistic) mobility variants. The first consists of preventing people from migrating internationally from 2040 onwards $\left( x_{b, s, t}^{jr, {j}^{\prime}{r}^{\prime}} = 1\;\forall j\ne {j}^{\prime}\right)$ . The resulting income distribution corresponds to the dark gray dashed curve in Figure 7. Our second counterfactual scenario consists of preventing people from migrating between regions within their country from 2040 onwards $\left( x_{b, s, t}^{jr, j{r}^{\prime}} = 1\;\forall r\ne {r}^{\prime}\right)$
 , while re-opening the external borders. The resulting income distribution is shown by the light gray dotted curve in Figure 7.

Figure 7. Climate change and inequality without migration (under RCP-4.5).
Notes: Figure 7 depicts smoothed predicted distributions of income in 2100 under the RCP-4.5 climate scenario and alternative migration policies. The gray vertical dashed line represents the relative poverty threshold (2% of average income). The black solid curve gives the inequality responses under current migration costs and policies. The dark gray dashed curve gives the effects obtained after closing all borders. The light gray dotted curve shows the effects obtained after preventing people from migrating between regions/sectors within their country.
We find that closing the external borders reduces poverty at the extensive margin (6 percentage points) and at the intensive margin. This is due to skill selection in international migration responses to climate change. International migration opportunities mostly benefit high-skilled workers from urban regions. The resulting “brain drain” reduces the low-skilled wage rate in this sector, which slows down urbanization and increases the number of low-skilled workers “trapped” in the rural sector. This implies that relaxing international migration restrictions may exacerbate the poverty responses to climate change. Leaving aside any discussion regarding the political economy of removing migration barriers, as well as the integration issues involved by the skill selectivity of migrants, our simulations suggest that the poverty implications of a climate-related migration policy are highly sensitive to the target group. If the policy affects the poorest individuals from the poorest countries (i.e., low-skilled workers in agriculture), opening borders and issuing new “climatic visas” may be suitable for mitigating the poverty response to climate change in the origin regions. By contrast, if a policy does not affect the self-selection of international migrants or if the screening of potential migrants is imperfect, it is likely to reinforce extreme poverty in the countries of origin.
With regard to internal movements, Figure 7 shows that preventing people from migrating from rural to urban regions has ambiguous effects on extreme poverty. In the poorest regions (where income per capita is below 1% of the world average income), internal migration is a costly option and low-skilled workers are trapped in their region of birth. Preventing the very few high-skilled workers from leaving slightly reduces extreme poverty. In poor regions where income per capita is between 1% and 2% of the world average income, internal migration allows low-skilled people to escape poverty; preventing them from leaving increases extreme poverty. Quantitatively speaking, these two effects balance each other out. It should be noted that preventing internal migration dramatically increases the proportion of the population living on 2–20% of the worldwide average income level, and polarizes the world distribution of income. In line with the Sustainable Development Agenda, our analysis suggests that policies targeting sustainable urban development and smaller internal mobility frictions are key to mitigating the poverty impact of climate change.
5. Conclusion
Climate change is regarded as a significant shock that will substantially change the global economic environment in the coming decades. Indeed, our results strongly support this suggestion. A gradual increase in average temperature levels and the consequent rising sea levels constitute drivers of welfare redistribution across individuals, regions, and countries. Climate change is likely to boost productivity in the rich economies, and strongly harm the poorest countries located close to the equator. Assuming there are no changes to global migration policies, this would induce movements from rural to urban regions and from less-developed to highly-developed countries. The simulations of our model indicate that the overall magnitude of these climate-induced flows reach 70 million (108 million) workers in the RCP-4.5 (Higher T) scenario over the course of the twenty-first century. Interestingly, a significant proportion of these migrants (27% by 2040 and 13% over the whole century) will choose to move locally, and many others (44% by 2040 and 39% over the whole century) will move across regions of their home country. The rest (29% by 2040 and 48% over the whole century) will decide to cross borders. With regard to international migration, we find that S–N migrants constitute an overwhelming part of total flows, while S–S migration is of lesser importance. We predict almost no changes to emigration from North, OECD countries. When looking at the education levels of climate migrants, the model indicates a stark dichotomy of self-selection patterns. While internal movers are predicted to be negatively selected from their home region populations, international migrants are strongly positively selected. The latter indicates that climate change boosts the brain drain from less-developed countries, which, along with an adverse impact on productivity, reinforces divergence in income per capita across the globe.
A significant redistribution of income across regions and countries that widens the inequality gap calls for policy interventions to save people from facing economic losses. Experimenting with migration policies only, we find that closing international borders may reduce aggregate inequality at the cost of individual utility for potential climate emigrants (positively selected) who cannot leave their homeland. By contrast, closing down regional migration significantly adversely affects welfare in the poor regions and accelerates the rise in inequality, as the low-skilled climate migrants become stuck in their region of birth.
As temperatures continue to increase and sea levels rise, the economic prosperity of many millions of people is under threat. Climate change, one of the major challenges for humankind in the next decades, is presumed to induce significant global mobility of people. Our quantitative results not only support this statement, but also give it a slightly different flavor, as the most intensive response is predicted to take place at the local and regional scale. Thus, our results reinforce the call for efficient global policies, but more importantly, highlight the importance of the local and regional context in fighting against the effects of climate change on migration.
Acknowledgements
We wish to thank an anonymous referee for the helpful comments and suggestions. This paper benefitted from the financial support of the Agence Française de Développement (convention IRS/ECO/437-2017) and of the ARC convention on “New approaches to understanding and modelling global migration trends” (convention 18/23-091). Hendrik Scheewel acknowledges financial support from the FNRS (convention FRESH 33847523).
Appendix
Table A1. Top 30 changes in urban share due to climate change

Table A2. Countries included in our model and their ISO codes


