Introduction
Taenia crassiceps (Zeder, 1800) is an excellent experimental model in which to study host immune responses, endocrinological responses, infectivity, pharmacology and enzymology and to perform vaccine research (Willms & Zurabian, Reference Willms and Zurabian2010; Sciutto et al., Reference Sciutto, Fragoso and Larralde2011; Almeida et al., Reference Almeida, Miguel, de Souza and Clare2014).
In the past 10 years, one T. crassiceps research study has been published for every five that used Taenia solium, the majority of which have focused on T. solium function. This publication volume speaks to the value of T. crassiceps as an experimental model, particularly for T. solium research.
Cysticercosis and neurocysticercosis (NCC) are caused by infections with the larval form (cysticercus) of the pork tapeworm T. solium. This parasite is acquired via the ingestion of T. solium eggs passed in the faeces of persons harbouring the adult tapeworm (taeniasis). Food or water may be contaminated with the eggs in areas with inadequate waste disposal or from the hands of persons with taeniasis. These eggs are immediately infectious upon ingestion by humans or pigs, hatching into larvae in the small intestine. The larvae penetrate the intestinal wall and subsequently invade various tissues, where they encyst to form cysticerci (Cheng, Reference Cheng1986). NCC comprises one of the most common parasitic diseases of the central nervous system (CNS) worldwide. The disease is endemic in several countries in Central/Latin America, China, the Indian subcontinent, South-East Asia and sub-Saharan Africa, where approximately 15–50 million people are at risk of infection (Carpio & Hauser, Reference Carpio and Hauser2009). Cysticercosis, particularly NCC, has recently re-emerged in developed countries, spurred on by immigration from endemic areas (Ong et al., Reference Ong, Talan, Moran, Mower, Newdow, Tsang and Pinner2002; Kraft, Reference Kraft2007).
Adult T. crassiceps tapeworms are found in canine hosts, and the larval stages are found in rodent intermediate hosts. It is possible to infect laboratory mice via the serial subinoculation of larvae into the peritoneal cavity, where they establish new infections; the larvae then grow, bud and eventually produce thousands of larvae (Chau & Freeman, Reference Chau and Freeman1976).
Due to ethical concerns, health risks, expense and the difficulty in obtaining different biological forms of this cestode, it is difficult to perform experimental research with T. solium. In contrast, the T. crassiceps model, which demonstrates close phylogeny with T. solium, is easy to obtain and to propagate a continuous supply of cysticerci in the laboratory. The organism is both innocuous and inexpensive to maintain. Since T. crassiceps shares many biological characteristics with T. solium, experimental results obtained using the former will help us to understand the biology of T. solium.
In terms of the detoxification capacity of these cestodes, the larvae of T. crassiceps and T. solium represent the tissue forms of these parasites, and both induce an inflammatory response when they start to die and release antigens (White et al., Reference White, Robinson and Kuhn1997). This immune response consists of inflammatory cells that produce reactive oxygen species (ROS), which damage cellular macromolecules such as lipids, proteins and nucleic acids through intense lipid peroxidation. Despite this immune response, cestodes survive in host tissues for long periods, even in the presence of a functional immune system (Dixon & Lipscomb, Reference Dixon and Lipscomb1961). Consequently, T. crassiceps and T. solium must possess adequate detoxification mechanisms, evidenced by the existence of human carriers of T. solium cysticerci (Fleury et al., Reference Fleury, Gomez, Alvarez, Meza, Huerta, Chavarria, Carrillo, Lloyd, Dessein, Preux, Dumas, Larralde, Sciutto and Fragoso2003; Prasad et al., Reference Prasad, Gupta, Pradhan and Tripathi2008) and the permissive intraperitoneal proliferation of dozens of undamaged T. crassiceps in mice (Siebert et al., Reference Siebert, Good and Simmons1978).
Glutathione transferases (GSTs) play a critical role in cellular protection against ROS. GSTs detoxify a variety of electrophilic compounds, including oxidized lipids, DNA and catechol products generated by ROS-induced damage to intracellular molecules. Additionally, GSTs detoxify a number of toxic ligands by acting as a non-catalytic, intracellular, binding protein (Sheehan et al., Reference Sheehan, Meade, Foley and Dowd2001; Plancarte et al., Reference Plancarte, Romero, Nava, Reyes and Hernandez2014).
Although T. crassiceps is an excellent experimental model to use to answer research questions concerning T. solium, the ROS detoxification mechanisms of this human parasite are poorly understood. Thus far, only one report has investigated the presence of GSTs in T. crassiceps, and enzyme functionality has not yet been evaluated (García-Montoya et al., Reference García-Montoya, Mesa-Arango, Isaza-Agudelo, Agudelo-Lopez, Cabarcas, Barrera and Alzate2016). Given the importance of GST functionality in cestodes, and the presence of more than one enzyme isoform in all organisms, we sought to purify and characterize native GST isoenzymes in T. crassiceps, using both biochemical and kinetic procedures.
Materials and methods
Chemicals
All chemical reagents were of analytical grade and were used without further purification. Glutathione (GSH, γ-Glu–Cis–Gly), 1-chloro-2,4-dinitrobenzene (CDNB), 1,2-dichloro-4-nitrobenzene, reactive carbonyls, 1,2-epoxy-3-(p-nitrophenoxy) propane and ethacrynic acid were all obtained from Aldrich (Milwaukee, Wisconsin, USA). GSH-sepharose 4B, cibacron blue (CB) F3GA (Color Index 61211), sodium salt of bromosulphophthalein (BST) and haematin (Hm) were obtained from Sigma (St. Louis, Missouri, USA). All solutions were prepared with distilled and deionized (Milli Q) water.
Parasites
All experiments were carried out using cysticerci of T. crassiceps ORF, which were maintained through intraperitoneal passage from mouse to mouse using 8-week-old BALB/c females (Esquivel-Velázquez et al., Reference Esquivel-Velázquez, Hernández, Larralde and Ostoa-Saloma2014). Cysts were collected from the peritoneal cavities of 2-month-old infected mice after humanitarian sacrifice, then rinsed thoroughly with 0.01 m sodium phosphate buffer containing 0.15 m NaCl, pH 7.2 (PBS), partially dried on filter paper and immediately frozen at −70°C until use.
Purification of T. crassiceps GSTs
Taenia crassiceps GSTs were purified via single-step chromatography using a procedure modified from Brophy et al. (Reference Brophy, Papadopoulos, Touraki, Coles, Körting and Barrett1989a). Briefly, T. crassiceps cysticerci (30 g) were homogenized in 1.5 volumes of PBS containing 1 mm EDTA and 0.1 m phenylmethyl-sulphonyl-fluoride (PMSF) using a polytron homogenizer (Brinkmann Instruments, Westbury, New York, USA). The homogenizer was spun for 20 min at 10,000 g av, and then the supernatant was spun again for 1 h at 105,000 gav to obtain the cytosolic protein fraction (CPF) containing 35 mg of protein per ml. The CPF was filtered through a 0.45-μm membrane (Amicon-Millipore, Bedford, Massachusetts, USA) and applied to a GSH-sepharose 4B column (GE Healthcare Co., Fairfield, Connecticut, USA) (2.6 × 8 cm) previously equilibrated in PBS. After rinsing the column thoroughly, parasite GSTs were eluted using a linear GSH concentration gradient (0–5 mm) prepared in 50 mm Tris/HCl (pH 8.0) (ten times the column volume). Four-millilitre fractions showing GST activity were detected as described by Habig et al. (Reference Habig, Pabst and Jakoby1974) and then pooled, concentrated to a volume of 1 ml by ultrafiltration (YM-5 membrane; Amicon-Millipore) under nitrogen and exhaustively dialysed against PBS.
Molecular weight determination
A total of 50 mg/0.5 ml of CPF was applied to a Sephacryl S-200 chromatography column (0.9 cm × 60 cm) equilibrated in 10 mm PBS. Myoglobin, carbonic anhydrase, ovalbumin, bovine serum albumin, alcohol dehydrogenase and β-galactosidase were used for molecular weight calibration (Hagel, Reference Hagel, Janson and Rydén1998). Under denaturing conditions, the molecular weights of the GSTs were determined by performing SDS-polyacrylamide gel electrophoresis according to procedures established by Garfin (Reference Garfin and Deutscher1990).
Protein determination
GST protein concentrations were determined by measuring the absorbance at 280 nm; an extinction coefficient of 0.920 mm−1 cm−1 at this wavelength was employed for purified proteins. An extinction coefficient of 1.0 mm−1 cm−1 was used for non-purified protein fractions (Gill & von Hippel, Reference Gill and von Hippel1989).
Polyacrylamide gel electrophoresis (PAGE)
To analyse protein fractions, standard sodium dodecyl sulphate–polyacrylamide gel electrophoresis (SDS-PAGE) was performed (Laemmli, Reference Laemmli1970). Either silver or Coomassie blue was used to stain proteins, and low-molecular-weight markers (GE Healthcare, Little Chalfont, Bucks, UK) were used for molecular weight reference (Merril et al., Reference Merril, Switzer and Van Keuren1979).
Tandem mass spectrometry (LC/ESI–MS/MS) and bioinformatic analysis
Following electrophoresis, T. crassiceps GSTs were excised from stained SDS gels, destained, reduced, carbamidomethylated and digested with modified porcine trypsin (Xolapa et al., Reference Xolapa, Vallecillo, Lara, Mendoza-Hernandez, Comini, Spallek, Singh and Espitia2007). Peptide mass spectrometric analysis was carried out using a 3200 Q TRAP hybrid tandem mass spectrometer (Xolapa et al., Reference Xolapa, Vallecillo, Lara, Mendoza-Hernandez, Comini, Spallek, Singh and Espitia2007). The spectrometric data obtained were subjected to National Center for Biotechnology Information (NCBI) BLAST (https://blast.ncbi.nlm.nih.gov/Blast.cgi?PAGE=Proteins) using the default parameters, and were also analysed with the Protein Prospector (http://prospector.ucsf.edu/prospector/mshome.htm) and Mascot programs (http://www.matrixscience.com/search_form_select.html).
The resulting peptides were compared and aligned ‘manually’ based on the T. solium GST sequence (GenBank: AAM64045.1) to observe precisely differences between parasites and T. crassiceps isoforms.
Additionally, Dr Juan F. Alzate-Restrepo (pers. comm.) provided four different contigs of the T. crassiceps transcriptome related to GSTs, from which we obtained protein sequences using the Translate Tool Expasy program (http://web.expssy.org/translate/) with standard parameters (default parameters). We compared these sequences with our peptides using the NCBI BLAST program (https://blast.ncbi.nlm.nih.gov/Blast.cgi?PAGE=Proteins) with the ‘alignment of two or more sequences’ option.
Enzyme assay
To determine GST activity throughout the purification of T. crassiceps GSTs, a protocol described by Habig et al. (Reference Habig, Pabst and Jakoby1974) was employed, using CDNB as a standard second substrate. Initial rates were determined by monitoring changes in absorbance at 340 nm (ε = 9.6 mm−1 cm−1) in an Ultrospec 3100 Pro spectrophotometer (Pharmacia-Biochem, Uppsala, Sweden) for 1 min after starting the enzyme assay. Each assay, for all evaluated activities, was performed at 25°C with 0.4 μg of each T. crassiceps GST in PBS. A complete assay mixture without enzyme was used as a control. Trans-non-2-enal conjugating activity was measured in 1 ml of assay buffer (5 mm GSH, 1 mm EDTA in 100 mm potassium phosphate, pH 6.5) using reactive carbonyl substrate at 50 μm, as described previously by Brophy et al. (Reference Brophy, Papadopoulos, Touraki, Coles, Körting and Barrett1989a). Conjugating activity with 1,2-dichloro-4,5-dinitrobenzene, ethacrynic acid, 1,2-epoxy-3-(p-nitrophenoxy) propane and BST was determined as described previously (Habig et al., Reference Habig, Pabst and Jakoby1974; Habig & Jakoby, Reference Habig and Jakoby1981). The ability of the purified enzyme to catalyse the GSH-mediated reduction of hydrogen peroxide and/or cumene hydroperoxide (i.e. to function as a GSH peroxidase) was determined according to Paglia & Valentine (Reference Paglia and Valentine1967). Briefly, the 1-ml reaction mixture contained PBS, 1 mm GSH, 2 units of GSH reductase, 0.2 mm NADPH and 0.25 mm hydrogen peroxide or 1.2 mm cumene hydroperoxide (dissolved in ethanol to a final concentration of less than 5% in the assay).
Determination of T. crassiceps GST catalytic constants
To obtain the K m and V max values for parasite GSTs using GSH and CDNB as substrates, initial velocity assays were performed at 25°C as described by Habig et al. (Reference Habig, Pabst and Jakoby1974). Briefly, to establish the parasite GST catalytic constant for GSH, enzyme concentrations were constant (0.4 μg), CDNB was maintained at saturation (2 mm) and GSH was varied across a range of 0.01–5 mm. Aliquots of enzymes were pre-incubated for 30 s in assay buffer in the presence of a corresponding concentration of GSH. The reaction was initiated by adding CDNB. To construct an initial velocity plot with the data obtained, at least 11 different concentrations of GSH were assayed in triplicate. Similar assays were developed for CDNB, using a range of 0.1–2 mm CDNB and GSH at a constant concentration (3 mm), and at least seven different concentrations of CDNB were assayed in triplicate. Lineweaver–Burk plots were used to analyse the results of the initial velocity plots (Segel, Reference Segel1993).
Effects of pH on activity and stability
To evaluate the functional dependence of T. crassiceps GSTs on pH, we tested GST transferase activity in the 4.0–12.0 pH range, as described previously (Habig et al., Reference Habig, Pabst and Jakoby1974).
Effects of temperature
The effects of temperature on the transferase catalysis activity of T. crassiceps GSTs was examined under standard assay conditions. Reactions were carried out at temperatures ranging from 5°C to 80°C, and residual enzyme activity was measured. Additionally, catalytic assays were performed in which the enzymes were maintained at 37°C for 20 min (Habig et al., Reference Habig, Pabst and Jakoby1974).
Inhibition studies (IC50, K i, simple inhibition system)
Inhibition studies were performed using the procedure of Tahir & Mannervik (Reference Tahir and Mannervik1985), using RB, CB, BST, indomethacin (IND) and Hm as inhibitors. In the experiments using CB, variable concentrations of the inhibitor (0.0001–1 mm) were pre-incubated in assay buffer with constant concentrations of parasite GSTs (0.4 μg) and GSH (3 mm) in a final volume of 1.0 ml. Identical conditions were used to evaluate the other inhibitors, although different concentration ranges were applied: RB (0.0001–1 mm), IND (0.1–100 μm), BST (0.1–300 μm) and Hm (0.0001–1 mm). All measurements were performed at least three times, and the inhibitor concentration resulting in 50% inhibition (IC50) was obtained by plotting the percentage of residual activity versus the log of the inhibitor concentration. The K i values for each GST inhibitor were determined by replotting the slopes obtained from the double reciprocal plots as a function of the inhibitor concentrations (Segel, Reference Segel1993). To ascertain which type of reversible enzyme inhibition occurs for each of the four inhibitors used in combination with the parasite GSTs, the initial velocities of the enzyme reactions in the presence of the inhibitors were tested. Each parasite GST was pre-incubated for a few seconds in assay buffer containing 3 mm GSH and the inhibitor at its corresponding concentrations (CB, 10 and 30 μm; IND, 4 and 10 μm; BST, 20 and 60 μm; RB, 5 and 10 μm; and Hm, 0.25 and 0.75 μm). The reaction was initiated by adding different concentrations of CDNB ranging from 0.25 to 2 mm. Another set of reactions using identical conditions was performed for each inhibitor concentration and for the non-inhibitor control. The results were measured spectrophotometrically at 340 nm. The data were analysed using Lineweaver–Burk plots (Segel, Reference Segel1993).
Results
Purification of T. crassiceps GSTs
The CPF of T. crassiceps cysticerci contained 0.04 units of GST activity per mg of protein as assessed by the conjugation of CDNB with GSH.
The use of an overloaded GSH affinity chromatography column with freshly prepared T. crassiceps cysticerci extracts resulted in the purification of two GST forms (TcGST1 and TcGST2); the former was eluted at 0.05 mm GSH and the latter at 5 mm GSH. A similar, representative chromatogram comprising over 30 runs is shown in fig. 1, indicating that TcGST2 was not a degradation product arising from purification. The purification results are summarized in table 1. The specific activities of pure TcGST1 and TcGST2 were 26 and 19 U mg−1, respectively. TcGST1 accounted for over 5% of the total recovered conjugating activity with CDNB, and TcGST2 accounted for 0.21%. Both GSTs demonstrated homogeneous bands under denaturing conditions (fig. 2).

Fig. 1. Purification of GSTs from T. crassiceps cysticerci. An aliquot of 500 mg of cytosolic protein fraction (CPF) was applied to a 3 × 40 cm affinity chromatography column of glutathione-Sepharose 4B equilibrated in PBS, and a linear GSH gradient (0–5 mm) was developed (dashed line). The optical density at 280 nm of the 4-ml fraction was determined (diamonds) and the transferase activity was plotted, as initial velocity (V 0) (circles).
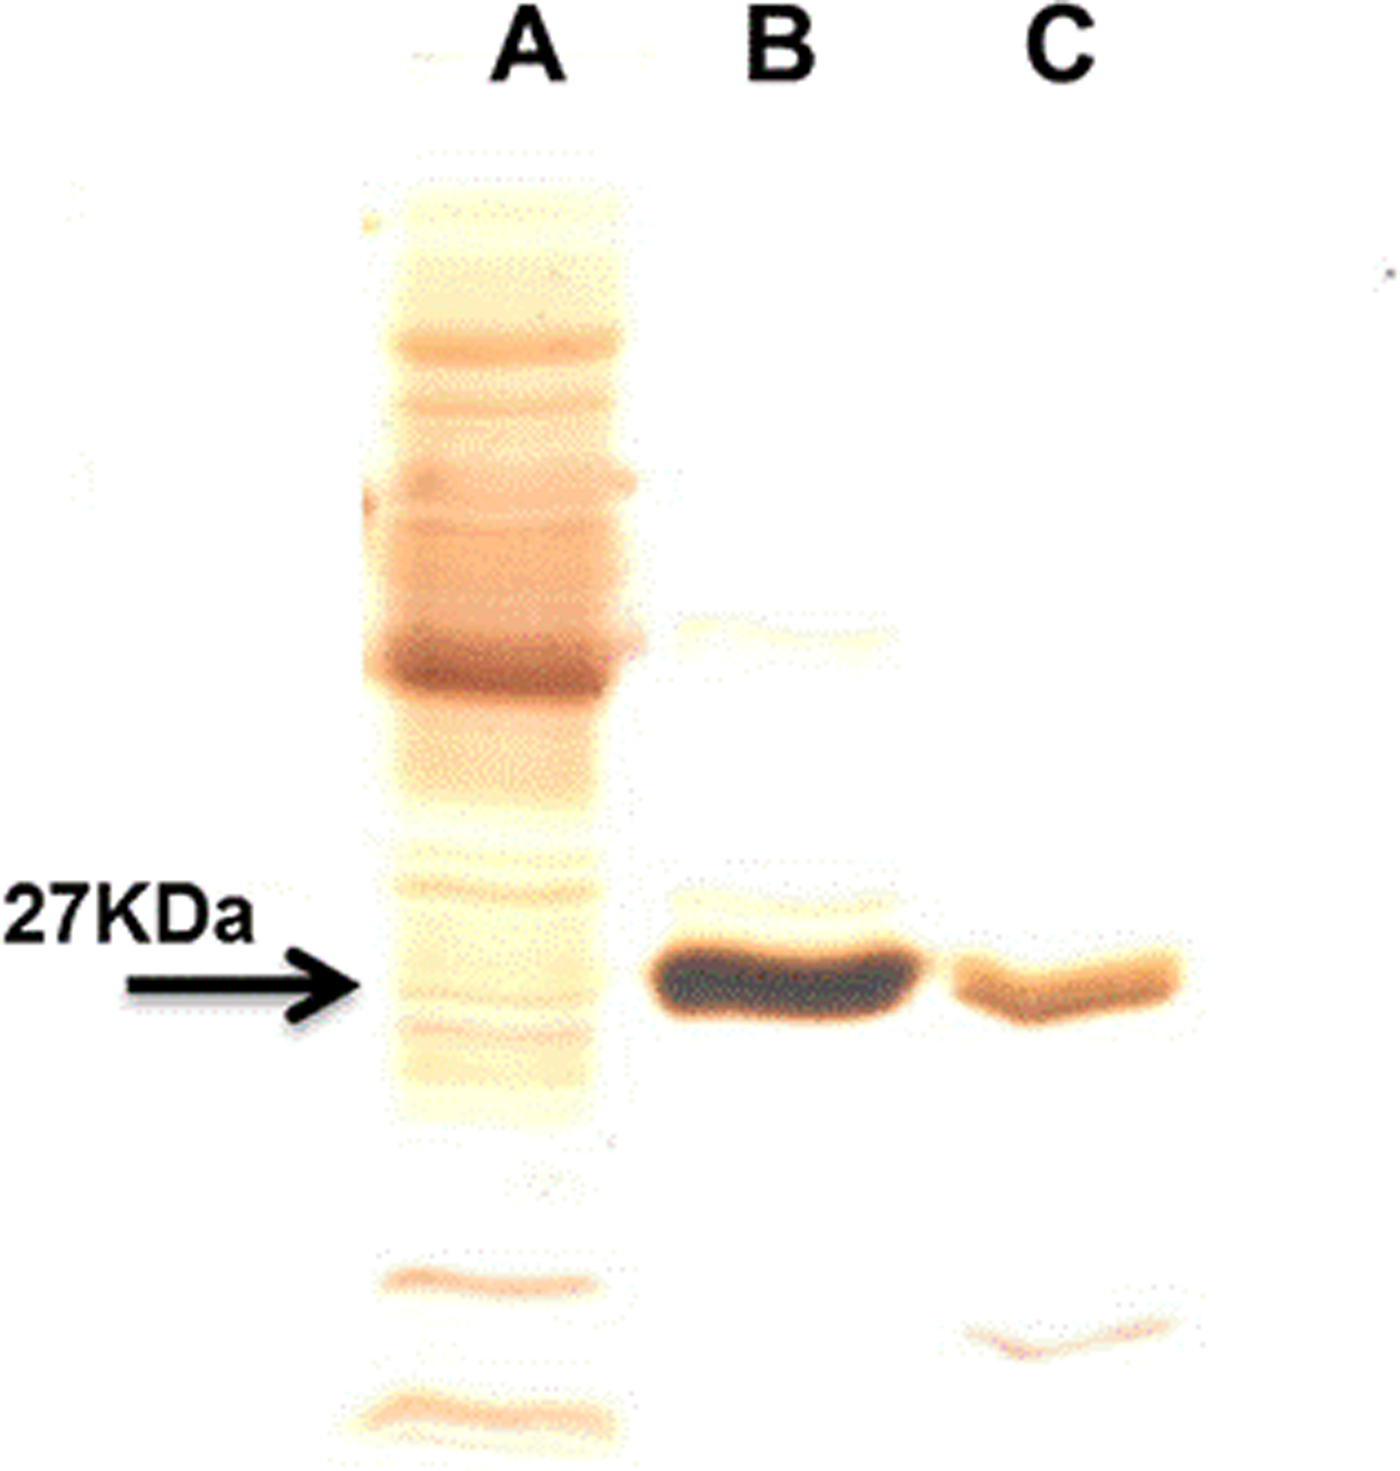
Fig. 2. SDS-PAGE in 15% slab gels of the purified T. crassiceps GSTs. Lanes: A, 15 μg of cytosolic protein fraction (CPF); B, 2 μg of TcGST1; C, 2 μg of TcGST2. All samples were reduced with 1% β-mercaptoethanol and these gels were stained with silver for protein.
Table 1. Summary of the purification of TcGST1 and TcGST2 from T. crassiceps a.
a Starting from 30 g cysticerci.
b Data obtained with GSH and CDNB as substrates.
Determination of molecular weights and subunit composition
The native molecular mass of TcGST1 was estimated by gel filtration to be approximately 54 ± 0.9 kDa (data not shown). SDS-PAGE resulted in a single protein band with Mr values of 27.5 ± 0.5 and 26.8 ± 0.6 kDa for TcGST1 and TcGST2, respectively (fig. 2). Based on these results, both TcGSTs exist as classical GST dimers. TcGST2 was unsuitable for gel filtration because a low amount was obtained.
LC/ESI–MS/MS
To investigate the molecular nature of TcGST1 and TcGST2, peptide mass spectrophotometric analyses were carried out with purified parasite GSTs. The TcGST1 and TcGST2 peptides share 78.2% and 80.6% identity, respectively, with the sequence of the related GST from T. solium (GenBank: AAM64045.1) (fig. 3). More than 30% of the T. solium sequence was covered by the parasite enzyme peptides. When the peptide sequences of TcGST1 and TcGST2 were compared, a higher identity (86%) was observed. Notably, TcGST1 and TcGST2 differ by five amino acids. Most of the amino acid differences between these GSTs are present in the N-terminus, which contains the active site for GSH. All of these observations strongly support the notion that both TcGST1 and TcGST2 are different GSTs from that of T. solium.

Fig. 3. Alignment of peptide-size sequences of TcGST1 and TcGST2 with glutathione transferase of T. solium (TsGST) (GenBank: AAM64045.1). The T. crassiceps residues were obtained by high-resolution mass spectrophotometry with 78.2 and 80.6% of amino acid identity and 39.7 and 30.6% of amino acid sequence coverage for TcGST1 and TcGST2, respectively. The amino acid residues in bold indicate the differences between TcGST1 and TcGST2 (86 similitude percentage). The arrows above the amino acids indicate the differences between T. crassiceps GSTs and TsGST. Residue numbers within the alignment are shown above the sequences.
Kinetic properties
The substrate specificities of the individual GSTs were determined (table 2). Both enzymes showed a maximum preference for CDNB, with approximately 13-fold higher activity than for any other analysed substrate. The activity observed for 1,2-dichloro-4-nitrobenzene, a μ-family marked substrate, was very similar for both enzymes as well as for rat and mouse GSTs (Mannervik & Danielson, Reference Mannervik and Danielson1988; Hayes & Pulford, Reference Hayes and Pulford1995). BST, 1,2-epoxy-3-(p-nitrophenoxy) propane and ethacrynic acid did not act as substrates for either enzyme. Similarly, when the function of GSH peroxidase was analysed using cumene hydroperoxidase as the substrate there was no GST activity in both enzymes. However, both GSTs were highly reactive with μ-family marked lipid peroxides; TcGST1 catalysed trans-trans-2,4-decadienal better than trans-trans-2,4-hexa- and nona-dienal, while TcGST2 demonstrated similar activities towards these three lipid peroxides.
Table 2. Specific activity of TcGST1 and TcGST2 from T. crassiceps with selected substrates.
All values are means ± SD of the least triplicate determination (ND, not detectable).
Determination of T. crassiceps GST catalytic constants
Steady-state kinetics were investigated for both forms of the purified parasite GSTs, using GSH and CDNB as substrates. When the assays were carried out with various concentrations of GSH or CDNB, both enzymes were saturated at a concentration of 2 mm for both GSH and CDNB. No substrate inhibition was observed for GSH up to 4 mm, or 2.5 mm for CDNB, for any parasite GST. The kinetic parameters of the enzymes from T. crassiceps are shown in table 3. For TcGST1, K cat/K m(CDNB) = 7.2 × 10⁴ m−1 s−1, K cat/K m(GSH) = 1.75 × 10⁴ m−1 s−1 and the V max values for GSH and CDNB = 23 and 149 μm min−1 mg−1, respectively. For TcGST2, K cat/K m(CDNB) = 1.9 × 10³ m−1 s−1, K cat/K m(GSH) = 9.8 × 10³ m−1 s−1 and the V max values for GSH and CDNB = 7 and 5 μm min−1 mg−1, respectively. Background corrections were minimal.
Table 3. Kinetic parameters of TcGST1 and TcGST2 from T. crassiceps.

Kinetic parameters were obtained by varying the concentration of one substrate while maintaining constant and saturating the concentration of the second substrate.
TcGST1 and TcGST2 susceptibility to pH and temperature
Figure 4A shows the effects of pH on the transferase activities of TcGST1 and TcGST2, indicating optimum values of pH = 9.0 and 7.5 for TcGST1 and TcGST2, respectively. Moreover, TcGST1 exhibited sharper decreases on either side of its optimum pH compared with TcGST2, which exhibited low activity at acidic pH values and high activity at basic pH values.
Fig. 4. Dependence of the transferase activity of TcGST1 and TcGST2 on pH and temperature. Enzyme assays were carried out as described in the Materials and methods section by varying either pH at 25°C (A) or temperature at pH 6.5 (B), using CDNB as a substrate and GSH as co-substrate. Each point represents the average of two independent experiments.
Figure 4B shows the effects of temperature; TcGST1 activity was only slightly affected across the temperature range of 5–60°C, but enzyme activity was lost at higher temperatures. The transferase activity of TcGST2 was stable from 30 to 45°C but disappeared quickly at higher temperatures.
Additionally, both enzymes were stable at 20°C and 37°C for 30 min. Notably, the TcGST1 and TcGST2 optimum values (35°C and 40°C, respectively) were nearly coincident with the body temperature of the intermediate host of T. crassiceps (39°C).
Inhibition studies (IC50, K i, simple inhibition system)
Several inhibitors that have been used extensively to characterize mammalian GSTs were tested for their ability to inhibit the CDNB-conjugating activity of the two purified enzymes. The two enzymes exhibited very different sensitivities to inhibition. Additionally, only TcGST1 was 100% inhibited by any of the tested inhibitors, whereas TcGST2 only reached 60–80% inhibition. Further investigation is currently under way to gain more insight into this phenomenon.
TcGST2 was more sensitive to inhibition by the five tested inhibitors by four- to several thousand-fold compared to TcGST1. CB, a major α-family marker and lower μ-family marker, resulted in the lowest inhibition for TcGST1, but an opposite effect was observed for TcGST2. Inhibition was tested for both enzymes by examining the effects of a constant concentration (approximately the IC50) of the inhibitor on the K m (CDNB) and V max values of TcGST1; however, inhibition and K i values were not obtained for TcGST2. The results are shown in table 4 and fig. 5; non-competitive inhibition was observed for CB, RB, BST and Hm, while indomethacin was found to be uncompetitive.

Fig. 5. Representative Lineweaver–Burk plots of TcGST1 with CDNB as substrate. Initial velocities of TcGST1 activity (1/V 0) versus 1/[CDNB] (mm) in the absence (squares) and presence of 0.25 μm (circles) and 0.75 μm haematin (triangles) with various concentrations of CDNB (0.25–1.5 mm) describing a non-competitive inhibitor. The smaller graph shows the secondary plot of 1/V max values derived from the primary Lineweaver–Burk plot versus haematin concentrations, for the determination of K i.
Table 4. Inhibition sensitivities of TcGST1 and TcGST2 from T. crassiceps.

The assays were performed in triplicate and at least six concentrations of inhibitor were used to calculate the parameter IC50, which gives the inhibitory concentration causing 50% inhibition; K i, is the catalytic constant value. To obtain K i and inhibition type, two inhibitor concentrations were used; 1 mm GSH and 0.25–1.5 mm of CDNB as the second substrate were used.
NC, non-competitive; UN, uncompetitive; ND, not determined.
Discussion
Despite the extensive use of T. crassiceps for research into vaccination regimens, immune diagnosis, inflammatory responses and pharmacological studies (Willms & Zurabian, Reference Willms and Zurabian2010; Sciutto et al., Reference Sciutto, Fragoso and Larralde2011; Almeida et al., Reference Almeida, Miguel, de Souza and Clare2014) using xenobiotics and endobiotic toxic products, information concerning GST and its detoxifying role is lacking for this cestode.
In this study, for the first time, two forms of GST were resolved, purified to homogeneity from T. crassiceps cytosol using GSH–sepharose affinity chromatography and characterized, both biochemically and kinetically. Following a single purification step, which involved a wide GSH elution gradient, TcGST1 and TcGST2 were separated at the beginning and end of the gradient, respectively. Due to the low amounts of TcGST2 present in the cytosol fraction of T. crassiceps, this GST was only obtained in overloaded columns. A prominent feature of GST in an organism is the existence of isoenzymes; thus, these two parasite cytosolic GST isoforms coincide with the multiple GSTs found in most organisms, as described by Mannervik (Reference Mannervik1985). This procedure required less time to complete than methods that use several steps to obtain purified GST isoforms. Hence, we recommend that studies investigating a single GST obtained via affinity chromatography look for additional GST isoforms (Jaffe & Lambert, Reference Jaffe and Lambert1986; Rao et al., Reference Rao, Salinas and Mehta2000) using a GSH concentration gradient instead of a single GSH concentration. The use of a gradient increases the possibility of separating biochemically similar proteins.
We detected only one protein band with an apparent M r of 27 ± 0.7 for each of the enzymes in SDS-PAGE slab-gels analysed under reducing conditions. Additional studies utilizing gel filtration (data not shown) revealed the dimeric nature of TcGST1 and TcGST2, which are each composed of two equivalent (or very similar) subunits with an apparent M r of 54.3 ± 0.9. The observed molecular weights of both T. crassiceps transferases fall within a previously reported range for GSTs (Habig & Jakoby, Reference Habig and Jakoby1981).
The protocol utilized to purify the two T. crassiceps GST isoforms is shown in table 1. Affinity chromatography resulted in 67- and 49-fold purification for TcGST1 and TcGST2, respectively. The stability of TcGST1 and TcGST2 to both pH and heat indicates that these molecules remain active under adverse physiological conditions.
The peptide sequences of both homogeneous parasite proteins (fig. 3), analysed by LC/MS/MS, matched the GST T. solium amino acid sequence (http://blast.nvbi.nlm.nih.gov/BLAST.cgi), confirming the molecular nature of the T. crassiceps enzymes. Notably, TcGST1 and TcGST2 differed by five amino acids, indicating these proteins are two GST isoforms from the same parasite. Additionally, RNA-seq analysis of contigs 02546 and 02741, obtained from Dr Juan F. Alzate-Froilan (Centro Nacional de Secuenciación Genómica, Universidad de Antioquia, Medellin, Colombia; pers. comm.), were shown to be T. crassiceps-specific GSTs and matched the TcGST1 and TcGST2 peptide sequences, respectively.
Both T. crassiceps GSTs exhibited similar GST (EC 2.5.1.18) activities, determined using the prototype substrate CDNB, to those of other mammalian and metazoan parasites (Clark, Reference Clark1989). A survey of several model substrates revealed that TcGST1 and TcGST2 have distinct but overlapping substrate specificities compared to those of S. mansoni (O'Learly & Tracy, Reference O'Learly and Tracy1988).
The comparison of several model substrates using both T. crassiceps GSTs and Ts26GST from T. solium, a closely phylogenetically related cestode (Plancarte et al., Reference Plancarte, Rendon and Landa2004), indicated that both T. crassiceps GSTs exhibited the same catalytic substrate pattern as Ts26GST, but TcGST1 and TcGST2 demonstrated the lowest catalytic values for all substrates. Additionally, CDNB exhibited the highest catalytic activity for the three GSTs compared to the other substrates. These observations may indicate the close relationship between the GST detoxification mechanisms of T. crassiceps and T. solium. Differences in transferase activity intensity between both cestode species may be explained by their tissue location within the parasite. Most T. solium cysticerci live in tissues that are highly blood-irrigated, such as the muscles and CNS, while T. crassiceps cysticerci are found in the mouse peritoneal cavity, with very little blood irrigation.
Interestingly, TcGST1 and TcGST2 conjugated a trans-trans-2,4-dienal series with GSH. The reactive-carbonyl-conjugating activities of the enzymes increased proportionally to the carbonyl chain length in a similar manner to Moniezia expansa GSTs (Brophy, Reference Brophy, Southan and Barret1989b) but with approximately tenfold higher activity. Because these dienals are secondary products of lipid peroxidation, they may be natural substrates for T. crassiceps (O'Learly & Tracy, Reference O'Learly and Tracy1988).
Ts26GST also recognized the trans-trans-2,4-dienal series utilized in this study, but as a ligandin (Plancarte et al., Reference Plancarte, Romero, Nava, Reyes and Hernandez2014); whether Ts26GST conjugates GSH, similarly to TcGST1 and TCGST2, is unknown. Moreover, whether T. crassiceps GSTs possess ligandin functions remains unknown. Based on these observations, these two transferase phylogenetic groups may accommodate dissimilarities in the active and passive detoxification processes of cestodes, such as molecular trafficking, signal transduction, protein catabolism and modulation, and/or ion-channel formation (Frova, Reference Frova2006), and act as non-covalent binding proteins for a range of hydrophobic ligands (Hayes et al., Reference Hayes, Flanagan and Jowsey2005).
Sensitivity to GST inhibitors differed greatly between the two T. crassiceps GSTs. TcGST1 was more than 2000-fold less sensitive than TcGST2 to all tested inhibitors with the exception of Hm; however, the IC50 values of CB, BST, RB and indomethacin for the TcGST1 and TcGST2 isoenzymes are similar to those of mammalian enzymes. Notably, TcGST1 was most highly inhibited by the mammalian enzyme Hm (Mannervik, Reference Mannervik1985) and was 38-fold more sensitive than Ts26GST (Plancarte et al., Reference Plancarte, Romero, Nava, Reyes and Hernandez2014). Additionally, TcGST1 inhibited Hm in a non-competitive manner, as did Ts26GST, but with higher affinity. These results, combined with those obtained from a preliminary ligandin assay utilizing TcGST1, suggest that this enzyme may function as a ligandin, elevating its biological purpose beyond just that of an enzyme.
In the present study, the K m values (pH 6.5) of GSH were 0.55 mm and 0.3 mm for the TcGST1 and TcGST2 isoenzymes, respectively. These values are comparable to the majority of values reported for invertebrate GSTs (Clark, Reference Clark1989). Furthermore, these values indicate that both enzymes operate close to a state of saturation with respect to GSH. This compound is likely to be encountered in vivo in the range of 0.5–10 mm (Penninckx & Jaspers, Reference Penninckx and Jaspers1982).
Based on the data presented here, T. crassiceps GST isoenzymes resemble those of vertebrates and invertebrates; however, these findings are not sufficient to place them in a definitive GST class. Molecular cloning of the GST genes encoding these two isoenzymes is currently under way to elucidate differences between the molecular structures of these enzymes and those derived from other sources.
Thus far, the T. crassiceps transcriptome database is the only published reference discussing GSTs in this parasite (García-Montoya et al., Reference García-Montoya, Mesa-Arango, Isaza-Agudelo, Agudelo-Lopez, Cabarcas, Barrera and Alzate2016) and was useful in supporting the characterization of TcGST1 and TcGST2. The information obtained in this study increases the utility of T. crassiceps as a model for the investigation of multifunctional GSTs.
Acknowledgements
The authors wish to thank Dr Juan F. Alzate (Centro Nacional de Secuenciación Genómica, Universidad de Antioquia, Medellin, Colombia) for kindly sharing his T. crassiceps GST contig results with us.
Financial support
This study was funded by a grant from the Universidad Nacional Autónoma de México, DGAPA (PAPIIT IN202816).
Conflicts of interest
None.
Ethical standards
The authors assert that all procedures contributing to this work comply with the ethical standards of the laws of Mexico regarding the care and use of laboratory animals. Animal studies were performed under an institutional protocol similar to that of the US Public Health Service Guide for the care and use of laboratory animals from the Secretariat of Agriculture (SAGARPA NOM-062-ZOO-1999).