INTRODUCTION
Immunoglobulin E plays a role in protection against helminth infection and in the development of allergies. For example, high IgE responses are associated with resistance to reinfection with Schistosoma haematobium (Hagan et al. Reference Hagan, Blumenthal, Dunn, Simpson and Wilkins1991) and Schistosoma mansoni (Dunne et al. Reference Dunne, Butterworth, Fulford, Kariuki, Langley, Ouma, Capron, Pierce and Sturrock1992). Among the nematodes, expulsion of Trichinella spiralis, but not Nippostrongylus brasiliensis is mast-cell dependent (Lawrence, Reference Lawrence2003). Similarily, IgE responses in sheep have been associated with several parasitic diseases of sheep (Shaw et al. Reference Shaw, Pfeffer and Bischof2009). Further, sheep with higher concentrations of globule leucocytes (degranulated mast cells) had lower numbers of Teladorsagia circumcincta following reinfection (Stear et al. Reference Stear, Bishop, Doligalska, Duncan, Holmes, Irvine, McCririe, McKellar, Sinski and Murray1995). As the major mechanism leading to mast cell degranulation involves cross-linking of IgE on the mast cell surface, IgE is implicated in resistance to nematodes as well as schistosomes.
Therefore the genetic control of IgE responses is of considerable interest. The first human immune response gene to be identified was the MHC association with ragweed allergy (Levine et al. Reference Levine, Stember and Fotino1972). Subsequent studies have confirmed the role of the MHC and also implicated variation in T-cell receptors (Moffat et al. Reference Moffat, Schou, Faux and Cookson1997). The heritability of IgE responses to Trichostrongylus colubriformis was estimated at 0·36 in New Zealand lambs (Shaw et al. Reference Shaw, Morris, Green, Wheeler, Bisset, Vlassoff and Douch1999) but the heritability of responses to T. circumcincta has not been investigated. The heritability is of interest in its own right but is also required for the design of experiments to identify specific genetic determinants that influence IgE activity. The aims of this paper were to quantify the distribution of IgE responses to T. circumcincta among lambs, to examine the importance of effects such as sex and pedigree relationships, to identify allergenic molecules, to develop an antigen-specific ELISA and to test whether the allergen-specific response was associated with reduced egg counts.
MATERIALS AND METHODS
Animals
The sheep were sampled from Roslin Institute's Blythbank farm in the Scottish Border region. The flock was created by upgrading a small flock of Texel-Oxford Down ewes and by purchasing purebred Texel ewes. These ewes were crossed with purebred Texel rams which came from 3 sources: they were donated by the Texel Sire Reference scheme, purchased or bred at Blythbank farm.
Blood and faecal samples were collected from the lambs on 3 occasions, in early summer (July), mid-summer (August) and late summer (September). The lambs were weighed at the time of sample collection. In July, the lambs were approximately 5 months old. Each sampling took place 4 weeks after anthelmintic treatment. Ivermectin (Oramec drench, Merial Animal Health) was rotated between years with levamisole (Nilverm, Schering-Plough Animal Health).
Faecal nematode egg counts
Faecal egg counts have been reported previously on these animals (Bishop et al. Reference Bishop, Jackson, Coop and Stear2004). They were estimated by a modification of the technique developed at the Moredun Institute (Bishop et al. Reference Bishop, Jackson, Coop and Stear2004). Nematodirus species were counted separately. For non-Nematodirus species, the arithmetic mean counts were 93, 79 and 155 eggs per gram in early, mid and late summer. The geometric means were 17, 22 and 41 eggs per gram respectively.
ELISA
Third-stage (L3) and fourth-stage (L4) larvae were a gift from Dr Frank Jackson of the Moredun Research Institute and were maintained by passage through parasite-naïve sheep. The assays for IgE and IgA specific antibodies to the L3 and L4 stage were performed as described previously (Pettit et al. Reference Pettit, Jackson, Rocchi and Huntley2005), employing the mouse monoclonal anti-ovine IgE, clone 2F1, (Bendixsen et al. Reference Bendixsen, Windon, Huntley, MacKellar, Davey, McClure and Emery2004), and anti-ovine IgA (Serotec, Oxford, UK). Detection was with the goat anti-mouse – HRP (Dako), and reaction product was revealed with diaminobenzidine/urea/H2O2 substrate (SigmaFastTM DAB tablet, Sigma).
Preparation of T. circumcincta L3 somatic larvae
L3 parasites were suspended in rehydration buffer (8 m urea, 2% CHAPS, 50 mm DTT, 0·2% pH 3–10 ampholytes) (Bio-Rad, Hercules, CA, USA) containing protease inhibitors (1 tablet/10 ml, Complete mini protease inhibitor cocktail, Roche Diagnostics, Mannheim, Germany) and homogenized in a ribolyser using 2 mm stainless steel ball bearings. Disruption of parasites was monitored by microscopic examination. The preparation was then centrifuged at 16 000 g for 5 min to pellet debris and the somatic extract containing supernatant was collected. The larval extracts were treated with the ReadyPrep 2D clean-up kit (Bio-Rad) to remove any contaminants and resuspended again in rehydration buffer. Protein concentrations were determined using the 2D Quant kit (GE Healthcare, Buckinghamshire, UK) and aliquots stored at −80°C.
2-D gel electrophoresis
Isoelectric focusing was performed using the Protean® IEF system (Bio-Rad). Samples in rehydration buffer (200 μg) were actively loaded onto 11 cm pH 4–7 immobilized pH gradient (IPG) strips at 50 V, 20°C for 12 h then focused using a step voltage programme (500 V 1 h, 1000 V 1 h, 8000 V 40 kVh). Focused strips were then reduced and alkylated via two 15 min incubations in equilibration buffer (6 m urea, 0·375 m Tris, pH 8·8, 2% SDS, 20% glycerol) containing 2% (w/v) DTT in the first incubation then 2·5% (w/v) iodoacetamide in the second incubation. Equilibrated proteins were then separated in the second dimension on 11 cm 4–12% bis-Tris Criterion pre-cast SDS-PAGE gels (Bio-Rad) in MES buffer at 200 V. Gels were visualized using Bio-safe Coomassie stain and documented with MagicScan software on a UMAX scanner.
Western blotting
Proteins separated by 2-D gel electrophoresis were transferred onto polyvinylidene difluoride membranes using a Criterion blotter (Bio-Rad) in cold transfer buffer (25 mm Tris, 192 mm glycine, 20% (v/v) methanol pH 8·3) at 100 V for 30 min. Membranes were blocked overnight in 5% skimmed milk in Tris-buffered saline/0·1% Tween 20 (TBS-T) at 4°C then washed 3 times for 5 min with TBS-T. A pool of serum diluted 1:20 in TBS-T was added to the membrane and the membrane was incubated for 1 h at RT then washed 3 times in TBS-T. The membrane was then incubated with 1:1000 dilution 2F1 anti-ovine IgE antibody for 1 h. After washing, membranes were incubated with 1:10 000 dilution of horseradish peroxidase-conjugated anti-mouse IgG (Abcam, Cambridge, UK). The chemiluminescent reaction was developed with ECL Plus reagents (GE Healthcare) according to manufacturer's instructions with films exposed to the blots between 5 and 10 sec. Spots were matched by a combination of visual comparison of the Coomassie-stained gel and the exposed film and digital comparison of scanned images using Progenesis PG200 software (Nonlinear Dynamics, Newcastle, UK).
Mass spectrometry
Tandem mass spectrometry was carried out as previously described (Mutapi et al. Reference Mutapi, Burchmore, Mduluza, Foucher, Harcus, Nicoll, Midzi, Turner and Maizels2005). Briefly, spots of interest were excised from the 2-D gels using sterile disposable scalpel blades then subjected to in-gel trypsin digestion. Gel pieces were washed 3 times in 100 μl of 50 mm ammonium bicarbonate, 50% (v/v) methanol and then twice in 100 μl of 75% (v/v) acetonitrile, before drying. Gel pieces were rehydrated with trypsin solution (20 μg trypsin/ml 20 mm ammonium bicarbonate), and incubated for 4 h at 37°C. Peptides were extracted from the gel pieces by washing twice in 100 μl of 50% (v/v) acetonitrile/0·1% (v/v) trifluoroacetic acid, before being transferred in solution to a fresh 96-well plate and dried before mass spectrometry analysis.
All peptide samples were separated on an LC system (Famos/Switchos/Ultimate, LC Packings) before being analysed by electrospray ionisation (ESI) mass spectrometry on a Q-STAR® Pulsar i hybrid LC/MS/MS System. Peptide separation was performed on a Pepmap C18 reversed phase column (LC Packings), using a 5–85% (v/v) acetonitrile gradient (in 0·5% (v/v) formic acid) run over 45 min. The flow rate was maintained at 0·2 μl/min. Mass spectrometric analysis was performed using a 3 sec survey MS scan followed by up to 4 MS/MS analyses of the most abundant peptides (3 sec per peak) in Information Dependent Acquisition (IDA) mode, choosing 2+ to 4+ ions above threshold of 30 counts, with dynamic exclusion for 180 sec.
Data from mass spectrometry analysis were analysed using Applied Biosystems Analyst QS (v1.1) software and the automated Matrix Science Mascot Daemon server (v2.1.06). Protein identifications were assigned using the Mascot search engine (Perkins et al. Reference Perkins, Pappin, Creasy and Cottrell1999), which gives each protein a probability based Mowse score. In all cases variable methionine oxidation and carbamidomethylation as a fixed modification were used for searches. An MS tolerance of 1·2 Da for MS and 0·4 Da for MS/MS analysis was used. Only protein identifications with a significant score (P<0·05) were accepted.
Sequencing of tropomyosin
L3 cDNA was kindly provided by Dr A Nisbet (Moredun Research Institute). Since no published sequence is available for T. circumcincta tropomyosin and in order to amplify the entire coding region, primers were designed from available homologous tropomyosin sequences from T. colubriformis (Acc no. A44980), O. volvulus (Acc no. Q25632), T. spiralis (Acc no. Q95VA8) and A. viteae (Acc no. o01673). The primer sequences were forward, 5′-rcmaaaatggaygcvatyaag-3′ reverse, 5′-tyartakccrradarttcytg-3′. Universal bases were used where the sequences did not match. PCR amplification was carried out in 50 μl reactions containing 0·25 μm dNTPs, 3·5 mm Mg+, 0·5 μm primers and 1x Advantage 2 Polymerase (Clontech, Mountain View, CA, USA) under the following cycling conditions; 95°C for 5 min, then 30 cycles of 95°C for 30 s, 50°C for 30 s, 72°C for 3 min, then a final extension of 72°C for 15 min. Products were ligated into the TOPO TA vector, transformed into TOP10 competent cells (Invitrogen) and colonies sequenced in both directions using Big Dye (Applied Biosystems). Sequences were then analysed using Bioedit software and compared to the helminth sequences listed above. The predicted protein sequence was aligned using the Clustalw multiple alignment tool in Bioedit software.
Cloning, expression and purification of tropomyosin
Using a positive clone as template, tropomyosin was amplified using an altered forward primer (5′-caccatggaygcsaatyaagaag-3′) to allow directional cloning into the Champion pET 160 expression vector (Invitrogen). Plasmid DNA was isolated using Qiagen miniprep kits, clones containing the correct product were determined by sequencing then transformed into BL21(DE3) cells and expression induced with IPTG. The cells were then lysed to extract the insoluble protein (50 mm potassium phosphate, 400 mm NaCl, 100 mm KCl, 10% glycerol, 0·5% Triton X-100, 10 mm imidazole) and protein detected using the Lumio green detection kit which recognizes a Lumio tag upstream of the cloned sequence in the expression vector. Tropomyosin was then purified on His-trap HP columns attached to AKTA UPC-900 (GE Healthcare). The protein was first resuspended in binding buffer containing 8 m urea (0·5 m NaCl, 5 mm imidazole, 20 mm NanHnPO4), then slowly loaded onto the column. The column was washed with binding buffer containing 20 mm imidazole to remove any contaminants or loosely bound protein, then the protein slowly refolded over a gradient from 8 m to 0 m urea. Following this, the recombinant tropomyosin was then eluted using a gradient up to 0·5 m imidazole. In order to avoid interference with the ELISA by imidazole, recombinant protein was dialysed overnight at 4°C with 10 mm Tris-Cl, pH 8·5, the buffer was then changed and further dialysed for a further 4 h.
Tropomyosin ELISA
Recombinant tropomyosin, diluted to 5 μg/ml in 0·05 m sodium bicarbonate buffer, pH 9·6, was coated onto microtitre plates overnight at 4°C. Plates were washed 5 times in wash buffer (TBS, 0·05% (v/v) Tween 20) then incubated with blocking buffer (5% (w/v) semi-skimmed dried milk in wash buffer) for 2 h at 37°C with shaking. Plates were then washed again and ovine serum diluted 1/5 in blocking buffer from individual sheep added for 45 min at 37°C with shaking. After washing the plates, the monoclonal anti-ovine IgE antibody 2F1 diluted 1/1000 in blocking buffer was added and incubated for a further 45 min. Following washing, polyclonal biotinylated goat anti-mouse antibody (E0433) diluted 1/5000 in blocking buffer was added, the plate incubated for a further 45 min, then washed again and horseradish peroxidase-conjugated streptavidin (P0397) diluted 1/5000 added for 45 min (both Dakocytomation, Glostrup, Germany). After washing, 100 μl of TMB peroxidase (KPL, Gaithersburg, MD, USA) was added to the wells for 10 min, after which the reaction was stopped with 100 μl of H2SO4 and the OD values read at 450 nm. All samples were assayed in duplicate and a high IgE pool, a low IgE pool and a no serum control added to each plate. After subtraction of the background value final values were expressed as an optical density index (Sinski et al. Reference Sinski, Bairden, Duncan, Eisler, Holmes, McKellar, Murray and Stear1995) calculated as follows; Optical density index=(Mean OD of test samples – Mean OD of low pool)/(Mean OD of high pool – Mean OD of low pool).
Statistical analyses
The data were analysed with the SAS system (SAS Institute, Cary, NC, USA). The Univariate and Capability procedures were used to summarize the distributions among animals. The graphs were drawn with the Gchart and Capability procedures while the Capability procedure was used to compare the observed distributions to the Gamma, Lognormal and Weibull distributions. Three goodness-of-fit tests were used (Anderson-Darling, Cramer-von Mises, and Kolmogorov-Smirnov). They are based on the empirical distribution function (EDF). The EDF tests offer advantages over the chi-square goodness-of-fit test, including improved power and invariance with respect to the histogram midpoints (Stephens, Reference Stephens1974).
The Corr procedure in the SAS statistical package was used to estimate Pearson product-moment correlations. All antibody responses were transformed before correlation analysis. The transformations were logarithmn (IgA+0·001) and (IgE+0·001)0·25.
Generalized linear models assume that the data follow a distribution drawn from the exponential family of distributions such as the gamma or normal distribution (McCullagh and Nelder, Reference McCullagh and Nelder1989). In order to provide reliable inferences, the fit of the data was examined before analysis. For data that did not conform to the gamma or normal distributions, a Box-Cox transformation was applied. Box-Cox transformations are a family of data transformations designed to achieve a normal distribution of the transformed variable (Sokal and Rohlf, Reference Sokal and Rohlf1995). The Box-Cox transformation has the form: (yλ−1)/λ; when λ is not equal to zero or when λ=0, log(y). This family of transformations of the positive dependent variable y is controlled by the parameter λ. Transformations linearly related to square root, inverse, quadratic, cubic, and so on are all special cases. The Boxcox transformation in the Transreg procedure of SAS (Cary, NC, USA) was used. The parameter λ was varied between −3 and +3 in steps of 0·25. The optimal power parameter was chosen by maximum likelihood.
The Mixed procedure in SAS was used for generalized linear mixed modelling while the ASReml program was used to estimate heritabilities in an animal model. Fixed effects that were explored in these analyses included year of birth, sex, age of dam, sire genetic group and dam genetic group, and day of birth as a covariate, while lamb and dam nested within sire were fitted as random effects. The pedigree contained 1126 animals. The residual option in the model statement was used to produce the panels of diagnostic information on the residuals used in Fig. 3.
RESULTS
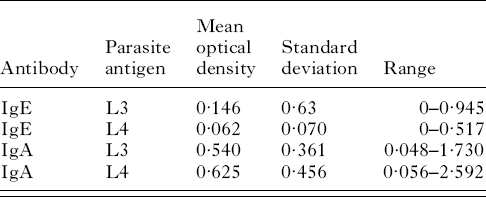
Table 1 contains the mean optical density, the population standard deviation and the range for plasma IgE activity against third-stage larvae in the 222 lambs tested. Table 1 also contains the mean optical density, the population standard deviation and the range for plasma IgE activity against fourth-stage larvae as well as plasma IgA activity against third and fourth-stage larvae.
Table 1. IgA and IgE responses to the larval stages of Teladorsagia circumcincta

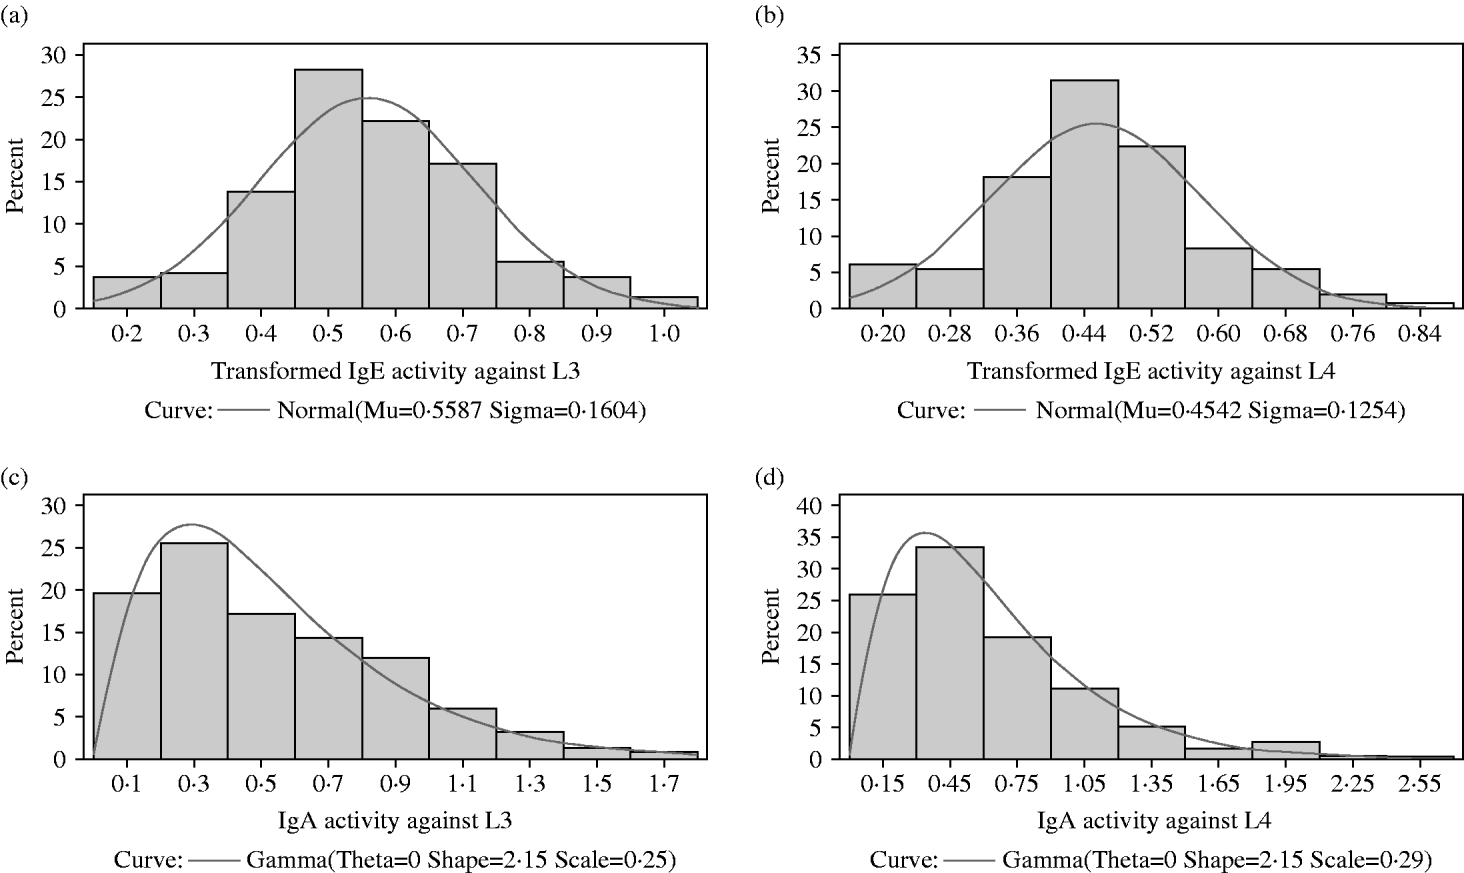
The distributions of IgA and IgE activity against third and fourth-stage larvae were very skewed with most animals having relatively low levels of activity. In all 4 responses, a small proportion of lambs had quite high activity. Both IgA distributions were not significantly different from a gamma distribution (P>0·05) but the IgE distributions were significantly different (P<0·05) from normal, gamma, lognormal and Weibull distributions (Figs 1a, b and 2a, b). Figure 2c and d show the IgA distributions with a superimposed gamma distribution. As several animals had IgA activities of zero, 0·001 was added to all the optical density readings before fitting the gamma distribution. Clearly, the gamma distribution provides a reasonable but not perfect fit to these data.
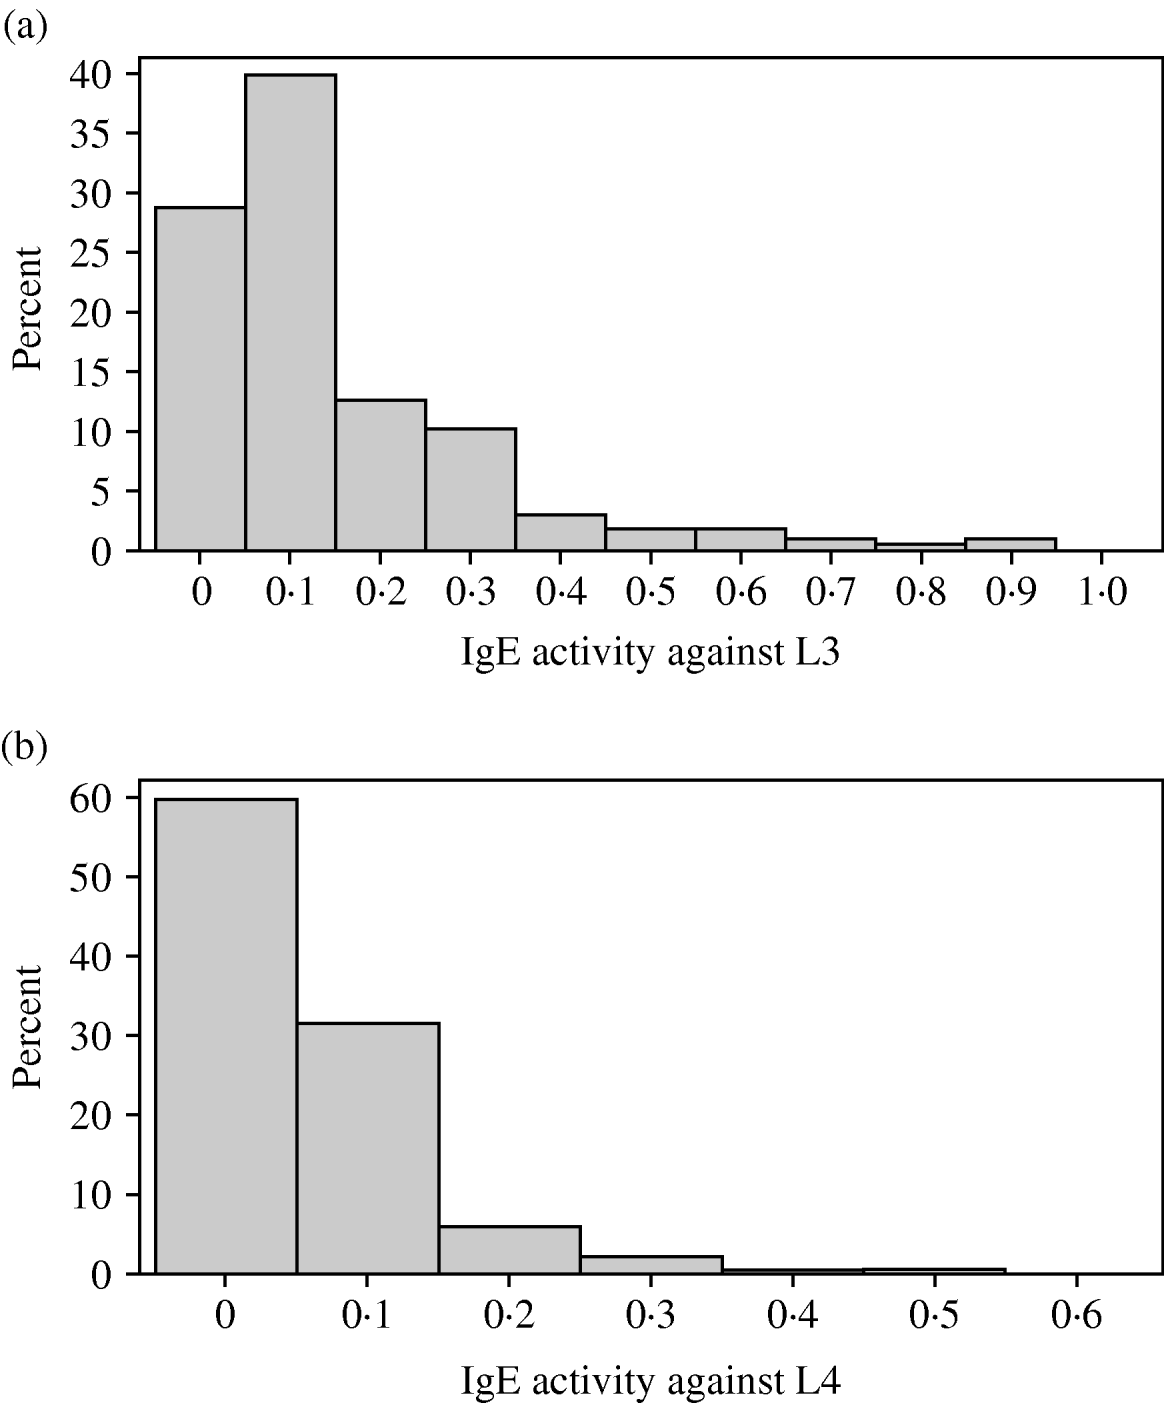
Fig. 1. (a) Variation among lambs in IgE activity against third-stage larvae of Teladorsagia circumcincta. (b) Variation among lambs in IgE activity against fourth-stage larvae of T. circumcincta.

Fig. 2. (a) The distribution among lambs of transformed IgE activity against third-stage larvae. A normal (Gaussian) distribution has been superimposed. The sample mean and sample standard deviation are provided below the x-axis and were used to draw the superimposed normal distribution. (b) The distribution among lambs of transformed IgE activity against fourth-stage larvae. A normal (Gaussian) distribution has been superimposed. The sample mean and sample standard deviation are provided below the x-axis and were used to draw the superimposed normal distribution. (c) The distribution among lambs of IgA activity against third-stage larvae. A gamma distribution has been superimposed. Maximum likelihood procedures were used to estimate the scale and shape parameters from the observations. The default value of 0 was used for the threshold parameter theta. (d) The distribution among lambs of IgA activity against fourth-stage larvae. A gamma distribution has been superimposed. Maximum likelihood procedures were used to estimate the scale and shape parameters from the observations. The default value of 0 was used for the threshold parameter theta.
A Box-Cox procedure was used to search for the most appropriate transformation to normalize the IgE data. For both the IgE activity against third-stage and against fourth-stage larvae, the optimal transformation was (X)0·25. As with IgA, several animals had IgE activities of zero. Therefore, 0·001 was added to all the optical density readings before transformation.
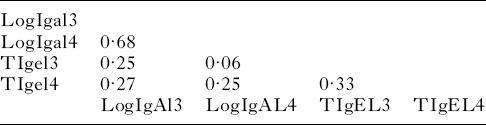
The correlations among parasite-specific antibody responses are presented in Table 2. The correlation between IgA activity against third and fourth-stage larvae was 0·68 (P<0·0001). This was much higher than the correlation between IgE activity against third and fourth-stage larvae: 0·27 (P<0·0001). Thus, there was a tendency for lambs with high IgA activity against third-stage larvae to have high IgA activity against fourth-stage larvae. With IgE, this tendency was much less pronounced. There was a weak but significant correlation between IgE and IgA activity against third-stage larvae 0·25 (P=0·0002). Similarly, there was a weak correlation between IgE and IgA activity against fourth-stage larvae: 0·25 (P=0·0002).
Table 2. Correlation matrix of transformed antibody activity against third- and fourth-stage larvae

All correlations were statistically unlikely to be due to chance (P<0·001) except the correlation (P=0·3454) between tIgel3 (transformed IgE activity against third-stage larvae) and logIgAl4 (log-transformed IgA activity against fourth-stage larvae).
We carried out 3 mixed model analyses on each of the transformed IgE responses. For IgE activity against third and fourth-stage larvae, the raw data were transformed by adding 0·001 then multiplying to the power 0·25. The first mixed model fitted the fixed effects of year of birth, sex, dam age, sire group and dam group. Day of birth was fitted as a fixed covariate while lamb and dam nested within sire were fitted as random effects.
For transformed IgE activity against L3, the probabilities for the fixed effects were year of birth (P=0·03), sex (P=0·75), date of birth (P=0·09), dam age (P=0·78), sire group (P=0·11) and dam group (P=0·87). The model was rerun after dropping sex, dam age and dam group. In this second model, the probabilities for the fixed effects were not significant (P>0·05). The heritability was then estimated in Asreml fitting only lamb and all known pedigree relationships. The heritability of transformed IgE activity against third-stage larvae was 0·39±0·16. Similarly, for transformed IgE activity against fourth-stage larvae, the effects of year of birth, sex, date of birth, dam age, sire group and dam group were not significant (P>0·05) and the heritability was estimated in Asreml fitting only lamb and all known pedigree relationships. The heritability of transformed IgE activity against fourth-stage larvae was 0·50±0·16.
Figure 3a and b show panels of marginal residuals following the analysis in the third mixed model of transformed IgE activity against third- and fourth-stage larvae. The panel shows in the upper left-hand quadrant a scatter-plot of residuals. These residuals are approximately evenly distributed around zero. The upper right-hand quadrant shows a histogram of residuals with an overlaid normal distribution indicating that the residuals conform roughly to a normal distribution. The lower left-hand quadrant shows a q-q (quantile-quantile) plot that ideally follows a straight line and the lower right-hand quadrant shows the summary statistics for the marginal residuals.

Fig. 3. (a) Panel of marginal residuals for transformed IgE activity against third-stage larvae. There is a scatter-plot of residuals in the upper left. These residuals are approximately evenly distributed around zero. The histogram of residuals with an overlaid normal distribution in the upper right-hand quadrant indicates that the residuals conform roughly to a normal distribution. The q-q plot in the lower left-hand section ideally follows a straight line and the lower right-hand quadrant shows the summary statistics for the marginal residuals. (b) Panel of marginal residuals for transformed IgE activity against fourth-stage larvae. There is a scatter-plot of residuals in the upper left. These residuals are approximately evenly distributed around zero. The histogram of residuals with an overlaid normal distribution in the upper right-hand quadrant indicates that the residuals conform roughly to a normal distribution. The q-q plot in the lower left-hand section ideally follows a straight line and the lower right-hand quadrant shows the summary statistics for the marginal residuals.
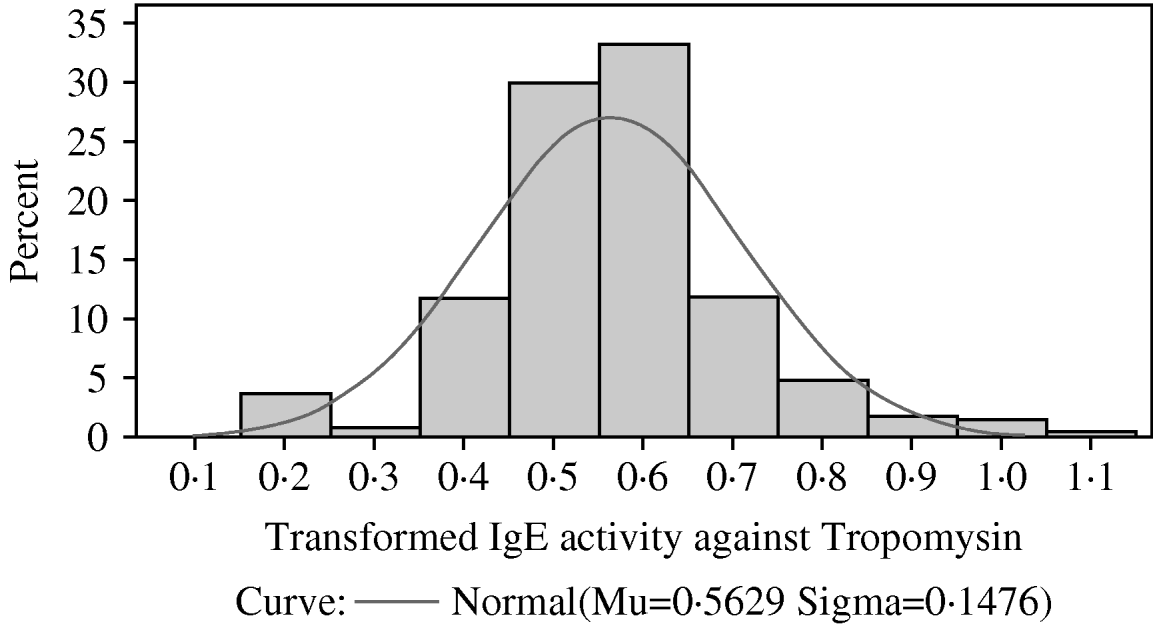
Fig. 4. The distribution among lambs of transformed IgE activity against recombinant tropomyosin larvae. A normal (Gaussian) distribution has been superimposed. The sample mean and sample standard deviation are provided below the x-axis and were used to draw the superimposed normal distribution.
Two-dimensional gel electrophoresis, Western blotting and tandem mass spectrometry were used to identify the targets of the IgE response against third-stage larvae. Nine proteins were identified from 17 spots (Fig. 5 and Table 3). The tropomyosin molecule was then cloned from cDNA from third-stage larvae, sequenced, expressed, purified and used as a target for further ELISA.

Fig. 5. Two-dimensional gel electrophoresis (2-DE) of Telodorsagia circumcincta third-stage larvae somatic extract. Proteins were separated in the first dimension across a pH 4–7 gradient, followed by SDS-PAGE on 4–12% gels and stained with Coomassie Blue. Western blots against this proteomic profile identified a panel of IgE-reactive spots as highlighted (spots 1–17) and are summarized in Table 3.
Table 3. Allergens identified in third-stage larvae from Teladorsagia circumcincta
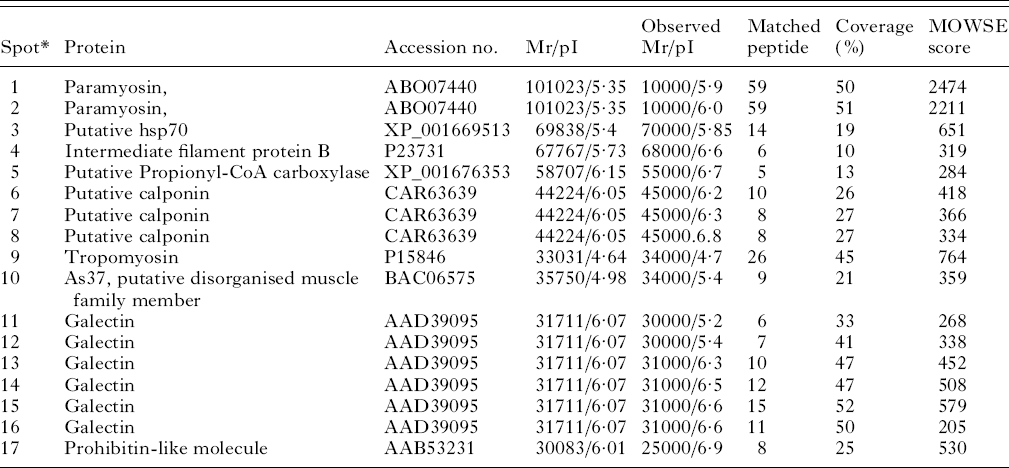
* Spots 1 and 1 were matched against Dictyocaulus viviparous, spots 3 and 5 against Caenorhabditis briggsae, spots 4 and 10 against Ascaris suum, spots 6,7 and 8 against Angiostrongylus cantonensis, spot 9 against Trichostrongylus colubriformis, spots 11–16 against Teladorsagia circumcincta and spot 17 against Toxocara canis.
The full-length tropomyosin molecule had an open reading frame of 855 base pairs and encoded a protein of 284 amino acids. The sequence has been submitted to GenBank (Accession no. GU290222). Figure 6 shows the alignment of the predicted protein with known nematode tropomyosins from T. colubriformis Tco (Acc no. A44980), O. volvulus Ovo (Acc no. Q25632), T. spiralis Tsp (Acc no. Q95VA8) and A. viteae Avi (Acc no. o01673). Numbering begins at the first residue of the mature protein. Regions of identity are shaded in black and differences from the T. circumcincta sequence highlighted in white.

Fig. 6. Amino acid alignment of predicted Teladorsagia circumcincta tropomyosin sequence (Tci) with known nematode tropomyosins, from T. colubriformis Tco (Acc no. A44980), O. volvulus Ovo (Acc no. Q25632), T. spiralis Tsp (Acc no. Q95VA8) and A. viteae Avi (Acc no. o01673). Numbering begins at the first residue of the mature protein. Regions of identity are shaded in black and differences from the T. circumcincta sequence are highlighted in white.
The highest homology was tropomyosin from T. colubriformis, with only 1 amino acid difference at position 230 (Fig. 6). Tropomyosin from O. volvulus, T. spiralis and A. viteae had 94, 91 and 92% identity to tropomyosin from T. circumcincta respectively.
As with IgE activity against mixtures of proteins from third-stage larvae and from fourth-stage larvae, IgE activity against recombinant tropomyosin was skewed with most lambs having relatively little IgE activity. Again, the observed distribution did not conform to a Gamma, Lognormal or Weibull distribution. A Box-Cox analysis again indicated that the optimal transformation was (X)0·25. Figure 4 shows that the transformed distribution resembled a normal distribution. Mixed model analyses showed that the fixed effects of year of birth, sex, dam age, sire group, dam group and day of birth (fitted as a fixed covariate) had no significant effect on transformed IgE activity against tropomyosin. The heritability of the transformed IgE response was 0·25±0·15.
The relationships between IgE activity against tropomyosin and faecal egg counts were examined by correlation analysis and in a general linear model that fitted year and sex as fixed effects and transformed IgE activity as a covariate. The correlations for egg counts in early, mid and late summer were −0·20 (P=0·01), −0·17 (P=0·02) and −0·12 (P=0·10) respectively. The mean of the 3 egg counts was used as the dependent variable in the general linear model. Year of birth (P<0·001) and sex (P=0·0145) were both associated with egg counts, with males having higher egg counts than females. Increased transformed IgE responses were also associated with decreased egg counts (P=0·03).
In a similar fashion, the relationship between IgE activity against tropomyosin and body weight was also examined by correlation analysis and in a general linear model that fitted year and sex as fixed effects and transformed IgE activity as a covariate. Body weight at the time of blood sampling in mid-summer was used as the dependent variable in the general linear model. The correlations between IgE activity and body weight in early summer, mid-summer and late summer were −0·04 (P=0·54), −0·15 (P=0·03) and −0·03 (P=0·69) respectively. As the serum samples used to estimate IgE activity were collected in mid-summer, these results show that there was a significant correlation between IgE and body weight at the time of sampling. However, there was no correlation between IgE activity against tropomyosin and body weights measured a month before blood sampling or body weights measured a month after sampling. In the general linear model, year of birth (P<0·001) and sex (P<0·001) were both associated with body weight, with males having higher weights than females. Increased transformed IgE responses were associated with decreased body weight (P=0·02). As with the correlation analysis, there was no association between IgE activity and body weight measured in early or late summer.
DISCUSSION
This study has quantified peripheral IgE activity against the larval stages of T. circumcincta and identified a suitable transformation to normalise IgE activity prior to analysis by general linear mixed modelling. A proteomics approach was used to identify target molecules. Tropomyosin was then cloned, sequenced, expressed, purified and used as a target in an antigen-specific ELISA. The relationship between IgE activity to tropomyosin and egg counts following reinfection was then examined in a general linear model, as was the relationship between IgE activity and body weight.
These sheep were exposed to infection with a variety of nematode species. A recent detailed analysis of nematodes present at necropsy in over 500 lambs on a farm less than 100 miles from the study site indicated that in this geographical region, the dominant nematode was T. circumcincta but several other species of nematodes were present including Trichostrongylus axei, Trichostrongylus vitrinus, and several different species from the genera Cooperia and Nematodirus (Stear et al. Reference Stear, Bairden, Bishop, Gettinby, McKellar, Park, Strain and Wallace1998).
Figure 6 demonstrates that tropomyosin from different nematode species had very similar amino acid sequences. If tropomyosins from the nematodes species present on our farm also have similar amino acid sequences and if the similar amino acid sequences produce structurally similar molecules with similar epitopes, then it is possible that antibodies raised against tropomyosin from the different nematodes may cross-react. Cross-reactions are also possible for most of the potential allergens in our study. T. circumcincta is the dominant nematode in our region, but in a natural infection, the antibody response to any single nematode species could be influenced by homologous molecules on other species. Cross-reactivity among antibody molecules could be partially responsible for the observed positive correlations among sheep in the intensity of infection with different nematode species (Stear et al. Reference Stear, Bairden, Bishop, Gettinby, McKellar, Park, Strain and Wallace1998) and the positive genetic correlations between resistance to different species (Gruner et al. Reference Gruner, Bouix and Brunel2004).
The composition of nematode communities in sheep varies across the world. In hot areas, such as much of Australia, East Africa and the southern United States, Haemonchus contortus predominates, in warm moist areas such as New Zealand the egg count is dominated by Trichostrongylus colubriformis while in cool temperate areas including Scotland the dominant nematode is T. circumcincta. Faecal nematode egg counts in cool temperate areas are much lower than in other areas (Stear et al. Reference Stear, Abuargob, Ben Othman, Bishop, Innocent, Kerr and Mitchell2006) and recommendations developed for one region cannot be applied to other regions. Furthermore there is a complex, non-linear relationship between egg counts and worm burdens (Bishop and Stear, Reference Bishop and Stear2000) and faecal egg counts cannot be used to estimate the intensity of infection with T. circumcincta.
Surprisingly, since the introduction of extremely effective anthelmintics, there have been very few investigations of egg counts in flocks of sheep following natural, predominantly T. circumcincta infection. Consequently, we do not know whether the mean counts in this study are unusually high or low for this area. However, the level of challenge was self-evidently sufficient to generate IgA and IgE responses. After excluding Nematodirus species, the heritabilities for faecal nematode egg counts in July, August and September were 0·38, 0·43 and 0·34 (Bishop et al. Reference Bishop, Jackson, Coop and Stear2004). Presumably, genetic variation in immune responses underlies genetic variation in faecal egg counts.
The mean optical densities for IgA activity were much higher than for IgE activity. However, the ELISA does not measure absolute antibody concentrations and a higher mean activity does not necessarily mean higher antibody concentrations.
IgE activity showed considerable variation among animals. Most animals had relatively low IgE activity but a small proportion of animals had relatively high IgE activities. IgA activity against third- and fourth-stage larvae followed a gamma distribution suggesting that generalized linear modelling would be appropriate for the analysis of these data. In contrast IgE activity did not conform to any of the distributions tested (Normal, lognormal, gamma or Weibull) and a Box-Cox analysis was used to successfully identify an appropriate transformation of these data.
The heritability of IgE activity was relatively high at 0·39 for third-stage larvae and 0·50 for the activity against fourth-stage larvae. These values are similar to and not significantly different from the estimated heritability of 0·56 for IgA activity (Strain et al. Reference Strain, Bishop, Henderson, Kerr, McKellar, Mitchell and Stear2002) and the estimated heritability of 0·36 for IgE activity against T. colubriformis (Shaw et al. Reference Shaw, Morris, Green, Wheeler, Bisset, Vlassoff and Douch1999). Together these results indicate that genetic variation is one of the most important influences on the variability of parasite-specific antibody activity among lambs from the same flock.
A proteomics approach was used to identify 9 different allergens from T. circumcincta. Tropomyosin was then chosen for further study for 2 reasons. With a relative molecular mass of approximately 33 000, it is a convenient size for cloning, sequencing and expression. It is also allergenic in several other organisms (Sereda et al. Reference Sereda, Hartmann and Lucius2008) including nematodes, schistosomes and mites (Nisbet et al. Reference Nisbet, MacKellar, Wright, Brennan, Chua, Cheong, Thomas and Huntley2006) and is responsible for sea-food and dust-mite allergies (Sereda et al. Reference Sereda, Hartmann and Lucius2008).
Tropomyosin was cloned, sequenced, expressed, purified and used as a target in an antigen-specific ELISA. There was considerable variation among lambs in the response to tropomyosin. As with IgE responses to third- and fourth-stage larvae, the distribution of IgE activity against tropomyosin did not follow any of the standard distributions tested and a fourth-root transformation was found to normalise the data. The heritability of this response (0·25) was slightly but not significantly lower than the IgE response to the larval stages. This study involved phenotypes on over 200 lambs and pedigree information on 1126 animals. Testing more animals from additional flocks would be necessary to determine whether genetic variation in the IgE response to tropomyosin is significantly different from genetic variation in response to larval antigens in general.
There was an association between increased IgE activity against tropomyosin and reduced egg counts. This confirms and extends previous results reporting an association between IgE and resistance to T. circumcincta (Pettit et al. Reference Pettit, Jackson, Rocchi and Huntley2005). Our current understanding of resistance to T. circumcincta has already been reviewed (Stear et al. Reference Stear, Strain and Bishop1999a, Reference Stear, Strain and Bishopb). Briefly, lambs mount an IgA response that regulates worm growth and fecundity, possibly in conjunction with eosinophils (Henderson and Stear, Reference Henderson and Stear2006) and subsequently develop the ability to control worm numbers; probably through an IgE response that, in concert with mast cells, controls worm number. Mast cell degranulation is triggered by cross-linking of IgE on the mast cell surface. Presumably several parasite molecules could contribute to this process and natural immunity may involve an IgE response to large numbers of parasite molecules. For example, there is an association between increased IgE responses to a high molecular weight (approximately 150 kDa) molecule and reduced egg counts (Huntley et al. Reference Huntley, Redmond, Welfare, Brennan, Jackson, Kooyman and Vervelde2001). Similarily, increased IgE responses to aspartyl protease inhibitor from T. colubriformis were associated with reduced egg counts in naturally infected sheep from New Zealand (Shaw et al. Reference Shaw, McNeill, Maass, Hein, Barber, Wheeler, Morris and Shoemaker2003).
There was also an association between IgE activity and reduced body weight at the time of sampling. The key lesion responsible for the relative protein deficiency and pathology observed in infections with T. circumcincta seems to be mast cell degranulation and protease digestion of the tight junctions between epithelial cells (Stear et al. Reference Stear, Bishop, Henderson and Scott2003). Under this hypothesis, high IgE responses are both protective and pathogenic. The dual role of IgE responses may be part of the reason that sheep take so long to develop effective responses to control the number of abomasal parasites (McClure et al. Reference McClure, Emery, Bendixsen and Davey1998; Stear et al. Reference Stear, Bairden, Duncan, Holmes, McKellar, Park, Strain and Murray1997).
In conclusion, IgE activity against somatic antigens and tropomyosin from the larval stages of T. circumcincta following natural mixed nematode infection was overdispersed among lambs. The distribution of IgA activity was similar to a gamma distribution whereas IgE activity was different. Box-Cox analysis demonstrated that X0·25 was a suitable transformation. The transformed IgE activity was under moderate to strong genetic control. Nine different allergens were identified by proteomic analysis. One allergen – tropomyosin was selected for further analysis. IgE activity against tropomyosin was associated with decreased egg counts and with reduced body weight at the time of sampling.