


Introduction
Autism spectrum disorder (ASD) is characterized by impairments in social interaction, communication and emotional processing, as well as by restrictive, stereotyped and repetitive behaviours and interests. There is increasing evidence that these symptoms have a biological basis. Individuals with autism show evidence of altered structural and functional ‘connectivity’ across large-scale brain systems (Koshino et al. Reference Koshino, Carpenter, Minshew, Cherkassky, Keller and Just2005; Alexander et al. Reference Alexander, Lee, Lazar, Boudos, DuBray, Oakes, Miller, Lu, Jeong, McMahon, Bigler and Lainhart2007; Ben Bashat et al. Reference Ben Bashat, Kronfeld-Duenias, Zachor, Ekstein, Hendler, Tarrasch, Even, Levy and Ben Sira2007; Keller et al. Reference Keller, Kana and Just2007; Lee et al. Reference Lee, Bigler, Alexander, Lazar, DuBray, Chung, Johnson, Morgan, Miller, McMahon, Lu, Jeong and Lainhart2007; Jones et al. Reference Jones, Bandettini, Kenworthy, Case, Milleville, Martin and Birn2010; Weng et al. Reference Weng, Wiggins, Peltier, Carrasco, Risi, Lord and Monk2010). This aberrant brain messaging may be related to, or mirrored by, altered brain development (Courchesne, Reference Courchesne2004; Herbert et al. Reference Herbert, Ziegler, Makris, Filipek, Kemper, Normandin, Sanders, Kennedy and Caviness2004; Courchesne et al. Reference Courchesne, Redcay, Morgan and Kennedy2005) and differences in structural white and grey matter (Boddaert et al. Reference Boddaert, Chabane, Gervais, Good, Bourgeois, Plumet, Barthelemy, Mouren, Artiges, Samson, Brunelle, Frackowiak and Zilbovicius2004; McAlonan et al. Reference McAlonan, Cheung, Cheung, Suckling, Lam, Tai, Yip, Murphy and Chua2005). A recurrent finding in children with ASD is that of increased overall brain volume, which has been suggested to result from differences in early brain development (Courchesne et al. Reference Courchesne, Karns, Davis, Ziccardi, Carper, Tigue, Chisum, Moses, Pierce, Lord, Lincoln, Pizzo, Schreibman, Haas, Akshoomoff and Courchesne2001, Reference Courchesne, Pierce, Schumann, Redcay, Buckwalter, Kennedy and Morgan2007; Hazlett et al. Reference Hazlett, Poe, Gerig, Smith, Provenzale, Ross, Gilmore and Piven2005; Koshino et al. Reference Koshino, Carpenter, Minshew, Cherkassky, Keller and Just2005; Wassink et al. Reference Wassink, Hazlett, Epping, Arndt, Dager, Schellenberg, Dawson and Piven2007) and may be caused by differential effects driving white matter (WM) to be larger in the autistic brain. Specifically, those brain regions exhibiting the greatest volume increases correspond to later and prolonged myelinating pathways (Abell et al. Reference Abell, Krams, Ashburner, Passingham, Friston, Frackowiak, Happe, Frith and Frith1999; Aylward et al. Reference Aylward, Minshew, Field, Sparks and Singh2002; Carper & Courchesne, Reference Carper and Courchesne2005). Further (Catani et al. Reference Catani, Jones, Daly, Embiricos, Deeley, Pugliese, Curran, Robertson and Murphy2008; Fields, Reference Fields2008), these WM volume differences persist into young adulthood and extend fronto-temporally and fronto-occipitally within connecting fibre tracts including the inferior and superior longitudinal fasciculi, occipitofrontal fasciculus, and the external capsule.
The first signs of autism usually present in the first 3 years of life, and this time-frame corresponds temporally with the most dynamic period of brain myelination. The elaboration of the myelin sheath along WM axons and development of the myelinated WM progresses rapidly over the first 2 years of life (Waber et al. Reference Waber, De Moor, Forbes, Almli, Botteron, Leonard, Milovan, Paus and Rumsey2007; Deoni et al. Reference Deoni, Dean, O'Muircheartaigh, Dirks and Jerskey2012), and is tempo-spatially associated with evolving cognitive and behavioural functioning (Nagy et al. Reference Nagy, Westerberg and Klingberg2004; Johnson et al. Reference Johnson, Griffin, Csibra, Halit, Farroni, de Haan, Tucker, Baron-Cohen and Richards2005). Myelin plays a critical role in establishing and maintaining congruent brain communication, and contributes substantively to WM volume. Histological evidence for abnormal myelination, myelin content, or myelin structure in the pathogenesis of ASD is derived from ex vivo post-mortem studies showing altered myelin composition with delayed compaction in the sheaths (Casanova, Reference Casanova2004, Reference Casanova2006; Palmen et al. Reference Palmen, van Engeland, Hof and Schmitz2004; Buxhoeveden et al. Reference Buxhoeveden, Semendeferi, Buckwalter, Schenker, Switzer and Courchesne2006). Insufficient compaction of the lipid myelin bilayers, or compositional irregularity, can diminish the conductive potential of the myelinated axon and result in uncoordinated information transfer. To date, however, in vivo investigations of myelin alteration in autism [and its possible relationship(s) to clinical symptomology] have been indirect. For example, findings of some magnetic resonance spectroscopy studies are consistent with altered phospholipid metabolism in prefrontal brain regions (Murphy et al. Reference Murphy, Critchley, Schmitz, McAlonan, Van Amelsvoort, Robertson, Daly, Rowe, Russell, Simmons, Murphy and Howlin2002; Carper & Courchesne, Reference Carper and Courchesne2005). Studies of WM microstructure and micro-organization using diffusion tensor (DT)-MRI and relaxation time measurements (also termed relaxometry) have also provided indirect support for altered myelin content and structure. Cross-sectional DT-MRI studies have reported alterations in WM fractional anisotropy (FA), as well as mean and radial diffusivity (although considerable heterogeneity exists in the anatomical location of these differences), which may be related to altered myelin integrity alongside changes in fibre coherence and architecture. Developmentally, FA has also been reported to increase more slowly between 6 and 24 months of age in infants later diagnosed with autism (despite having increased FA at 6 months) (Wolff et al. Reference Wolff, Gu, Gerig, Elison, Styner, Gouttard, Botteron, Dager, Dawson, Estes, Evans, Hazlett, Kostopoulos, McKinstry, Paterson, Schultz, Zwaigenbaum and Piven2012). Voxel-wise comparisons of T 2 and T 2* relaxation times (Hendry et al. Reference Hendry, DeVito, Gelman, Densmore, Rajakumar, Pavlosky, Williamson, Thompson, Drost and Nicolson2006) revealed an overall increase in cerebral WM T 2 in patients with autism. Regionally, T 2 was increased in associated WM of the bilateral primary sensory association areas in the parietal lobes, the visual association areas in the occipital lobes, and the WM underlying the supplementary motor areas (SMAs) in the frontal lobes. These observed T 2 increase could reflect reduced myelin content, and correspondingly increased water content, in the ASD brain.
These studies represent important steps in elucidating microstructural abnormalities in the ASD brain. Although indirect, taken together, they support the suggestion that individuals with ASD have abnormalities in brain WM (and specifically myelin content) that may underpin some symptoms. However, to date, this hypothesis has not been directly tested in vivo due to the difficulty in specifically and quantitatively measuring myelin content (Beaulieu, Reference Beaulieu2002; Madler et al. Reference Madler, Drabycz, Kolind, Whittall and MacKay2008). For instance, while alterations in myelin content may influence DT-MRI and relaxation-time measurements, these are not specific or quantitative measures of myelin content as they also reflect other biophysical and biochemical features (e.g. water content, fibre architecture, density and coherence, and/or membrane permeability). Currently, the most robust approach to quantitatively estimating myelin content is through multi-component relaxation analysis (MCR) (Whittall et al. Reference Whittall, MacKay, Graeb, Nugent, Li and Paty1997). Within brain tissue, MCR aims to decompose the measured MR signal into contributions from two anatomically distinct water compartments: the slow relaxing intra- and extra-axonal water; and the faster relaxing water trapped between the myelin bilayers. Using MCR an estimate of the myelin-associated water pool's volume fraction, termed the myelin water fraction (MWF) is derived, which has been shown to correlate strongly with ‘gold standard’ histological estimates of myelin content (Beaulieu et al. Reference Beaulieu, Fenrich and Allen1998; Gareau et al. Reference Gareau, Rutt, Karlik and Mitchell2000; Webb et al. Reference Webb, Munro, Midha and Stanisz2003; Laule et al. Reference Laule, Leung, Lis, Traboulsee, Paty, MacKay and Moore2006, Reference Laule, Kozlowski, Leung, Li, Mackay and Moore2008). MCR has been used to investigate demyelinating disorders such as multiple sclerosis (MacKay et al. Reference MacKay, Vavasour, Rauscher, Kolind, Madler, Moore, Traboulsee, Li and Laule2009; Kitzler et al. Reference Kitzler, Su, Zeineh, Harper-Little, Leung, Kremenchutzky, Deoni and Rutt2012; Kolind et al. Reference Kolind, Matthews, Johansen-Berg, Leite, Williams, Deoni and Palace2012), as well as neurodevelopment in infants, toddlers and young children (Deoni et al. Reference Deoni, Mercure, Blasi, Gasston, Thomson, Johnson, Williams and Murphy2011, Reference Deoni, Dean, O'Muircheartaigh, Dirks and Jerskey2012).
We are the first to use a time-efficient MCR technique, termed mcDESPOT (multi-component-driven equilibrium singl- pulse observation of T 1 and T 2) (Deoni et al. Reference Deoni, Rutt, Arun, Pierpaoli and Jones2008), to compare MWF estimates in young adults with ASD and matched typically developing controls. We tested the main null hypothesis that people with autism exhibit no differences in MWF. We also tested the subsidiary null hypothesis that differences in brain MWF are not associated with variation in clinical symptoms. In addition to MWF, mcDESPOT also provides quantitative T 1 and T 2 relaxation-time estimates. We therefore tested the main and subsidiary null hypotheses using these measures to determine if prior studies of T 2 change in ASD (Hendry et al. Reference Hendry, DeVito, Gelman, Densmore, Rajakumar, Pavlosky, Williamson, Thompson, Drost and Nicolson2006) were linked to alterations in myelin, or if they reflected changes in other tissue microstructure and biochemical features (i.e. iron content, water content, etc.).
Methods and materials
Participants
Fourteen adult males with ASD and 14 healthy comparison male subjects (who did not differ significantly in age or IQ) were recruited into the study. All participants had a full-scale IQ <70 as measured by the Wechsler Abbreviated Scale of Intelligence (WASI; Wechsler, Reference Wechsler1999). Participants with ASD were diagnosed according to ICD-10 research criteria (International Statistical Classification of Diseases and Health Related Problems – 10th revision; WHO, 2004) The initial clinical diagnosis was confirmed using the Autism Diagnostic Interview – Revised (ADI-R; Lord et al. Reference Lord, Rutter and Le Couteur1994) and current symptoms were assessed using the Autism Diagnostic Observation Schedule (ADOS; Lord et al. Reference Lord, Rutter, Goode, Heemsbergen, Jordan, Mawhood and Schopler1989). All cases reached ADI-R algorithm cut-offs in the three domains of impaired social interaction, communication and repetitive behaviours and stereotyped patterns (see Table 1 for details). In addition, autistic traits were assessed in all participants using the Autism Quotient (AQ) – a self-report screening instrument that measures where an adult with normal intelligence lies on the continuum from autism to normality (Baron-Cohen et al. Reference Baron-Cohen, Wheelwright, Hill, Raste and Plumb2001; Woodbury-Smith et al. Reference Woodbury-Smith, Robinson, Wheelwright and Baron-Cohen2005).
Table 1. Summary of subject characteristics including age, and verbal IQ, performance IQ, and full-scale IQ scores (VIQ, PIQ, and FSIQ) as derived from the Wechsler Abbreviated Scale of Intelligence (WASI). All subjects were right-handed males. Means and standard errors of the mean (s.e.m.) are given; between-group differences in age, VIQ, PIQ, FSIQ, AQ, empathy quotient (EQ) and systemizing quotient (SQ) scores were calculated using t tests

ADOS, Autism Diagnostic Observation Schedule; ADI-R, Autism Diagnostic Interview – Revised.
Exclusion criteria for participants included: left handedness, history of intellectual disability (i.e. full-scale IQ < 70), major psychiatric disorder (e.g. psychosis or the use of antipsychotic medication), head injury, genetic disorder associated with autism (e.g. fragile X syndrome, tuberous sclerosis), or any other medical condition affecting brain function (e.g. epilepsy).
The study was approved by the National Research Ethics Committee, Suffolk. Informed written consent was obtained from all study participants.
Magnetic resonance imaging
Voxel-wise MWF maps were acquired of each participant using the mcDESPOT technique (n = 46), which involves the acquisition of series of T 1-weighted SPoiled GRadient recalled echo (SPGR, or spoiled FLASH) and T 1/T 2-weighted balanced steady-state free precession (SSFP, FIESTA or TrueFISP) data over an incremented range of flip angles.
All imaging was performed on a GE Signa HDx 1.5 T clinical scanner equipped with an 8-channel head RF coil array. Whole-brain, sagittally oriented mcDESPOT data were acquired with a common 22 cm × 22 cm × 16 cm field of view (FOV) and 128 × 128 × 92 imaging matrix. To reduce acquisition time, data were acquired with 3/4 partial Fourier acquisition. Sequence-specific acquisition parameters were as follows:
SPGR. Echo time (TE)/repetition time (TR) = 2.5 ms/5.3 ms, flip angles (α) = 3°, 4°, 5°, 6°, 7°, 9°, 12° and 17°, receiver bandwidth (BW) = ±22.3 kHz.
SSFP. TE/TR = 1.6 ms/3.2 ms, α = 12°, 16°, 21°, 27°, 33°, 40°, 5°1 and 68°, BW = ±50 kHz.
The SSFP data were acquired with two phase-cycling increments (0° and 180°), allowing correction for main magnetic field (B 0) off-resonance effects (Deoni, Reference Deoni2009). An inversion prepared (IR-)SPGR image was also acquired (same FOV, 128 × 64 × 46 acquisition matrix, TE/TR/inversion time/α = 2.5 ms/5.3 ms/350 ms/5°; and BW = ±22.3 kHz) to correct for flip angle (B 1) inhomogeneity (Deoni, Reference Deoni2007).
Data analysis
T1, T2 and MWF calculation
Following acquisition, each participant's data were linearly co-registered to correct for subtle intra-session motion (Jenkinson et al. Reference Jenkinson, Bannister, Brady and Smith2002), non-parenchyma signal was removed (Smith, Reference Smith2002), and voxel-wise T 1, T 2 and MWF estimates were calculated as described in Deoni et al. (Reference Deoni, Matthews and Kolind2013), providing 3-dimensional ‘maps’ of these parameters. These maps from each participant were then nonlinearly co-registered to custom T 1-weighted template constructed from a subsample of six healthy and six ASD participants. This template was created from the high flip angle T 1-weighted SPGR image of each included participant using symmetric diffeomorphic normalization (SyN; Avants et al. Reference Avants, Epstein, Grossman and Gee2008) as implemented in the ANTs package, and a cross-correlation similarity measure (http://picsl.upenn.edu/ANTS), using the buildtemplateparallel.sh script distributed with the ANTs package (Avants et al. Reference Avants, Yushkevich, Pluta, Minkoff, Korczykowski, Detre and Gee2010). Subsequent registration of each study participant's MWF, T 1 and T 2 maps to the common template was accomplished by first nonlinearly co-registering each participant's high flip angle T 1-weighted SPGR image to the common template and then applying the calculated transformation matrix to the corresponding T 1, T 2 and MWF maps.
Group-wise comparisons of T1, T2 and MWF
Group-wise comparison of T 1, T 2 and MWF between the ASD and matched typically developing controls was performed via voxel-wise unpaired two-tailed t tests, with cluster-based correction for multiple comparisons and false discovery. A 3 mm full-width-at-half-maximum Gaussian kernel was used to smooth the T 1, T 2 and MWF data, and non-parametric permutation testing used to perform the group comparison (performed using the randomize tool included in the FMRIB Software Library; http://www.fmrib.ox.ac.uk/fsl/). Cluster-based correction was performed using a cluster threshold of 2.5. Significance was defined as p < 0.05, cluster corrected.
Correlations between T1, T2 and MWF and symptom measures
To examine the subsidiary hypothesis that altered T 1, T 2 and/or MWF are associated with autism spectrum traits, voxel-wise correlation analysis was performed in ASD individuals between T 1, T 2 and MWF, and total ADOS scores, as well as the communication, social and repetitive domains subscores; ADI-R communication, social, repetitive, and developmental domain subscores; and total AQ scores.
Similar correlation analysis was also performed between T 1, T 2 and MWF, and total AQ score within the typically developing control group only. Finally, correlations between T 1, T 2 and MWF, and total AQ score were investigated in the combined ASD + typically developing control group.
All correlation analysis was performed via the randomize tool using non-parametric testing, with cluster-based correction for multiple comparisons (threshold = 2.5) and statistical significance was defined as p < 0.05, cluster corrected.
Results
Demographic data (Table 1)
A summary of the healthy and ASD cohorts, including mean age, verbal IQ, performance IQ, full-scale IQ, AQ, as well as ADOS and ADI-R total and subscore measures are provided in Table 1.
The groups did not differ significantly in mean age, full-scale, verbal, or performance IQ scores. As expected, ASD subjects had significantly higher AQ scores relative to the healthy participants.
Mean cerebral and cerebellar volumes and total WM volumes did not differ significantly between individuals with autism and healthy controls (Table 2).
Table 2. Summary of mean volumes (ml) with standard deviations (s.d.) and between-group differences calculated using t tests

Group-wise comparisons of T 1, T 2 and MWF (Fig. 1)
Widespread differences in MWF (all significantly reduced in individuals with ASD compared to controls) and T 1 (all significantly increased in individuals with ASD compared to controls) were found. No significant differences in T 2 were observed. From the MWF results, significantly (p < 0.05) reduced MWF was observed in ASD individuals bilaterally within the cerebellum, thalamus, internal capsule, caudate nuclei, temporal and occipital WM, the SMA and pre-SMA, and cingulum; and right frontal WM. Significantly (p < 0.05) increased T 1 was observed in ASD individuals bilaterally within the cerebellum, thalamus, and internal capsule; and in right temporal and occipital WM.
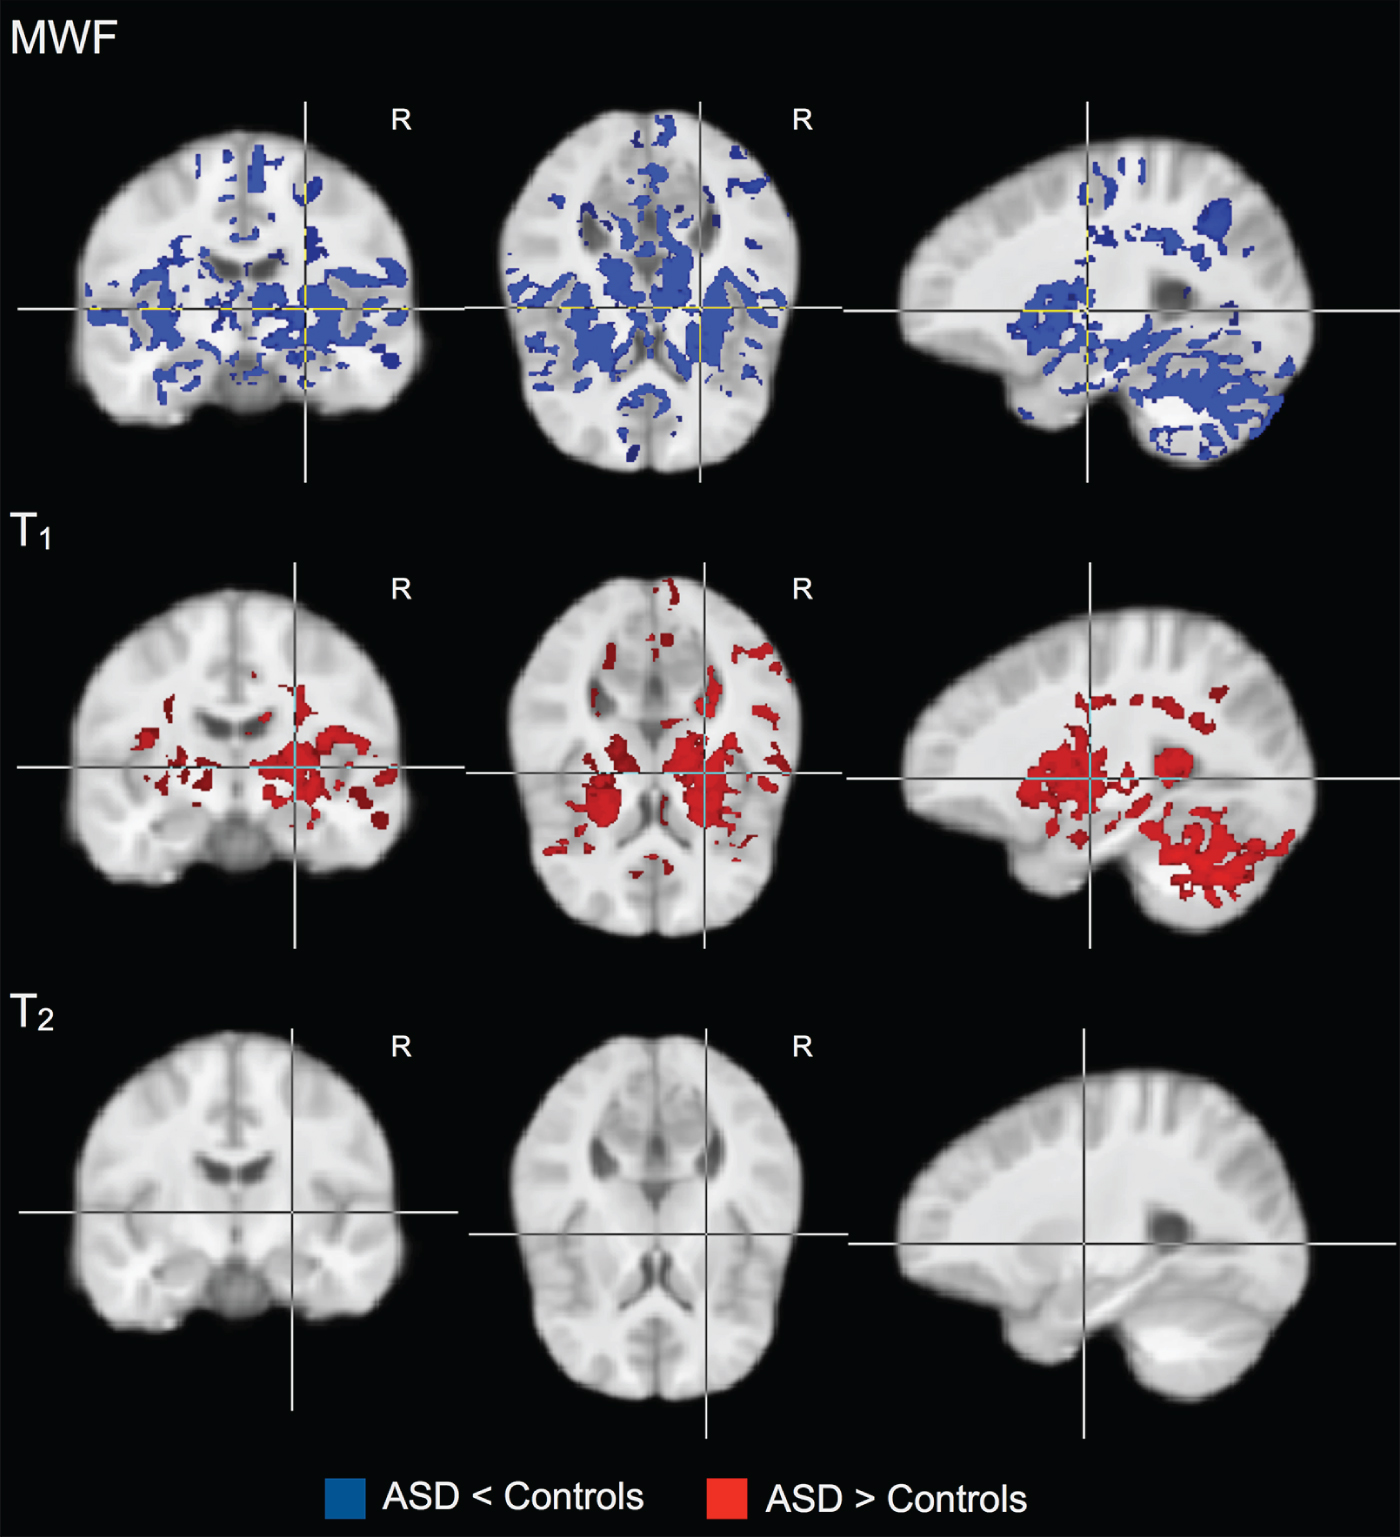
Fig. 1. Groupwise myelin water fraction (MWF), T 1 and T 2 comparisons between individuals with autism spectrum disorder (ASD) and healthy controls. Individuals with ASD show widespread significant (p < 0.05) reductions in MWF, with associated increased T 1. No significant differences were observed in T 2.
Correlations between T 1, T 2 and MWF and symptom measures (Figs 2 and 3)
Within individuals with ASD, there was a significant (p < 0.05) negative correlation between: (1) total ADOS score and MWF (i.e. lower MWF was associated with more abnormal current behaviour) bilaterally in the thalamus and caudate; and in the right frontal lobe and external capsule (Fig. 2); (2) negative correlation between ADOS social interaction subscore and MWF bilaterally in the thalamus; and in the right temporal and frontal lobes and cingulum (Fig. 2); and (3) negative correlation between AQ score and MWF in the right cerebellum, occipital lobe and superior corona radiata (Fig. 2). We found no significant associations between MWF and ADI or any other subscales of the ADOS or ADI. We found no significant associations between T 1 or T 2 and any ADI, ADOS or AQ measure.
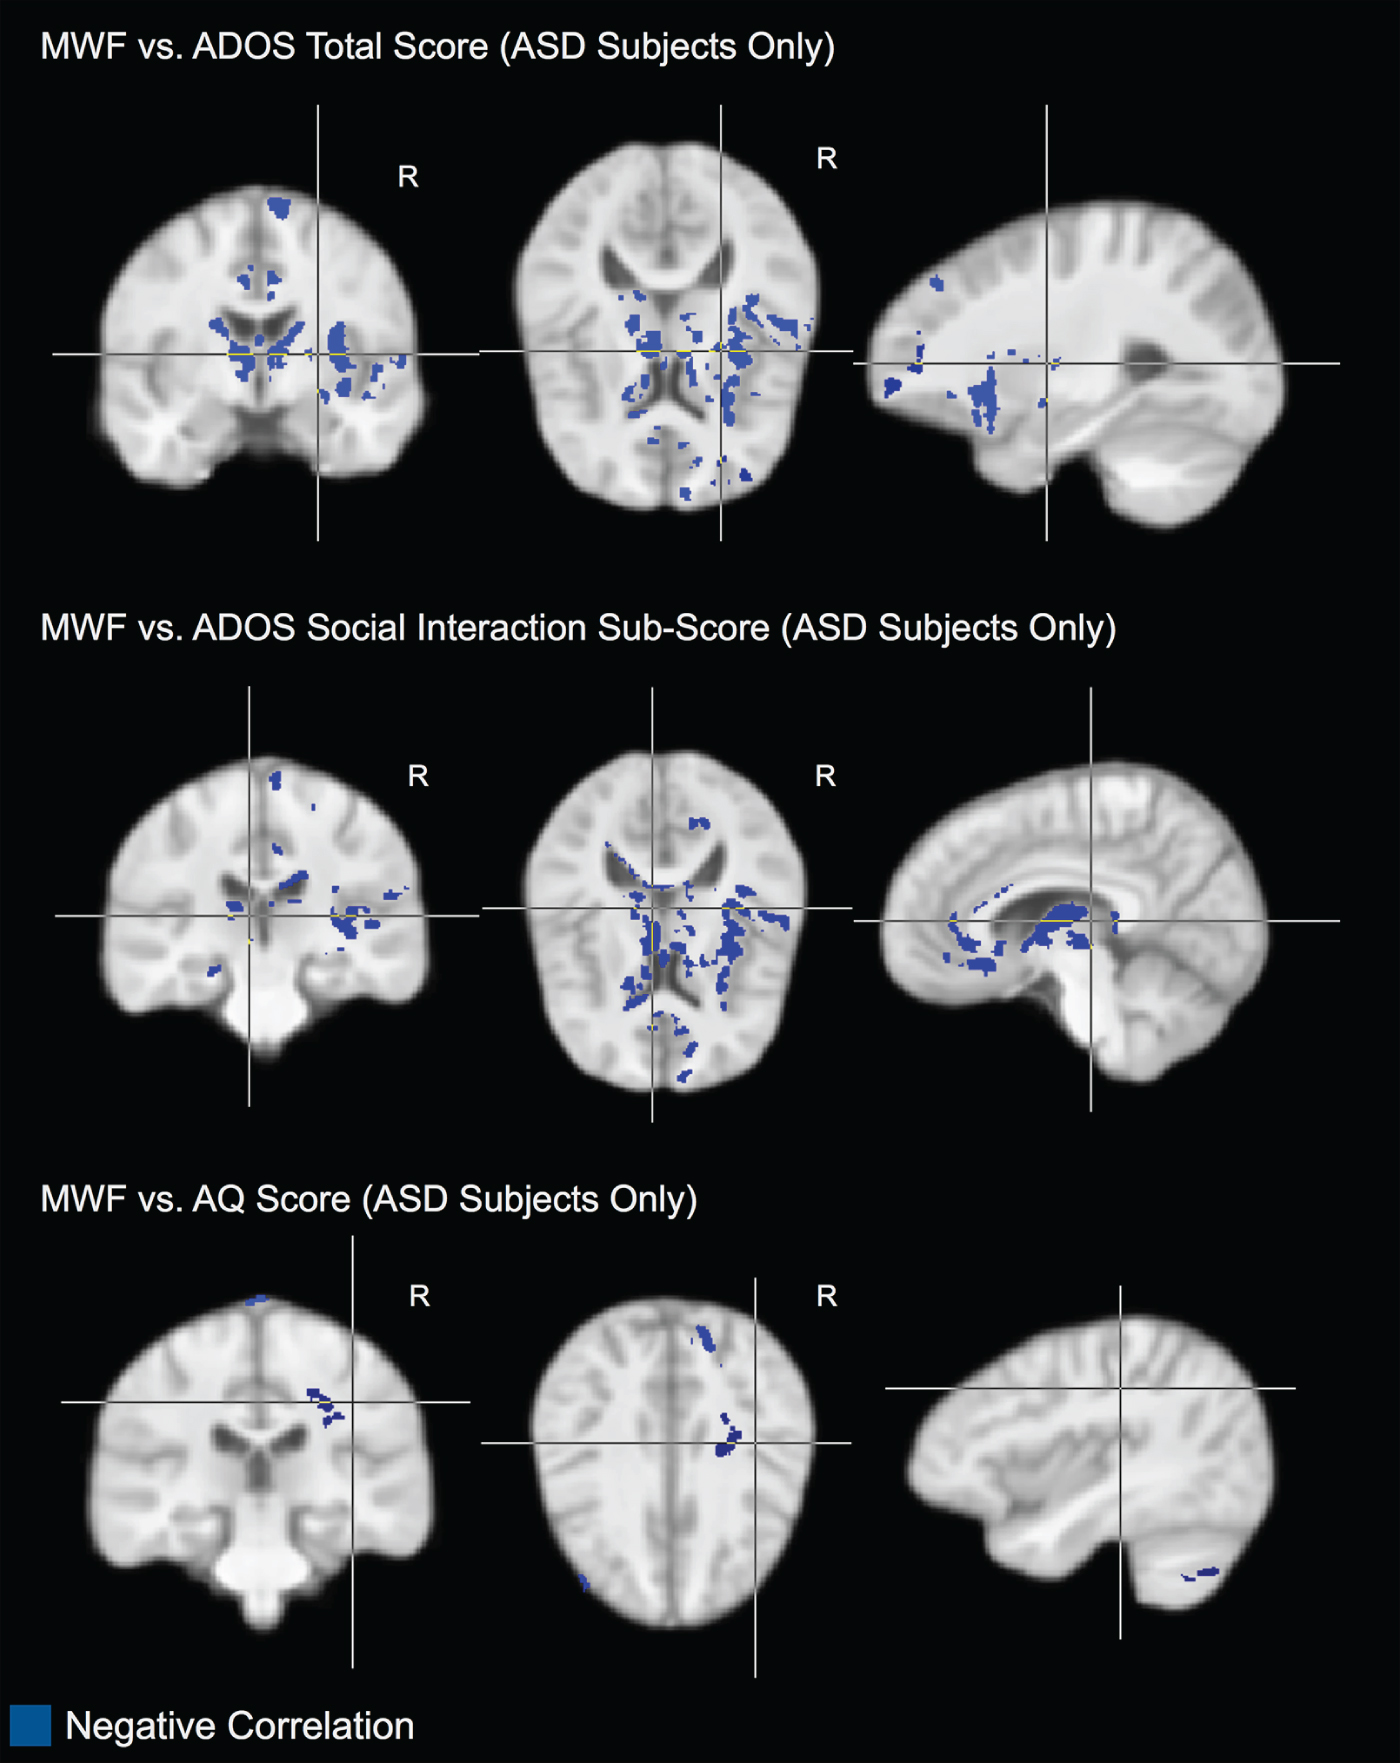
Fig. 2. Areas of significant (p < 0.05) negative correlation between myelin water fraction (MWF) and Autism Diagnostic Observation Schedule (ADOS) total score; MWF and ADOS social interaction subscore; and MWF and Autism Quotient (AQ) score with the autism spectrum disorder (ASD) subjects only. In these regions, reduced MWF is associated with more abnormal behaviour.

Fig. 3. Areas of significant (p < 0.05) negative correlation between myelin water fraction (MWF) and Autism Quotient (AQ) scores in the combined autism spectrum disorder (ASD) plus control subjects. In these areas, reduced MWF is associated with higher AQ scores.
When we examined the dimensional relationship between autistic traits and MWF across all individuals (i.e. combining ASD and typically developing participants), we found a significant (p < 0.05) negative correlation between MWF and AQ score bilaterally in the thalamus and cerebellum (Fig. 3). No significant correlations were found between either T 1 or T 2 and AQ score in the combined group.
Discussion
In this work, we have examined if individuals with ASD have significant differences in brain myelin content, or MWF, and if these differences may, in part, explain prior findings of T 2 relaxation time differences in ASD. This is the first study to use a whole-brain multicomponent relaxometry approach to more specifically interrogate myelin content differences in ASD. While the number of participants in the study was small (14 in each group), the individuals with autism were free of many potential confounds that affect brain structure and function (e.g. epilepsy and/or intellectual disability). This homogeneous sample provided sufficient power to detect highly significant group differences.
Our results show that individuals with autism have widespread MWF reductions in brain regions previously implicated in ASD. Increased T 1 was also found in areas exhibiting lower MWF measures; however, the extent of T 1 differences was smaller than MWF differences. No group T 2 differences were found. Spatial inconsistencies in MWF, T 1 and T 2 changes reaffirm that these measures reflect different aspects of tissue microstructure. While both T 1 and T 2 are affected by changes in water, macromolecule, lipid and protein content, T 2 is also sensitive to changes in iron and other paramagnetic material content. MWF is believed to be more specific to changes in lipid myelin content. Our observation of T 1 and MWF differences suggests that myelin lipid and water content are altered in ASD (Alexander et al. Reference Alexander, Hurley, Samsonov, Adluru, Hosseinbor, Mossahebi, Tromp do, Zakszewski and Field2011).
Within the ASD group, a significant negative correlation was found between MWF and the social domain of the ADOS in regions that are known to be involved in social processing. Previous DT-MRI studies of structural connectivity have, likewise, shown abnormal WM microstructure in pathways through, or connecting, these regions (Cheng et al. Reference Cheng, Chou, Chen, Fan, Decety and Lin2010). The absence of a similar finding with respect to ADI-R scores is likely reflective of the ADOS measuring current behaviour, whereas the ADI-R is mainly a measure of past behaviour.
Our findings of widespread disturbances in WM myelin content are consistent with, and add to, prior reports of WM alterations in autism. DT-MRI studies have shown reduced FA (an indicator of microstructural coherence) in the corpus callosum, internal capsule, and other WM regions (e.g. see Courchesne, Reference Courchesne2004; Herbert et al. Reference Herbert, Ziegler, Makris, Filipek, Kemper, Normandin, Sanders, Kennedy and Caviness2004; Courchesne et al. Reference Courchesne, Redcay, Morgan and Kennedy2005; Jones et al. Reference Jones, Bandettini, Kenworthy, Case, Milleville, Martin and Birn2010, among others). Voxel-based morphopmetric analyses have reported widespread differences in WM volume (or density) (Ben Bashat et al. Reference Ben Bashat, Kronfeld-Duenias, Zachor, Ekstein, Hendler, Tarrasch, Even, Levy and Ben Sira2007; Lee et al. Reference Lee, Bigler, Alexander, Lazar, DuBray, Chung, Johnson, Morgan, Miller, McMahon, Lu, Jeong and Lainhart2007). Unfortunately, relating these observed FA or morphometric findings to specific WM disruptions (i.e. myelin loss, reduced axonal size or density, etc.) has been challenging. Alterations in FA, for example, can reflect changes in myelin, fibre coherence, density, etc. Likewise, alterations in WM density can reflect fibre density and water content (Beaulieu, Reference Beaulieu2002), as well as inconsistencies in MR tissue contrast. Thus, while these prior studies have consistently demonstrated altered WM in autism, they have been unable to elucidate the particular mechanism(s) responsible. Our results are the first to specifically investigate the role of myelin in autism, and to link observed changes in MWF to autistic traits and symptoms.
The development of myelin (myelination) plays a critical role in brain development. The formation of efficient information pathways throughout the brain is essential for normal function, cognition and behaviour. Our study has revealed widespread myelin alteration through MWF reduction in the brain of adults with autism. However, a limitation of our cross-sectional study design is that we cannot state when these deficits first arose, or whether they are secondary to other pathological processes. For example, prematurity, low birth weight, and ischaemic injury at birth have all been associated with WM microstructural changes, as assessed with DT-MRI, in later life (Skranes et al. Reference Skranes, Vangberg, Kulseng, Indredavik, Evensen, Martinussen, Dale, Haraldseth and Brubakk2007; Allen, Reference Allen2008; Constable et al. Reference Constable, Ment, Vohr, Kesler, Fulbright, Lacadie, Delancy, Katz, Schneider, Schafer, Makuch and Reiss2008; Rose et al. Reference Rose, Hatzigeorgiou, Strudwick, Durbridge, Davies and Colditz2008). However, to the best of our knowledge, no in vivo study has yet investigated brain myelination in children or adults who had these birth difficulties and, thus, how myelination is affected. To investigate these crucial questions, longitudinal studies of myelination in typically developing children and children at risk for autism, controlling for prematurity, etc., are required.
Associations between myelin development and the genetic and epigenetic factors contributing to autism also warrant further investigation. For example, knowledge of the timing, location and degree to which gene expression is disrupted in the pathway to the development of ASD is crucial for developing therapeutic strategies (Geschwind & Levitt, Reference Geschwind and Levitt2007). To date, however, few human studies have investigated myelin-associated genes, including myelin basic protein (MBP), proteolipid protein (PLP) or myelin oligodrendrocyte glycoprotein (MOG), in ASD. Animal studies, however, have shown the expression of genes associated with MBP, MOG and PLP are altered following prenatal viral infection, which some have reported as being associated with the development of autism (Fatemi et al. Reference Fatemi, Folsom, Reutiman, Abu-Odeh, Mori, Huang and Oishi2009). Additionally, the SLC25A12 (solute carrier family 25 member 12) gene, identified by some as an autism susceptibility gene (Ramoz et al. Reference Ramoz, Reichert, Smith, Silverman, Bespalova, Davis and Buxbaum2004), has recently been associated with global hypomyelination (Wibom et al. Reference Wibom, Lasorsa, Tohonen, Barbaro, Sterky, Kucinski, Naess, Jonsson, Pierri, Palmieri and Wedell2009). Although preliminary, these reports suggest the need for further combined imaging and genetic studies of myelination in ASD.
A further question not addressed in our work is whether the detected MWF abnormalities are causative of observed clinical deficits, or if they are symptoms of other pathological processes. For example, myelination of the brain in early infancy is believed to follow a pattern that spatially and temporally corresponds to the developing neuronal systems (Paus et al. Reference Paus, Collins, Evans, Leonard, Pike and Zijdenbos2001; Durston & Casey, Reference Durston and Casey2006). However, it is not yet known if, for example, abnormal myelination of language pathways results in poor language performance, or if inadequate learning of language results in under-myelination of those neural pathways. Again, understanding of these relationships, and how they are affected in ASD, necessitates longitudinal studies of young children with autism or infants at risk of developing the disorder.
Our results, however, do show that autistic traits are associated with lower MWF measures within relevant WM pathways and are consistent with prior reports of microstructural abnormality and hypothesized aberrant connectivity. Myelin plays a critical role in facilitating coordinated information transfer throughout the brain (as evidenced by the loss of function and cognition observed in demyelinating disorders such as multiple sclerosis). Altered myelin, therefore, is likely associated with reduced connectivity. Our results are consistent with the current hypothesis that neural disconnectivity underpins ASD (Belmonte et al. Reference Belmonte, Allen, Beckel-Mitchener, Boulanger, Carper and Webb2004; Alexander et al. Reference Alexander, Lee, Lazar, Boudos, DuBray, Oakes, Miller, Lu, Jeong, McMahon, Bigler and Lainhart2007; Hughes, Reference Hughes2007; Kleinhans et al. Reference Kleinhans, Richards, Sterling, Stegbauer, Mahurin, Johnson, Greenson, Dawson and Aylward2008), as supported by structural imaging studies (Barnea-Goraly et al. Reference Barnea-Goraly, Kwon, Menon, Eliez, Lotspeich and Reiss2004; Ben Bashat et al. Reference Ben Bashat, Kronfeld-Duenias, Zachor, Ekstein, Hendler, Tarrasch, Even, Levy and Ben Sira2007); functional imaging studies (Castelli et al. Reference Castelli, Frith, Happe and Frith2002; Villalobos et al. Reference Villalobos, Mizuno, Dahl, Kemmotsu and Muller2005; Weng et al. Reference Weng, Wiggins, Peltier, Carrasco, Risi, Lord and Monk2010); and electroencephalography investigations (Grice et al. Reference Grice, Spratling, Karmiloff-Smith, Halit, Csibra, de Haan and Johnson2001; Brown et al. Reference Brown, Gruber, Boucher, Rippon and Brock2005). In each of these prior studies, abnormal connectivity was observed in frontal and temporal regions, consistent with our findings of lower myelin content in these areas.
In conclusion, the results of our study demonstrate for the first time that adults with ASD have highly significant (widespread) differences in myelin content (as measured by MWF) compared to age- and IQ-matched controls; and that differences in myelin content in some brain regions are related to clinical symptoms and autistic traits.
Appendix
The MRC AIMS Consortium is a collaboration of autism research centres in the UK including the Institute of Psychiatry, London, The Autism Research Centre, University of Cambridge, and the Autism Research Group, University of Oxford. It is funded by the Medical Research Council (MRC) UK and headed by the Department of Forensic and Neurodevelopmental Sciences, Institute of Psychiatry. The Consortium members are (in alphabetical order): Bailey AJ, Baron-Cohen S, Bolton PF, Bullmore ET, Carrington S, Chakrabarti B, Daly EM, Deoni SC, Ecker C, Happe F, Henty J, Jezzard P, Johnston P, Jones DK, Lombardo M, Madden A, Mullins D, Murphy CM, Murphy DG, Pasco G, Sadek S, Spain D, Steward R, Suckling J, Wheelwright S and Williams SC.
Acknowledgements
This work was supported by the Autism Imaging Multicentre Study Consortium, Medical Research Council UK Grant G0400061, and by European Autism Interventions – A Multicentre Study for Developing New Medications (EU-AIMS), which receives support from the Innovative Medicines Initiative Joint Undertaking under grant agreement no. 115300; and by a Medical Research Council fellowship awarded to S.D. (G0800298). We thank the National Institute for Health Research Biomedical Research Centre for Mental Health, and the Dr Mortimer and Theresa Sackler Foundation for their financial support.
Declaration of Interest
None.


